Disneyland Resort Crowd Report – September 28 to October 4, 2014
Late September usually brings crowds that are slightly busier than early September but still manageable and our predictions held true again this year. We also are seeing a continuation of the trend that weekends are busier than weekdays at Disneyland Resort.
Let’s look at how the crowd levels stacked up each day last week on the TouringPlans.com Disneyland Resort Crowd Report:
| WHAT WE THOUGHT |
WHAT WE SAW |
ANALYSIS | |
|---|---|---|---|
| Disneyland Park |
4
|
5
|
Sunday’s crowd level ‘5’ was one level higher than predicted but mainly because of a couple attractions that had significant waits. Big Thunder Mountain averaged a posted time of 27 minutes (predicted 16) and Finding Nemo Submarine Voyage averaged 42 (predicted 22) while most others were within a few minutes of predicted. |
| Disney California Adventure |
4
|
4
|
|
| WHAT WE THOUGHT |
WHAT WE SAW |
ANALYSIS | |
| Disneyland Park |
3
|
4
|
On Monday, slightly higher than expected waits again but not significantly so. Radiator Springs came in at 53 minutes which was actually lower than the 64 we predicted. |
| Disney California Adventure |
2
|
3
|
|
| WHAT WE THOUGHT |
WHAT WE SAW |
ANALYSIS | |
| Disneyland Park |
3
|
3
|
Lowest crowd of the week at Disneyland Park on Tuesday and Wednesday, with average waits like 11 minutes at Big Thunder, 20 at Indiana Jones and 14 at the Matterhorn. |
| Disney California Adventure |
3
|
2
|
|
| WHAT WE THOUGHT |
WHAT WE SAW |
ANALYSIS | |
| Disneyland Park |
3
|
3
|
Wednesday brought the same crowd index on our scale that we saw the day before. Even Disney California Adventure’s Early Entry morning was not enough to push average wait times above 15 minutes for most attractions. Only Toy Story Midway Mania (24 minutes) and Radiator Springs Racers (50) saw significant waits. |
| Disney California Adventure |
3
|
2
|
|
| WHAT WE THOUGHT |
WHAT WE SAW |
ANALYSIS | |
| Disneyland Park |
3
|
4
|
A slight bump in crowd levels at Disneyland Park on Thursday although only Splash Mountain saw an average wait time above 40 minutes (41, predicted 24). Small World was only 6 (predicted 8) and Buzz Lightyear 5 (predicted 6). |
| Disney California Adventure |
3
|
2
|
|
| WHAT WE THOUGHT |
WHAT WE SAW |
ANALYSIS | |
| Disneyland Park |
4
|
3
|
The slow start to October crowds continued on Friday with wait times reaching a level ‘3’ at both parks. Indiana Jones wait times came in low (22, predicted 34) while Alice in Wonderland was high (30, predicted 22). |
| Disney California Adventure |
3
|
3
|
|
| WHAT WE THOUGHT |
WHAT WE SAW |
ANALYSIS | |
| Disneyland Park |
6
|
6
|
As predicted, Disneyland crowds jumped up a couple points to a level ‘6’ on Saturday. But, Disney California Adventure’s crowds came in lower than expected by a couple points. |
| Disney California Adventure |
5
|
3
|
|
| August 31 to September 6, 2014 |
|---|
Late September and early October crowds are somewhat busier than earlier September and we expect that trend to continue this year. In fact, crowds should slowly increase right up until the peak Thanksgiving season in November.
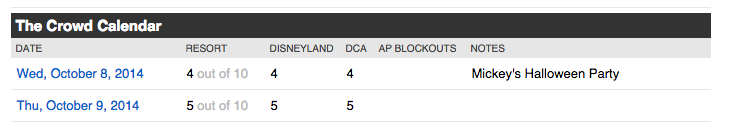
To see Disneyland Resort Crowd predictions for the days of your vacation, check the Crowd Calendar.![]()
To get details about our predictions of future crowds or details about crowds in the past check out the Crowd Calendar and select “Jump to Date” on the left margin.
You May Also Like...
-

It is time for an update to the Disneyland Resort Crowd Calendar. Crowds Since Galaxy's Edge Opened Crowd levels have been…
-

Disneyland is Opening! On April 30, 2021, Disneyland will reopen to Californians for the first time since March 13, 2020. The…
-
Since September 1, 2019, crowds at Disneyland Resort and Universal Orlando Resort have been down compared to the same time in…
-
Everyone's number one priority right now is to help slow the spread of COVID-19 by practicing social distancing. Disney did their…