
Animal Kingdom posts highest waits of past year – Disney World crowds for Wednesday, July 14, 2021
Average posted wait times were 63 minutes at the Animal Kingdom today, the highest average that park has seen since reopening in 2020. Those wait times were driven by lines at Avatar Flight of Passage, where posted wait times hit 210 minutes around 11:30 a.m. but only stayed there for around 15 minutes. And we got an actual wait time of 130 minutes around then, which was almost an hour lower than the posted wait at the time. Still, there’s no doubt that the park is seeing its largest crowds of the past year, and that it needs to add capacity that has been lost at Finding Nemo: The Musical and from various live performers, to draw people away from the relatively few attractions the park has.

To put today’s crowds in perspective, an average posted wait of 63 minutes wouldn’t have been anywhere close to the top 10 days in 2019 – in fact, it wouldn’t have been in the top 20, 30, or 40 days. The highest-wait days in 2019 were around 100 minutes per attraction, with an average wait of nearly 4 hours at Flight of Passage. Here’s December 29, 2018 as an example, which was the second-highest day in 2018:

Around the parks, we’ve got 160 actual wait times so far today from our fabulous Lines community! Let’s do the rest of the numbers!
Animal Kingdom Wait Times
DINOSAUR had an average wait time today of 54 minutes. Its 7-day average is 40 minutes, so today ranks #1 for this week. Its 30-day average is 28 minutes, so today ranks #1 for the past month. Its 365-day average is 33 minutes, so today ranks #38 for the past year.
Expedition Everest – Legend of the Forbidden Mountain had an average wait time today of 50 minutes. Its 7-day average is 41 minutes, so today ranks #1 for this week. Its 30-day average is 34 minutes, so today ranks #2 for the past month. Its 365-day average is 26 minutes, so today ranks #9 for the past year. We received 5 actual wait times today, and the actual wait averaged 56% of the posted wait time.
Kali River Rapids had an average wait time today of 49 minutes. Its 7-day average is 53 minutes, so today ranks #4 for this week. Its 30-day average is 41 minutes, so today ranks #5 for the past month. Its 365-day average is 25 minutes, so today ranks #13 for the past year.
Kilimanjaro Safaris had an average wait time today of 66 minutes. Its 7-day average is 54 minutes, so today ranks #1 for this week. Its 30-day average is 41 minutes, so today ranks #1 for the past month. Its 365-day average is 27 minutes, so today ranks #1 for the past year. We received 8 actual wait times today, and the actual wait averaged 69% of the posted wait time.
It’s Tough to Be a Bug! had an average wait time today of 26 minutes. Its 7-day average is 17 minutes, so today ranks #1 for this week. Its 30-day average is 14 minutes, so today ranks #1 for the past month. Its 365-day average is 18 minutes, so today ranks #88 for the past year.
TriceraTop Spin had an average wait time today of 22 minutes. Its 7-day average is 13 minutes, so today ranks #1 for this week. Its 30-day average is 9 minutes, so today ranks #1 for the past month. Its 365-day average is 7 minutes, so today ranks #1 for the past year.
Na’vi River Journey had an average wait time today of 68 minutes. Its 7-day average is 60 minutes, so today ranks #1 for this week. Its 30-day average is 48 minutes, so today ranks #1 for the past month. Its 365-day average is 45 minutes, so today ranks #38 for the past year.
Avatar Flight of Passage had an average wait time today of 153 minutes. Its 7-day average is 122 minutes, so today ranks #1 for this week. Its 30-day average is 93 minutes, so today ranks #1 for the past month. Its 365-day average is 56 minutes, so today ranks #1 for the past year. We received 6 actual wait times today, and the actual wait averaged 77% of the posted wait time.
Magic Kingdom Wait Times
There’s no doubt that the Magic Kingdom is also seeing some of its largest crowds of the past year, but the actual wait times we’ve got today are running at about 60% of the posted wait times, which is a pretty large overstatement of how long you’re going to wait – it should be closer to 80%.
Pirates of the Caribbean had an average wait time today of 55 minutes. Its 7-day average is 39 minutes, so today ranks #1 for this week. Its 30-day average is 28 minutes, so today ranks #1 for the past month. Its 365-day average is 42 minutes, so today ranks #64 for the past year. We received 11 actual wait times today, and the actual wait averaged 43% of the posted wait time.

Astro Orbiter had an average wait time today of 44 minutes. Its 7-day average is 41 minutes, so today ranks #1 for this week. Its 30-day average is 39 minutes, so today ranks #4 for the past month. Its 365-day average is 33 minutes, so today ranks #27 for the past year.
Big Thunder Mountain Railroad had an average wait time today of 44 minutes. Its 7-day average is 40 minutes, so today ranks #2 for this week. Its 30-day average is 33 minutes, so today ranks #2 for the past month. Its 365-day average is 40 minutes, so today ranks #136 for the past year. We received 9 actual wait times today, and the actual wait averaged 74% of the posted wait time.
Buzz Lightyear’s Space Ranger Spin had an average wait time today of 52 minutes. Its 7-day average is 40 minutes, so today ranks #1 for this week. Its 30-day average is 33 minutes, so today ranks #1 for the past month. Its 365-day average is 30 minutes, so today ranks #1 for the past year.
Prince Charming Regal Carrousel had an average wait time today of 24 minutes. Its 7-day average is 16 minutes, so today ranks #1 for this week. Its 30-day average is 13 minutes, so today ranks #1 for the past month. Its 365-day average is 15 minutes, so today ranks #1 for the past year.
Dumbo the Flying Elephant had an average wait time today of 34 minutes. Its 7-day average is 25 minutes, so today ranks #1 for this week. Its 30-day average is 19 minutes, so today ranks #1 for the past month. Its 365-day average is 14 minutes, so today ranks #1 for the past year.
“it’s a small world” had an average wait time today of 49 minutes. Its 7-day average is 39 minutes, so today ranks #1 for this week. Its 30-day average is 28 minutes, so today ranks #1 for the past month. Its 365-day average is 34 minutes, so today ranks #25 for the past year.
Jungle Cruise had an average wait time today of 58 minutes. Its 7-day average is 56 minutes, so today ranks #2 for this week. Its 30-day average is 51 minutes, so today ranks #4 for the past month. Its 365-day average is 42 minutes, so today ranks #13 for the past year.
Mad Tea Party had an average wait time today of 25 minutes. Its 7-day average is 19 minutes, so today ranks #1 for this week. Its 30-day average is 15 minutes, so today ranks #1 for the past month. Its 365-day average is 14 minutes, so today ranks #9 for the past year.
Mickey’s PhilharMagic had an average wait time today of 27 minutes. Its 7-day average is 18 minutes, so today ranks #1 for this week. Its 30-day average is 14 minutes, so today ranks #1 for the past month. Its 365-day average is 21 minutes, so today ranks #125 for the past year.
Peter Pan’s Flight had an average wait time today of 65 minutes. Its 7-day average is 53 minutes, so today ranks #1 for this week. Its 30-day average is 46 minutes, so today ranks #1 for the past month. Its 365-day average is 35 minutes, so today ranks #1 for the past year.
Space Mountain had an average wait time today of 66 minutes. Its 7-day average is 58 minutes, so today ranks #1 for this week. Its 30-day average is 47 minutes, so today ranks #1 for the past month. Its 365-day average is 39 minutes, so today ranks #15 for the past year. We received 6 actual wait times today, and the actual wait averaged 82% of the posted wait time.
Splash Mountain had an average wait time today of 67 minutes. Its 7-day average is 70 minutes, so today ranks #4 for this week. Its 30-day average is 58 minutes, so today ranks #5 for the past month. Its 365-day average is 55 minutes, so today ranks #95 for the past year. We received 4 actual wait times today, and the actual wait averaged 68% of the posted wait time.
The Barnstormer had an average wait time today of 28 minutes. Its 7-day average is 23 minutes, so today ranks #2 for this week. Its 30-day average is 17 minutes, so today ranks #2 for the past month. Its 365-day average is 17 minutes, so today ranks #55 for the past year.
The Haunted Mansion had an average wait time today of 56 minutes. Its 7-day average is 47 minutes, so today ranks #1 for this week. Its 30-day average is 40 minutes, so today ranks #1 for the past month. Its 365-day average is 28 minutes, so today ranks #3 for the past year. We received 6 actual wait times today, and the actual wait averaged 58% of the posted wait time.
The Magic Carpets of Aladdin had an average wait time today of 27 minutes. Its 7-day average is 18 minutes, so today ranks #1 for this week. Its 30-day average is 15 minutes, so today ranks #1 for the past month. Its 365-day average is 14 minutes, so today ranks #1 for the past year.
The Many Adventures of Winnie the Pooh had an average wait time today of 42 minutes. Its 7-day average is 38 minutes, so today ranks #1 for this week. Its 30-day average is 33 minutes, so today ranks #1 for the past month. Its 365-day average is 25 minutes, so today ranks #2 for the past year.
Tomorrowland Speedway had an average wait time today of 32 minutes. Its 7-day average is 25 minutes, so today ranks #1 for this week. Its 30-day average is 17 minutes, so today ranks #1 for the past month. Its 365-day average is 16 minutes, so today ranks #12 for the past year.
Tomorrowland Transit Authority PeopleMover had an average wait time today of 25 minutes. Its 7-day average is 22 minutes, so today ranks #2 for this week. Its 30-day average is 18 minutes, so today ranks #3 for the past month. Its 365-day average is 17 minutes, so today ranks #22 for the past year.
Seven Dwarfs Mine Train had an average wait time today of 74 minutes. Its 7-day average is 72 minutes, so today ranks #2 for this week. Its 30-day average is 65 minutes, so today ranks #2 for the past month. Its 365-day average is 57 minutes, so today ranks #39 for the past year.
Under the Sea ~ Journey of the Little Mermaid had an average wait time today of 38 minutes. Its 7-day average is 34 minutes, so today ranks #1 for this week. Its 30-day average is 25 minutes, so today ranks #1 for the past month. Its 365-day average is 21 minutes, so today ranks #2 for the past year.
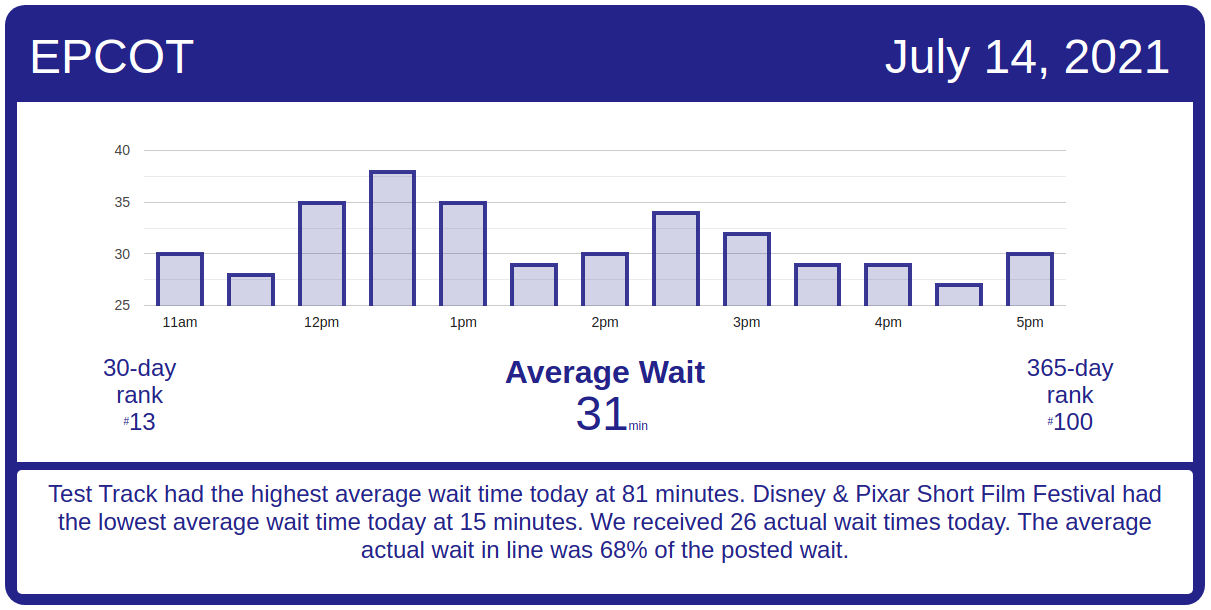
EPCOT Wait Times
I was running around EPCOT this afternoon, seeing if France was restaging the storming of the Bastille had any new ice cream flavors, and there were so few people in World Showcase that I probably could’ve counted them.
Soarin’ had an average wait time today of 38 minutes. Its 7-day average is 32 minutes, so today ranks #1 for this week. Its 30-day average is 38 minutes, so today ranks #13 for the past month. Its 365-day average is 39 minutes, so today ranks #193 for the past year. We received 5 actual wait times today, and the actual wait averaged 79% of the posted wait time.
Gran Fiesta Tour Starring The Three Caballeros had an average wait time today of 24 minutes. Its 7-day average is 21 minutes, so today ranks #1 for this week. Its 30-day average is 22 minutes, so today ranks #9 for the past month. Its 365-day average is 10 minutes, so today ranks #9 for the past year.
Journey Into Imagination With Figment had an average wait time today of 16 minutes. Its 7-day average is 14 minutes, so today ranks #2 for this week. Its 30-day average is 14 minutes, so today ranks #13 for the past month. Its 365-day average is 14 minutes, so today ranks #149 for the past year. We received 4 actual wait times today, and the actual wait averaged 36% of the posted wait time.
Living with the Land had an average wait time today of 20 minutes. Its 7-day average is 14 minutes, so today ranks #1 for this week. Its 30-day average is 13 minutes, so today ranks #1 for the past month. Its 365-day average is 11 minutes, so today ranks #6 for the past year. We received 4 actual wait times today, and the actual wait averaged 21% of the posted wait time.
Mission: SPACE Orange had an average wait time today of 33 minutes. Its 7-day average is 28 minutes, so today ranks #1 for this week. Its 30-day average is 30 minutes, so today ranks #10 for the past month. Its 365-day average is 32 minutes, so today ranks #168 for the past year.
Spaceship Earth had an average wait time today of 30 minutes. Its 7-day average is 25 minutes, so today ranks #1 for this week. Its 30-day average is 23 minutes, so today ranks #1 for the past month. Its 365-day average is 20 minutes, so today ranks #61 for the past year. We received 5 actual wait times today, and the actual wait averaged 81% of the posted wait time.
Test Track had an average wait time today of 81 minutes. Its 7-day average is 69 minutes, so today ranks #1 for this week. Its 30-day average is 75 minutes, so today ranks #3 for the past month. Its 365-day average is 57 minutes, so today ranks #25 for the past year.
The Seas with Nemo & Friends had an average wait time today of 18 minutes. Its 7-day average is 15 minutes, so today ranks #1 for this week. Its 30-day average is 17 minutes, so today ranks #11 for the past month. Its 365-day average is 13 minutes, so today ranks #64 for the past year.
Frozen Ever After had an average wait time today of 49 minutes. Its 7-day average is 44 minutes, so today ranks #1 for this week. Its 30-day average is 48 minutes, so today ranks #8 for the past month. Its 365-day average is 46 minutes, so today ranks #126 for the past year. We received 4 actual wait times today, and the actual wait averaged 84% of the posted wait time.
Hollywood Studios Wait Times
Rock ‘n’ Roller Coaster Starring Aerosmith had an average wait time today of 78 minutes. Its 7-day average is 65 minutes, so today ranks #1 for this week. Its 30-day average is 57 minutes, so today ranks #1 for the past month. Its 365-day average is 42 minutes, so today ranks #1 for the past year. We received 7 actual wait times today, and the actual wait averaged 71% of the posted wait time.

Muppet*Vision 3D had an average wait time today of 15 minutes. Its 7-day average is 12 minutes, so today ranks #1 for this week. Its 30-day average is 12 minutes, so today ranks #4 for the past month. Its 365-day average is 21 minutes, so today ranks #204 for the past year.
Star Tours: The Adventures Continue had an average wait time today of 30 minutes. Its 7-day average is 25 minutes, so today ranks #2 for this week. Its 30-day average is 19 minutes, so today ranks #2 for the past month. Its 365-day average is 27 minutes, so today ranks #149 for the past year. We received 10 actual wait times today, and the actual wait averaged 53% of the posted wait time.
The Twilight Zone Tower of Terror had an average wait time today of 67 minutes. Its 7-day average is 53 minutes, so today ranks #1 for this week. Its 30-day average is 43 minutes, so today ranks #1 for the past month. Its 365-day average is 50 minutes, so today ranks #53 for the past year. We received 4 actual wait times today, and the actual wait averaged 71% of the posted wait time.
Toy Story Mania! had an average wait time today of 52 minutes. Its 7-day average is 58 minutes, so today ranks #3 for this week. Its 30-day average is 47 minutes, so today ranks #4 for the past month. Its 365-day average is 29 minutes, so today ranks #4 for the past year. We received 14 actual wait times today, and the actual wait averaged 64% of the posted wait time.
Walt Disney Presents had an average wait time today of 20 minutes. Its 7-day average is 5 minutes, so today ranks #1 for this week. Its 30-day average is 5 minutes, so today ranks #1 for the past month. Its 365-day average is 5 minutes, so today ranks #1 for the past year.
Slinky Dog Dash had an average wait time today of 96 minutes. Its 7-day average is 93 minutes, so today ranks #1 for this week. Its 30-day average is 85 minutes, so today ranks #1 for the past month. Its 365-day average is 63 minutes, so today ranks #1 for the past year.
Alien Swirling Saucers had an average wait time today of 50 minutes. Its 7-day average is 39 minutes, so today ranks #1 for this week. Its 30-day average is 34 minutes, so today ranks #1 for the past month. Its 365-day average is 25 minutes, so today ranks #1 for the past year.
Mickey & Minnie’s Runaway Railway had an average wait time today of 74 minutes. Its 7-day average is 62 minutes, so today ranks #1 for this week. Its 30-day average is 54 minutes, so today ranks #1 for the past month. Its 365-day average is 53 minutes, so today ranks #59 for the past year. We received 4 actual wait times today, and the actual wait averaged 105% of the posted wait time.
Millennium Falcon: Smugglers Run had an average wait time today of 88 minutes. Its 7-day average is 69 minutes, so today ranks #1 for this week. Its 30-day average is 60 minutes, so today ranks #1 for the past month. Its 365-day average is 52 minutes, so today ranks #1 for the past year.
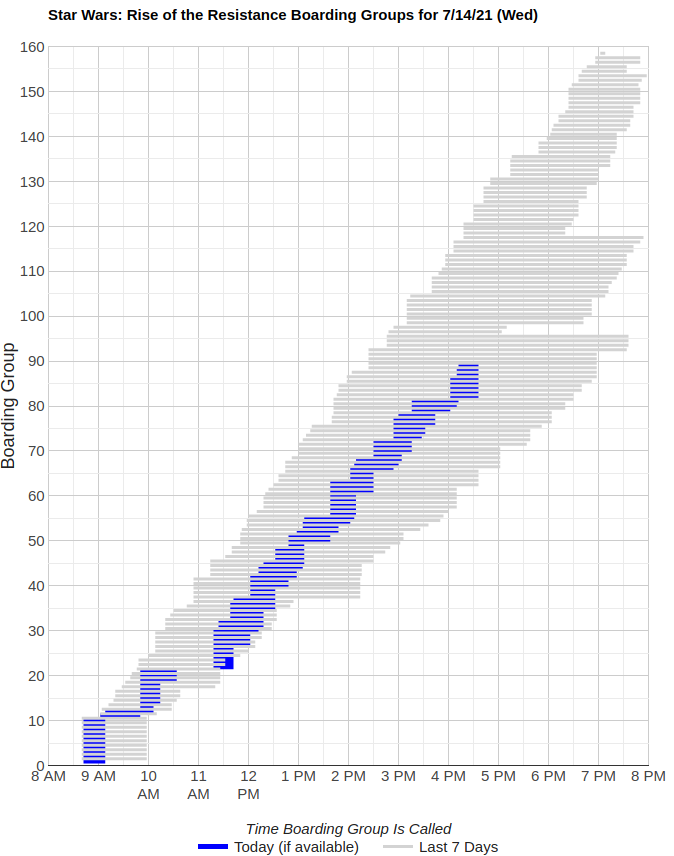
Rise of the Resistance is having a so-so day of operations today. Rise began calling boarding groups around 8:45 a.m., and seems like it’s had a couple of delays throughout the day. It looks like Rise of the Resistance might be able to get to boarding group 140 or so by evening.

You May Also Like...
-

Today's average posted wait times at the Animal Kingdom were the highest they've been in the past 30 days, while posted…
-

We're kicking off the week by seeing higher average posted wait times today at Hollywood Studios and EPCOT. The Studios' average…
-

Disney's Animal Kingdom's attractions had an average posted wait time today of 54 minutes, the highest of the past month, and…
-

The Magic Kingdom's average posted wait today was just 16 minutes - that's all day, across all attractions - and even…
Rise needs longer operational hours. It just does. Even if it’s the only thing open 8 to 10pm. And the app warns no food stalls will be open. Just a water and soda cart.