
Disney Data Dump November 2 2022
Happy November! This change of month means that it is officially holiday season at Walt Disney World. Decorations are up, the Mr. Toad dome cake has returned, holiday parties are starting back up, and food and merchandise have already shifted from Halloween to Christmas, Hanukah and more. Let’s look at how the Halloween season wrapped up, and what we can expect from this transition week if you’re planning on visiting WDW.

Observed Crowd Levels 10/25 – 10/31

This is a much milder week than we’ve seen from all of October. We’re right in the heart of non-school-break season, and it shows. Last week we had one crowd-level 5 day, and that was the least crowded day of the week. This week we got three level-5 days and four level-4 days. This is great for October at WDW. And we’re hoping that it will continue until Jersey week hits us in early-ish November.

A whole bunch of parties happened at the Magic Kingdom this week. Thankfully, lower crowds overall across the resort meant that those non-party days didn’t get quite as miserable as I expected them to be. Still, the difference between a crowd level 2 (like on the 28th) and a crowd level 6 (like on the 29th) is very significant throughout the course of a day. More than enough to “make up for” the longer operating hours. Plus, a crowd level 2 at any park during October is amazing. I’m jealous of you if you were in Magic Kingdom on October 28th.

Each week, I’m giving you a very transparent look into how our crowd level predictions performed. Each day at each park is one data point, so we have 28 different crowd level predictions to evaluate each week. Any time a prediction is within one or two crowd levels, things won’t really “feel” much different than what we predicted. Being off by 3 or more crowd levels is where we’d like to be more accurate because you might feel that difference in wait times throughout the day.
In the past week, our predictions were either spot-on or within 1 crowd level 68% of the time. If you remember this same chart from last week, it looked very different. There were no overpredictions – just underpredictions. This week got much closer to what we would consider “normal” results. 86% of the time we were within 2 crowd levels, and that means this week we earn an B for our predictions this week. Better than last week. On 4 different park days, we missed crowds by 3 or more crowd levels. The worse miss was an underprediction of 4 crowd levels at Magic Kingdom on October 26th. For some unknown reason the crowd calendar was predicting a 2, even though this was a non-party day in late October. I … don’t know why that happened, since the actual crowds were a 6. Much more in line with what this month has taught us to expect!
Attraction Downtime 10/25 – 10/31
If we average out all of the capacity lost due to unexpected downtime over the past week, it comes out to 3.6% of attractions unexpectedly being down. This is essentially the same as last week, and is a little higher than what we saw in mid September (3.1%). The park with the biggest issues was Magic Kingdom (4.7% of capacity lost), and that breaks a two-week streak of Hollywood Studios being the most unreliable park.
The single worst day for attraction downtime in the past week was October 30th. On that day, 8% of all capacity at WDW was lost due to unexpected downtime. Boo and ouch. The single worst park-day of the week was also on the 30th. On that day, 14% of the the capacity at Magic Kingdom was lost due to unexpected downtime. That’s certainly not a great number. Magic Kingdom had a 10-hour operating day on the 30th since it was a party day, so it’s equivalent to the entire park opening almost an hour and a half late, or closing almost an hour and a half early. Thankfully, it didn’t have much of an impact on wait times overall. The crowd level was still just a 3.
Attraction Downtime
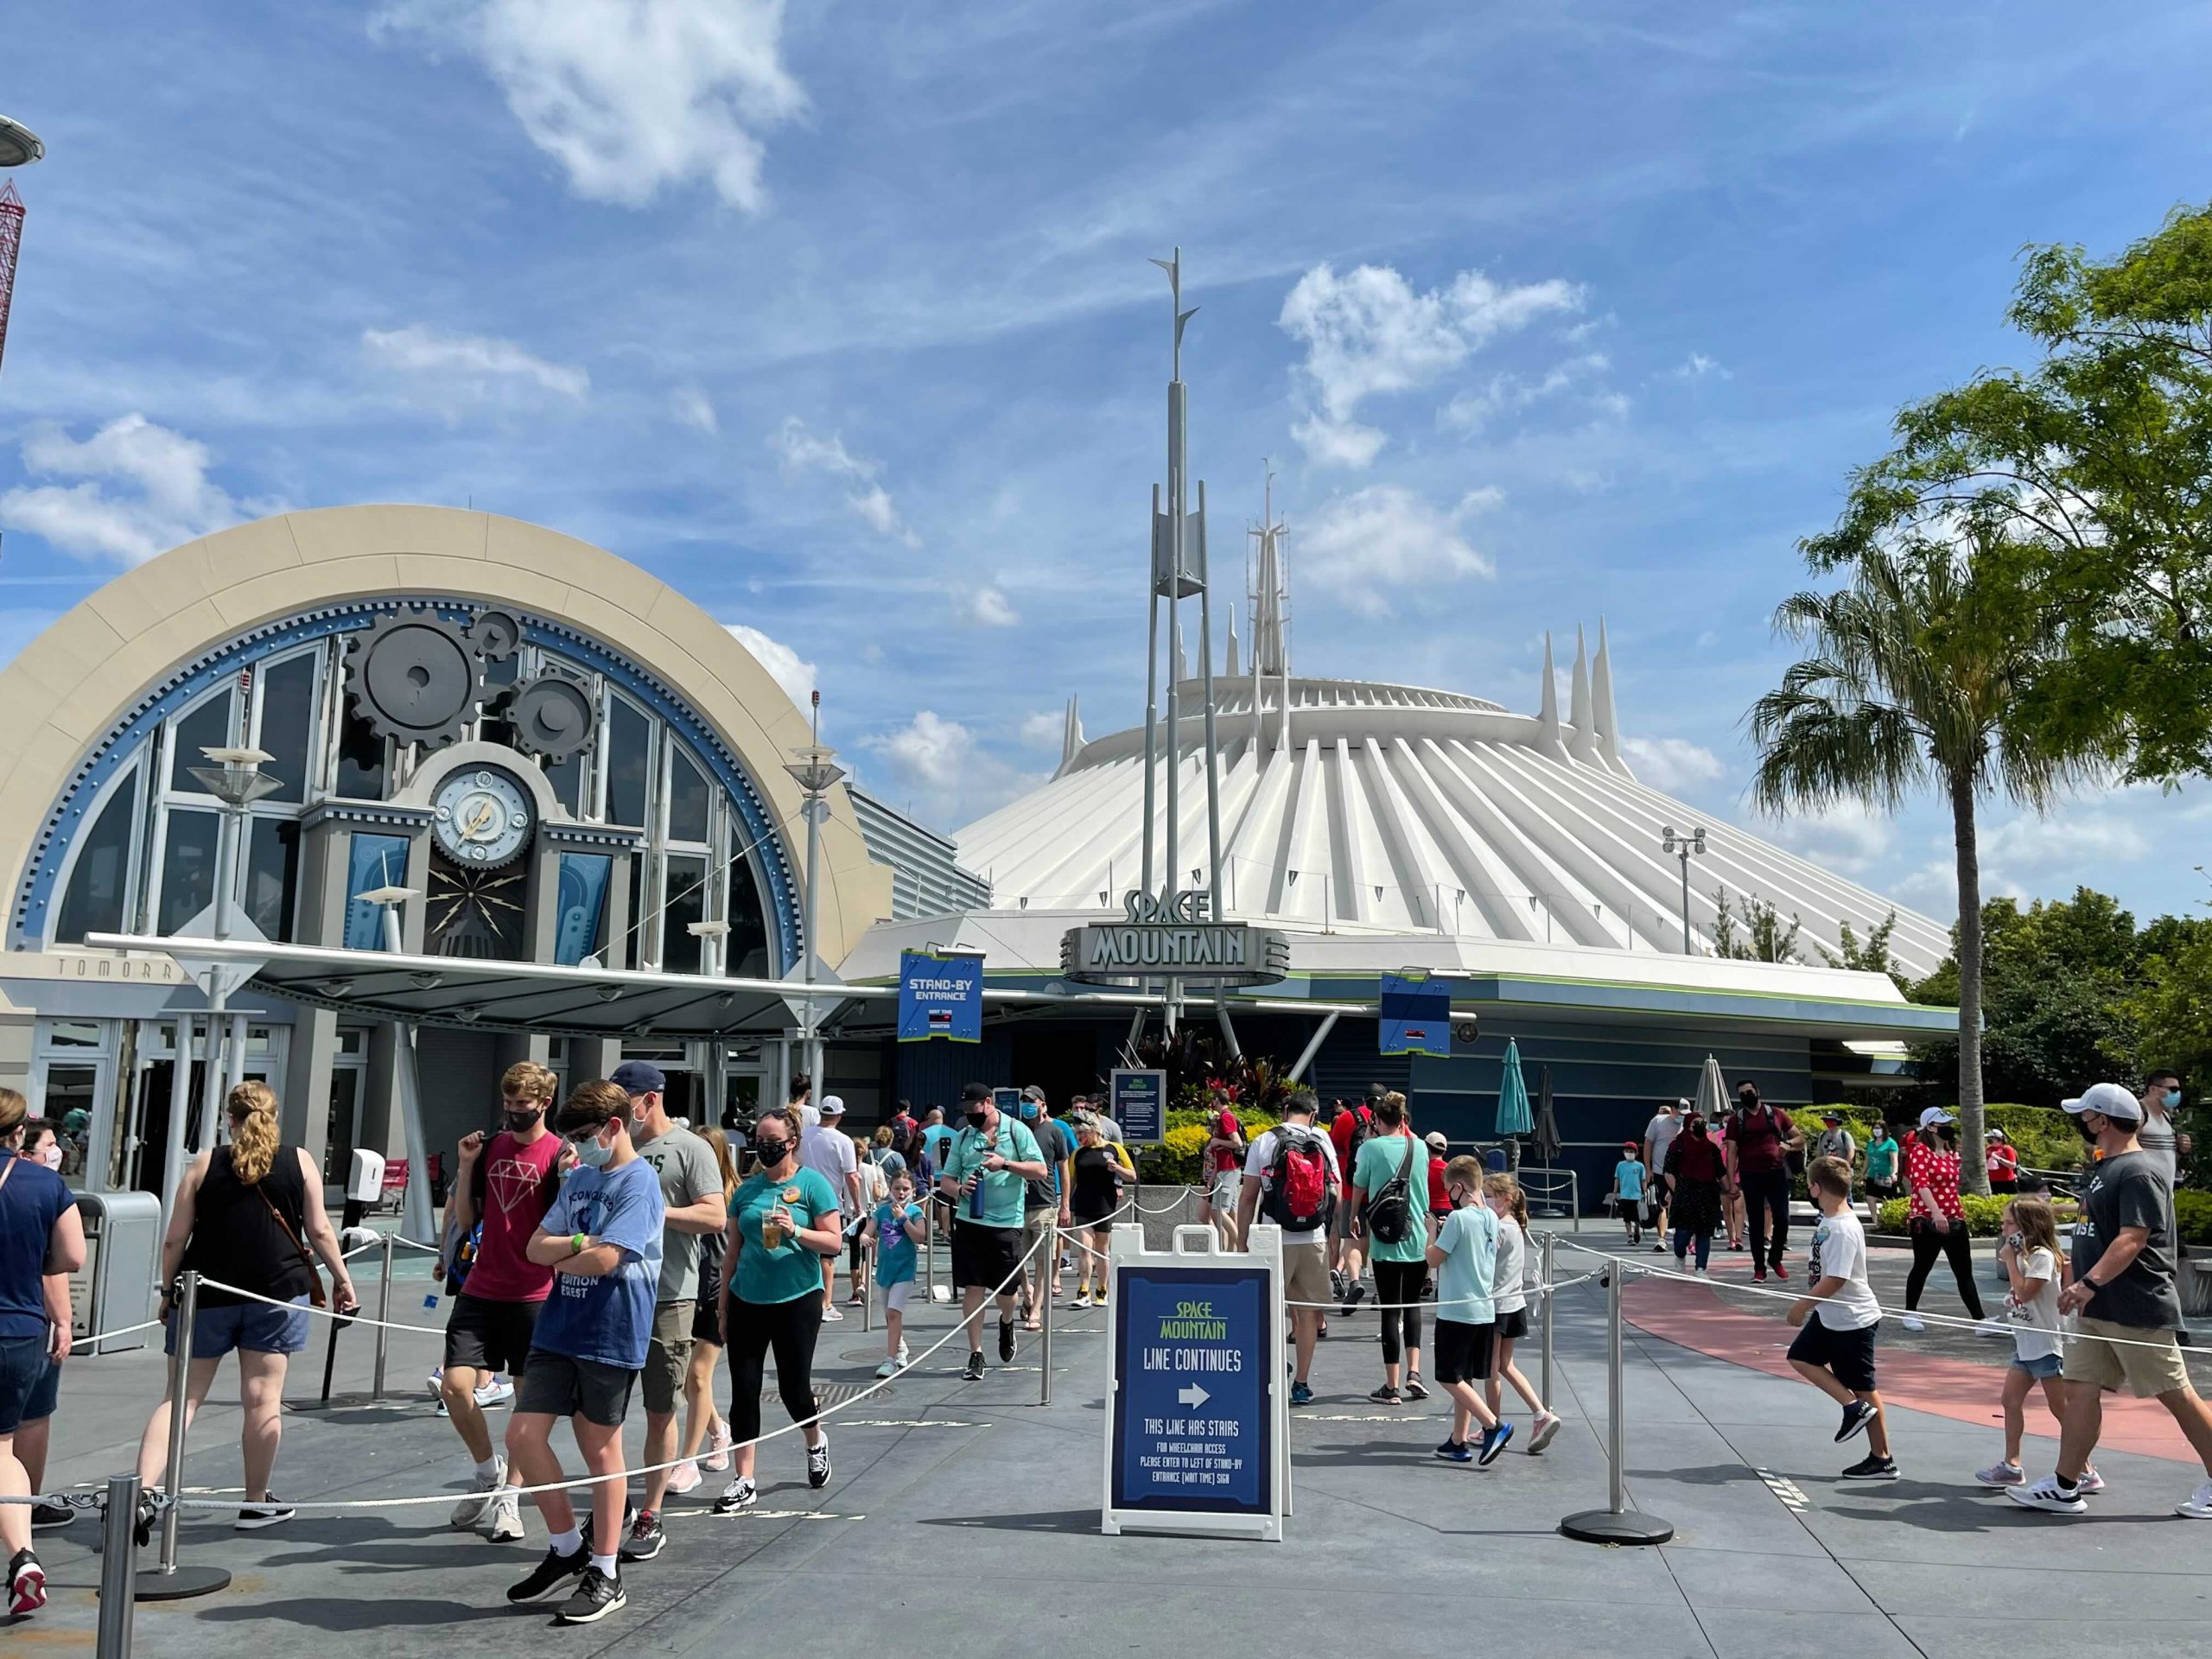
The worst offender was Space Mountain, which was unexpectedly down for over 28% of the week, including being down 99% of the day on October 30th, and 80% of the day on October 31st. Being down for a quarter of the day on 3 days of the week makes this a reliably unreliable attraction. Coming in 2nd and 3rd place for unreliability this week were Rise of the Resistance, which was offline for 16% of the week, and Frozen Ever After, which was offline for 11% of the week. Rise was down over half of the day on October 30th – a big deal for such an anchor attraction.
Rope Drop Downtime
Here are this week’s problematic offenders:
- Magic Kingdom: Pirates of the Caribbean (unavailable for 49% of its first hour of the day), Space Mountain (unavailable for 41% of its first hour of the day), and Splash Mountain (unavailable for 39% of its first hour of the day)
- EPCOT: Frozen Ever After (unavailable for 23% of its first hour of the day), and Journey Into Imagination (unavailable for 19% of its first hour of the day)
- Hollywood Studios: Rise of the Resistance (unavailable for 23% of its first hour of the day), and Alien Swirling Saucers (unavailable for 14% of its first hour of the day)
- Animal Kingdom: Adventurers Outpost (unavailable for 10% of its first hour of the day)
Rise and Frozen being down during the first hour of the day means that you absolutely need backup plans for those parks, because they’re both generally great rope-drop options. Magic Kingdom, thankfully, has plenty of other rope drop options (looking at you, Fantasyland). And I guess Mickey and Minnie like sleeping in occasionally, so don’t plan on dropping by on them at Animal Kingdom first thing in the morning.

Wait Times 10/25 – 10/31
Attractions with the Highest Average Wait at each park
- Hollywood Studios: Rise of the Resistance, average posted wait time of 85 minutes (91 last week)
- Animal Kingdom: Flight of Passage, average posted wait time of 90 minutes (96 last week)
- EPCOT: Frozen Ever After, average posted wait time of 65 minutes (82 last week at Remy’s Ratatouille Adventure)
- Magic Kingdom: Seven Dwarfs Mine Train, average posted wait time of 55 minutes (66 last week)
These average posted wait times are so much better than what we were seeing in early and mid-October. Just two weeks ago, many of these wait times were in or near triple-digits. And now Magic Kingdom’s highest average posted wait time was less than an hour! We see the biggest drop, though, at EPCOT. Crowds there are getting much more reasonable. Hooray!
Parks with the Highest and Lowest Average Wait
These parks likely won’t change week-to-week unless something ridiculous happens, but these data points will give us a high-level view of how wait times are trending from week to week.
- Highest: Hollywood Studios, average park-wide posted wait of 40 minutes (last week 45 minutes)
- Lowest: Magic Kingdom, average park-wide posted wait of 21 minutes (last week 24.5 minutes)
Thanks to those lower-crowd party days, Magic Kingdom continues to have the lowest average wait times. EPCOT came close this week, though, at an average of 24.5 minutes. Pretty reasonable for a park with many fewer attractions to absorb all of the crowds.
Most Inflated Posted Wait Times
We all know that Disney inflates their posted wait times on purpose. They have many reasons for doing this. Some are totally understandable, and some are potentially more problematic. We can figure out how much posted wait times are being inflated by comparing submitted actual wait times from the Lines App and the posted wait time when the person timing their wait entered the line.
From October 25th through 31st, actual wait times in the Lines App averaged 63% of what was posted. So if the posted wait time was 20 minutes, you could’ve expected to wait just under 13 minutes instead.
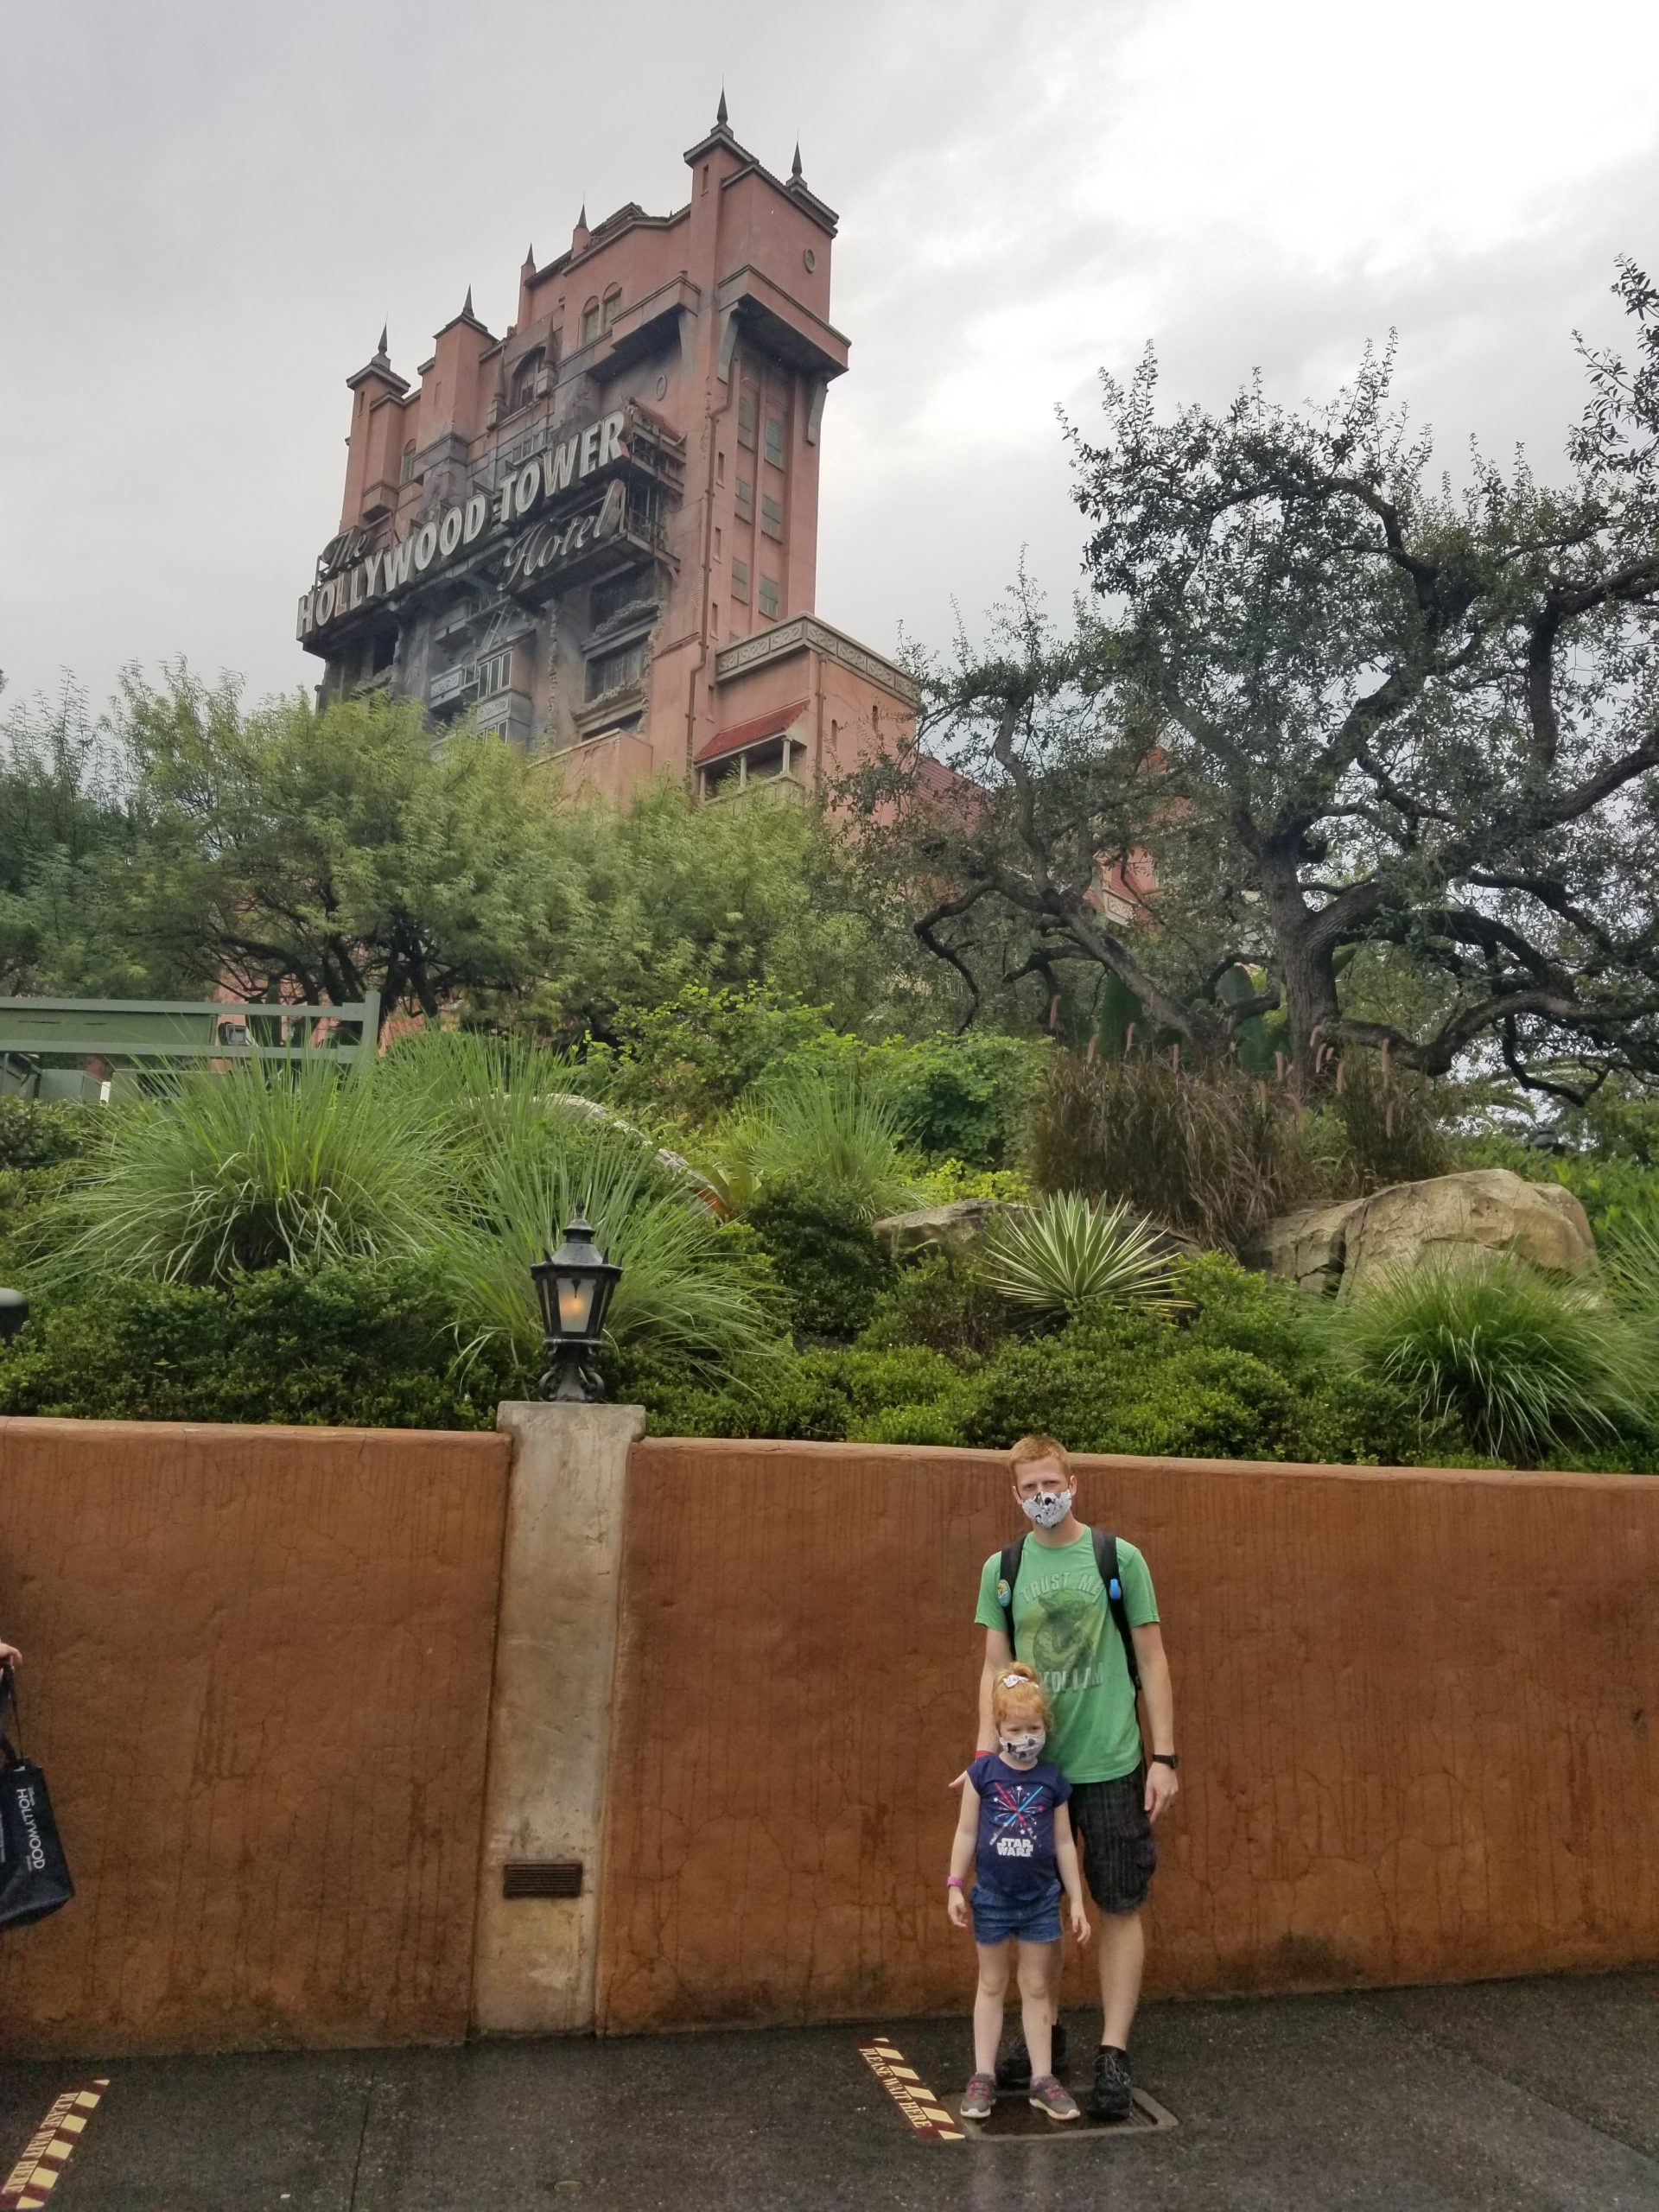
But the worst offender for the week was Tower of Terror. At this one attraction, submitted actual wait times were 45% of posted wait times. That means if Tower of Terror had a 30 minute posted wait, you probably would’ve waited just over 13 minutes. Under half of what was posted. Remember to always check the Lines app for predicted actual waits instead of believing what is posted.
Looking Ahead: November 1st through 14th
Since it takes time to pull data and write a post, you’ll be reading this on the 2ndth when the 1st is already in the past. But we’re staying as close to real-time as possible.
Our predictions have corrected themselves to be more realistic instead of regularly underpredicting. This is good news as we head into November. My family will be on a lovely Disney Cruise next week, so that means no Disney Data Dump on November 9th. I apologize! I’ll virtually wave at you all from Cabo instead. That means I need to help you look ahead over the next two weeks.
The 1st through the 5th or 6th should continue to see the moderate crowds from this past week. Then, Jersey week hits. Veterans Day and the time off that it offers to families leads to much more travel. Expect crowds to pick back up a bit at least from the 7th through the 12th or 13th. November and December are generally feast-or-famine when it comes to crowds, so we should be seeing some bigger swings in crowds surrounding holidays.
You May Also Like...
-

How did park closures and airport shakeups impact crowds in the parks in the past week? And what can we expect…
-

We've thankfully had a much calmer week at Walt Disney World compared to the past few. Yes, Genie+ prices are still…
-

What a week at Walt Disney World! We had some absolutely insane wait times (I see you, 420 minutes at Rise…
-

New blog series, who dis? We know that you come to TouringPlans because of all of our data. And other than…
Please do these data dumps forever!!! I love seeing all of this and it really helps me plan future trips. We did last week of Oct in 2019 and it was a fantastic week to go!