
Disney Data Dump October 26 2022
We’ve thankfully had a much calmer week at Walt Disney World compared to the past few. Yes, Genie+ prices are still unpredictable. And yes, some rides experienced significant downtime. But crowd levels and wait times have calmed down slightly. Crowds are still above average, but not overheating. Let’s see what that looks like in the data, and what it means for your vacation if you’re heading to WDW for the end of October.

Observed Crowd Levels 10/18 – 10/24
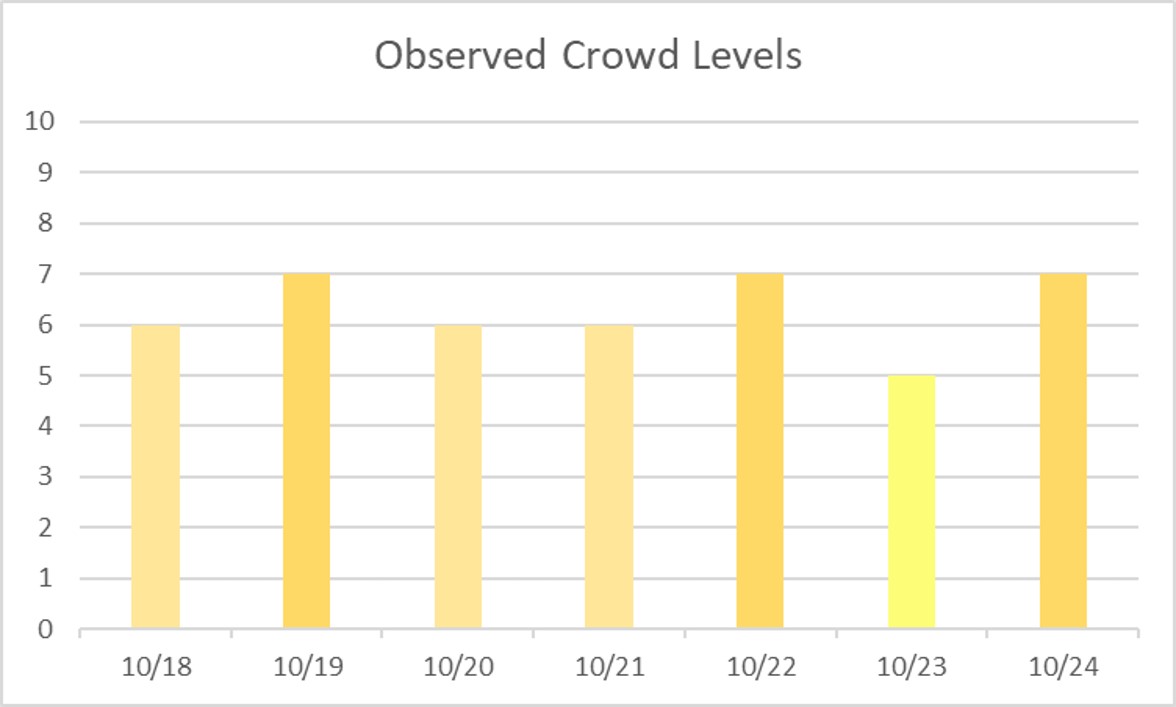
With fall breaks finally wrapping up, we see a slight easing in overall crowds compared to the past two weeks. This is the first resort-wide crowd level 5 we’ve seen in that time, and it’s also the first time in three weeks that we don’t have a resort-wide crowd level 8. It’s still not low-crowd season, and those numbers will eventually bounce back up. But it’s slightly more pleasant than it has been for the rest of October.

The crowd levels at Magic Kingdom look even nicer … on party days! Party days aren’t the crowd level 1 days we saw in September, but they are reliably 3 or 4 crowd levels lower than non-party days. And that amount of a difference will more than make up for the shorter operating hours. Not-So-Scary parties will be wrapping up in the coming week, at long last. But Very Merry parties start soon after that, so this portion of the DDD will continue through the end of the year.

Each week, I’m giving you a very transparent look into how our crowd level predictions performed. Each day at each park is one data point, so we have 28 different crowd level predictions to evaluate each week. Any time a prediction is within one or two crowd levels, things won’t really “feel” much different than what we predicted. Being off by 3 or more crowd levels is where we’d like to be more accurate because you might feel that difference in wait times throughout the day.
In the past week, our predictions were either spot-on or within 1 crowd level 64% of the time. If you remember this same chart from last week, this is similar except that any days that were over-predicted last week converted to being within 1 crowd level this week. We’ve gotten a bit skewed toward under-predicting. 82% of the time we were within 2 crowd levels, and that means this week we earn an B- for our predictions this week. Better than last week. On 5 different park days, we underestimated crowds by 3 crowd levels. All of those happened at EPCOT or Animal Kingdom, and on October 19th, 20th or 24th. I specifically called out last week that you should be prepared for EPCOT and Animal Kingdom to keep surprising us on the high side. We’ll probably see that continue.
Attraction Downtime 10/18 – 10/24
If we average out all of the capacity lost due to unexpected downtime over the past week, it comes out to 3.4% of attractions unexpectedly being down. This is roughly equivalent to last week, and is similar to what we saw in mid September (3.1%). The park with the biggest issues was Hollywood Studios (4.3% of capacity lost), and that makes it the most unreliable park for the second week in a row.

The single worst day for attraction downtime in the past week was October 18th. On that day, 6% of all capacity at WDW was lost due to unexpected downtime. This actually isn’t terrible compared to the previous week, when 9% of capacity was lost on October 17th. And actually the high number on the 18th is likely due to some residual problems from the storms that rolled through on the 17th. The single worst park-day of the week wasn’t on the 18th, though. It was at Hollywood Studios on the 19th instead. On that day, 10% of the park’s capacity was lost due to unexpected downtime. That’s certainly not a great number. Hollywood Studios had a 12.5-hour operating day on the 19th, so it’s equivalent to the entire park opening 75 minutes late, or closing 75 minutes early. Thankfully, it didn’t have much of an impact on wait times overall. We predicted a crowd level 6, and saw a 7.
Attraction Downtime
The worst offender was Test Track, which was unexpectedly down for over 14% of the week, including being down 26% of the day on October 18th, 24% of the day on October 22nd, and 25% of the day on October 23rd. Being down for a quarter of the day on 3 days of the week makes this a reliably unreliable attraction. Not far behind were Slinky Dog Dash and Rise of the Resistance, which were both offline for over 11.5% of the week. Slinky didn’t have a terrible week other than being down 73% of the day on October 19th. That’s a big ouch for the park on that day. Rise, on the other hand, just had a week over several mildly bad days, including being offline 28% of the time on October 23rd.
Rope Drop Downtime
Here are this week’s problematic offenders:
- Magic Kingdom: Splash Mountain (unavailable for 50% of its first hour of the day), and Pirates of the Caribbean (unavailable for 47.5% of its first hour of the day)
- EPCOT: Frozen Ever After (unavailable for 24% of its first hour of the day), and Test Track (unavailable for 20% of its first hour of the day)
- Hollywood Studios: Runaway Railway (unavailable for 25% of its first hour of the day), and Rock’n’Roller Coaster (unavailable for 21% of its first hour of the day)
- Animal Kingdom: DINOSAUR (unavailable for 21% of its first hour of the day)
Similar to last week, a lot of these first-hour down-times aren’t a huge deal. You can rope-drop Fantasyland or Tomorrowland at Magic Kingdom instead of Splash and Pirates. You should head to Rise and Slinky at Hollywood Studios, and to Flight of Passage or Kilimanjaro Safaris at Animal Kingdom. The problem-park here is EPCOT. Frozen Ever After and Test Track are excellent rope-drop choices. But if they’re down, it’s hard to walk to another attraction before the crowds arrive. At 24% and 20%, though, you do need to have a backup plan.
Wait Times 10/18 – 10/24
Attractions with the Highest Average Wait at each park
- Hollywood Studios: Rise of the Resistance, average posted wait time of 91 minutes (96 for last week at Slinky Dog Dash)
- Animal Kingdom: Flight of Passage, average posted wait time of 96 minutes (111 last week)
- EPCOT: Remy’s Ratatouille Adventure, average posted wait time of 82 minutes (87 last week)
- Magic Kingdom: Seven Dwarfs Mine Train, average posted wait time of 66 minutes (68 last week)
We have seen very large increases in these average wait times over the past two weeks … and now finally things are easing off again. This makes sense, based on the crowd levels we were seeing this week too. These aren’t crazy-low wait times, but they’re better than last week and the week before. We’re heading more toward average crowds – for now.

Parks with the Highest and Lowest Average Wait
These parks likely won’t change week-to-week unless something ridiculous happens, but these data points will give us a high-level view of how wait times are trending from week to week.
- Highest: Hollywood Studios, average park-wide posted wait of 45 minutes (last week 47.5 minutes)
- Lowest: Magic Kingdom, average park-wide posted wait of 24.5 minutes (last week 26.5 minutes)
Thanks to those lower-crowd party days, Magic Kingdom continues to have the lowest average wait times. And an increase in attraction reliability helped keep wait times even lower than last week. Hollywood Studios is still up at that 45 minutes per attraction mark – lots of waiting!
Most Inflated Posted Wait Times
We all know that Disney inflates their posted wait times on purpose. They have many reasons for doing this. Some are totally understandable, and some are potentially more problematic. We can figure out how much posted wait times are being inflated by comparing submitted actual wait times from the Lines App and the posted wait time when the person timing their wait entered the line.
From October 18th through 24th, actual wait times in the Lines App averaged 64% of what was posted. So if the posted wait time was 20 minutes, you could’ve expected to wait just under 13 minutes instead.
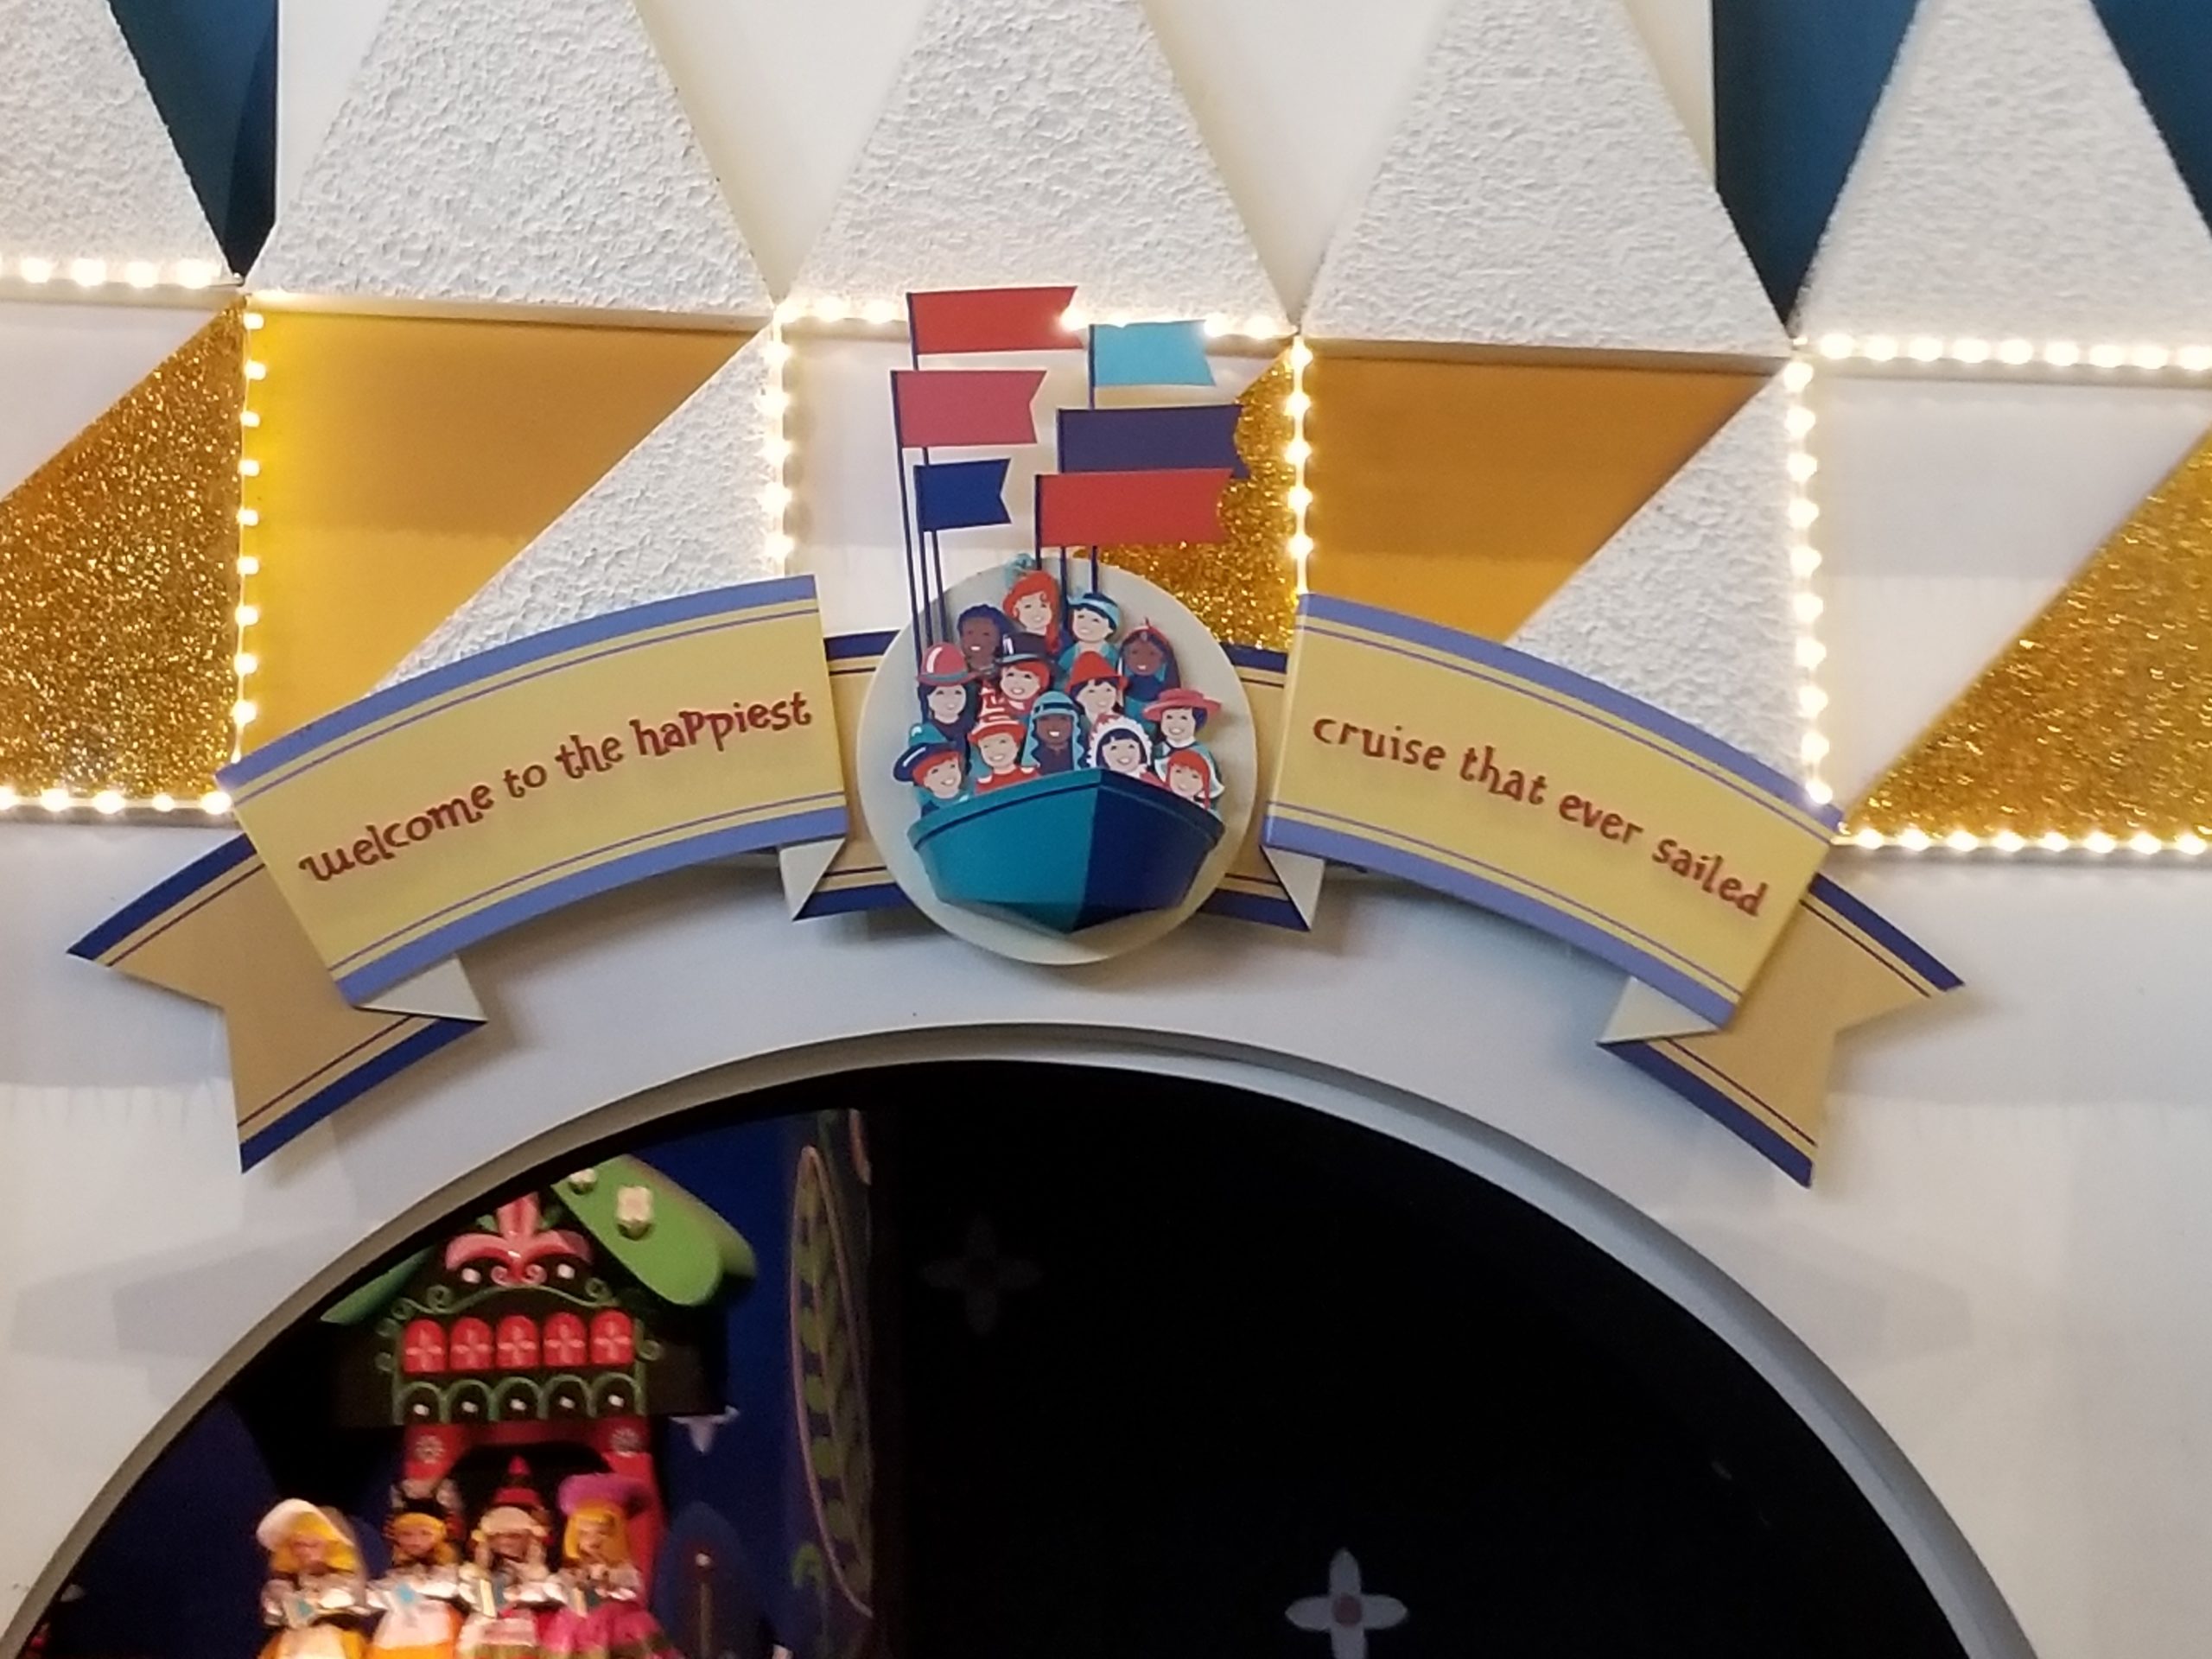
But the worst offender for the week was it’s a small world. At this one attraction, submitted actual wait times were 41% of posted wait times. That means if it’s a small world had a 30 minute posted wait, you probably would’ve waited just over 12 minutes. Under half of what was posted. Remember to always check the Lines app for predicted actual waits instead of believing what is posted.
Looking Ahead: October 25th through October 31st
Since it takes time to pull data and write a post, you’ll be reading this on the 26th when the 25th is already in the past. But we’re staying as close to real-time as possible.
Last week I predicted higher-than expected crowds at EPCOT and Animal Kingdom. And, hey, all of our big under-predicted days were at … EPCOT and Animal Kingdom. And I predicted that party days at the Magic Kingdom would still be a 7 or and 8. And they were!
As we look through the end of October, we’re predicting some lower crowds. We’ve got Jersey week and Veterans Day weekend coming up, so lots of travelers should be waiting until early November for their WDW trips. But we’ve already been underpredicting this past week, so don’t be surprised by crowd levels 1 or 2 levels above predictions. Especially at EPCOT and Animal Kingdom. The 29th at Magic Kingdom will likely be very crowded. It’s got 2 party nights before, and 2 party nights after, so lots and lots of visitors will choose the 29th to visit Magic Kingdom.
You May Also Like...
-

How did park closures and airport shakeups impact crowds in the parks in the past week? And what can we expect…
-

Holy crowds, Batman! Spiderman? Fall is here, and so are the beginnings of October crowds, ramping up into the holiday seasons…
-

What a week at Walt Disney World! We had some absolutely insane wait times (I see you, 420 minutes at Rise…
-

New blog series, who dis? We know that you come to TouringPlans because of all of our data. And other than…
Our trip is next week – Sunday Oct 30 to Friday Nov 4.
Every park all 6 days is predicted to be 4/5/6 EXCEPT:
Epcot on Tues Nov 1 is a 7,
MK on Wed Nov 2 is a 2.
I can’t think of anything that would swing either out of the ‘average’ zone. As luck has it, these happened to be our reserved parks though we plan hopping to AK after EP. MK we plan Early Entry and Extended Evening Hours and a CL 2 would be incredible 🙂
My priority with helping TP data is Character Meets wait times using G+/LLs, and we’ll try to contribute more. Thanks for all you do Becky and crew!
Ooh, major bonus points for paying attention to which data points we need more of! Have a great trip 🙂