
Disney Data Dump December 31 2025
Last blog of the year
Crowds have finally arrived
Deep breaths, everyone
And with that haiku, we’re celebrating the final Disney Data Dump of the year. If you’ve been following along week to week, you know we’ve been slowly marching toward this moment for months. It’s the part of the year when everything changes, patience gets tested, and the numbers stop being subtle. This past week officially pushed us into rare territory, the kind of week that resets your internal definition of “crowded” and makes the rest of the year feel like a warm-up act. There’s a lot to unpack here: dramatic swings between parks, wait times doing things they almost never do, and a few surprises hiding inside what should be the most predictable week of the year. Let’s close out the year by taking a look at what actually happened in the parks, and what it tells us as we head into the final days of peak season.
Observed Crowd Levels December 23 – 29
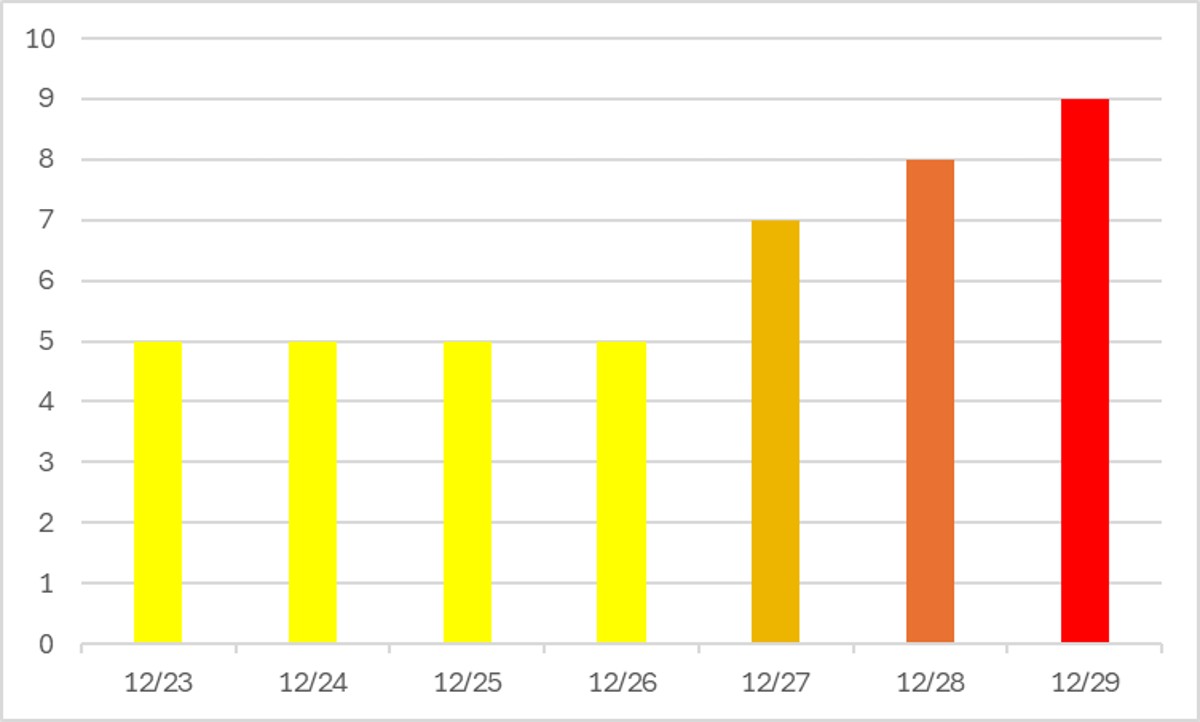
I haven’t had to use these colors all year!! Now, that’s only because I didn’t write data dumps in January, when there were a few crowd level 9 days. But still, this is rare territory. It’s the time of year when I like to stay cozy and warm inside my house, pull up the MDE app to look at current wait times, and for once be glad that I’m in St Louis instead of Orlando. It looks miserable down there. It’s also the time of year when I get to reach back out to all of the people throughout the year who messaged me saying “I know it says crowd level 2, but it FEELS SO CROWDED!” And say, look, this is crowded.
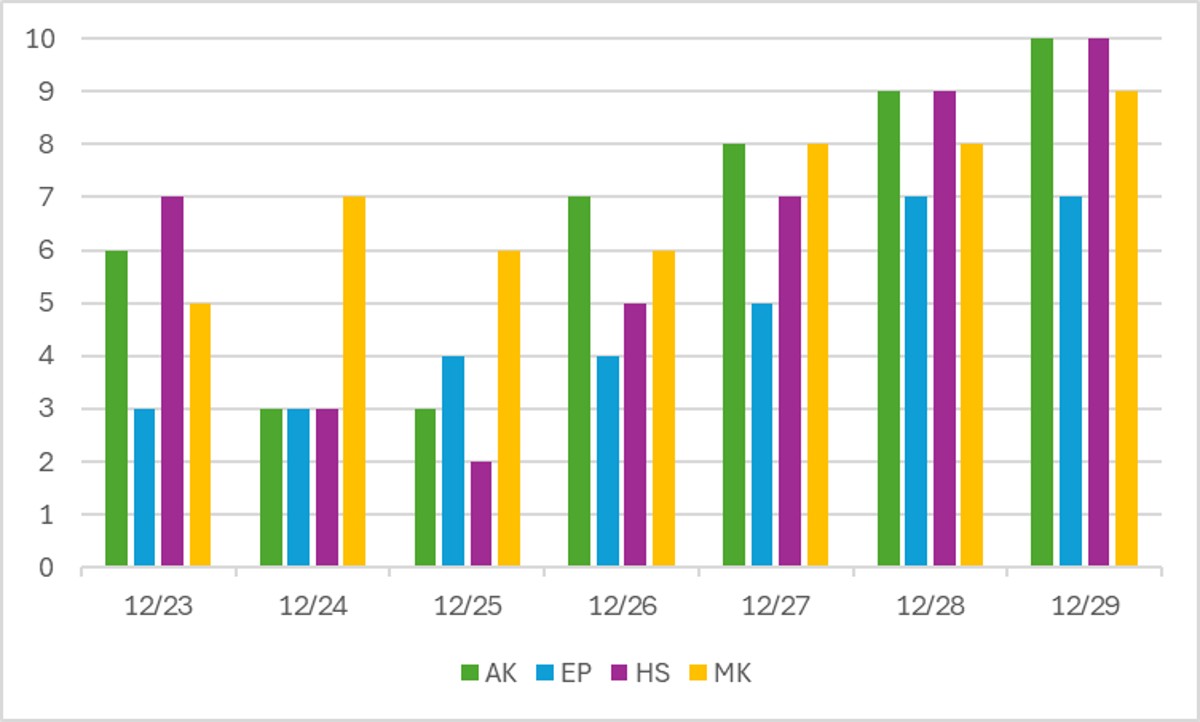
What. A. Week. In the past 5 days, Hollywood Studios has been a crowd level 2 and a crowd level 10 (and almost everything in between)! EPCOT has ranged from a crowd level 3 to 7. Animal Kingdom had two crowd level 3 days, plus a 6, 7, 8, 9 and 10. And Magic Kingdom is the overachiever, with crowds “only” bottoming out at a crowd level 5, then going up to crowd level 9.
This isn’t the most crowded the parks can be. I suspect the 30th (and maybe 31st) will be even more crowded than what we’ve seen so far. If you’re in the parks now, or you’re planning a trip in 2026 between Christmas and New Years … godspeed.
Performance of Crowd Level Predictions
Each week, I give you a very transparent look into how the TouringPlans crowd level predictions performed. Each day at each park is one data point, so each week we have 28 different crowd level predictions to evaluate. Any time a prediction is within one or two crowd levels, things won’t really “feel” much different than what was predicted. Being off by 3 or more crowd levels is where you might feel that difference in wait times throughout the day.

Well, that’s a visually pleasant chart. In the past week, Touring Plans predictions were either spot-on or within 1 crowd level 36% of the time, which is significantly lower than what we’ve been seeing recently. And then 68% of the time Touring Plans predictions were within 2 crowd levels, so that means we get a D+ for our predictions in the past week, which is also lower than recent results. On average, any park on any day of the past week was about 1.8 crowd levels less crowded than what was predicted. The biggest miss of the week was an overprediction by four crowd levels, which happened at EPCOT on December 27th. EPCOT was predicted to be a crowd level 9 that day, but only ended up being a 5. Overall, the average crowd level at EPCOT ended up being 2.7 crowd levels below what was predicted over the past week. Wait times are still high at headliners, but that isn’t filtering down to other attractions as much as it is at other parks. It seems like Festival of the Holidays doesn’t have the same power to draw people to the park as it has in previous years.
Attraction Downtime December 23 – 29
If we average all of the capacity lost due to unexpected downtime over the past week, it comes out to 3.1% of attractions unexpectedly being down. That’s below our historical average, which makes sense. Disney is likely going to work really hard to keep as much attraction capacity available as possible when the parks get busy. In the past week, Hollywood Studios was the park with the most overall downtime, averaging 4.1% of its capacity lost to downtime throughout that period. And Animal Kingdom was just behind at 4.0%.
The worst day for attraction downtime in the past two weeks was on December 26th. On that day, 5% of all capacity at WDW was lost due to unexpected downtime. And the worst park-day was also on December 26th, at Animal Kingdom. On that day, 13% of Animal Kingdom’s attraction capacity was lost due to unexpected downtime. Animal Kingdom was open for 12 hours on the 26th, so 13% downtime is the equivalent of the entire park shutting down for almost 94 minutes. More than an hour and a half. Ouch. It’s definitely part of the reason that Animal Kingdom had the highest crowd level of any park that day.
Attraction Downtime Worst Offender
In the past week, Journey Into Imagination with Figment was the WDW attraction with the worst overall unplanned downtime. It was unexpectedly down for 12% of the past week. That’s one of the lowest weekly winners ever, and there was no other attraction that had 10% or more downtime. Hooray! The worst day for Figment over the last week was on December 24th, when it was down for 32% of the day.

Rope Drop Downtime
Here are problematic offenders from the past two weeks, with the percentage of downtime during the first hour of the day in parentheses:
- Magic Kingdom: The Many Adventures of Winnie the Pooh (13%), The Barnstormer (13%)
- EPCOT: Journey Into Imagination (26%), Test Track (25%), Gran Fiesta Tour (18%)
- Hollywood Studios: Rock’n’Roller Coaster (36%)
- Animal Kingdom: Kali River Rapids (17%), Dinosaur (14%)
Hollywood Studios had the least amount of rope drop downtime of any park?! What kind of weird week is this???
Overall, this is one of the shortest rope drop downtime lists we’ve ever had. Not a bad week for avoiding massive waits by showing up for rope drop.
Wait Times December 23 – 29
Attractions with the Highest Average Posted Wait at Each Park
- Animal Kingdom: Flight of Passage, average posted wait time of 114 minutes (was 65 minutes last week … and 51 minutes the week before that!)
- EPCOT: Cosmic Rewind, average posted wait of 96 minutes (was 76 minutes last week)
- Magic Kingdom: TRON, average posted wait time of 93 minutes (was 63 minutes last week)
- Hollywood Studios: Slinky Dog Dash, average posted wait of 81 minutes (was 60 minutes last week)
These numbers are wild. The average posted wait at Flight of Passage is more than double what it was two weeks ago. And instead of the numbers for most of the year, where we had two or three attractions where the average posted wait was over an hour … this week we had TEN attractions with an average posted wait of an hour or more.
If we narrow to just 12/27-12/29, the numbers get even crazier. 18 attractions had an average posted wait of an hour or more. And five attractions had an average posted wait of 100 minutes or more. On those three days, the average posted wait at Flight of passage was a whopping 160 minutes! That includes 7:30 am early entry. That includes the posted wait at park close. Remarkable.
Parks with the Highest and Lowest Average Wait
- Highest: Hollywood Studios, average park-wide posted wait of 48 minutes (was 34 minutes at last week)
- Lowest: Magic Kingdom, average park-wide posted wait of 29 minutes (was 21 minutes last week)
Nope nope nope nope. That’s my response to those park-wide averages. And if we narrow to 12/27-12/29, this is what happens:
- Animal Kingdom: 62 minutes
- Hollywood Studios: 58 minutes
- EPCOT: 46 minutes
- Magic Kingdom: 33 minutes
So if we look at the three most recent days, the average posted wait for ALL attractions at Animal Kingdom and Hollywood Studios was basically an hour. That includes options like Alien Swirling Saucers Gorilla Falls Exploration Trail (yes, really) as well as Flight of Passage and Rise of the Resistance. Considering that these park-wide averages were well under 30 minutes for most of the year, numbers over an hour are just pure insanity.
Most Inflated Posted Wait Times
We all know that Disney inflates their posted wait times on purpose. They have many reasons for doing this. Some are totally understandable, and some are potentially more problematic. We can figure out how much posted wait times are being inflated by comparing submitted actual wait times from the Lines App and the posted wait time when the person timing their wait entered the line.
Over the past week, actual wait times in the Lines App averaged 70% of what was posted. That’s close to our LLMP historical average. Overall, if the posted wait time at a popular attraction was 60 minutes, you could’ve expected to wait about 42 minutes instead.
But the worst inflation offender for the past week was Na’vi River Journey. At this one attraction, submitted actual wait times were only 39% of posted wait times in the past week. That means that if Na’vi River Journey had a 60 minute posted wait, you probably would have actually only waited 23 minutes instead. Less than half of what was posted! Remember to always check the Lines app for predicted actual waits instead of making decisions based on what is posted.

This Week’s Wait Time Rock Star
Between December 23rd and 29th, we had just over 700 timed actual waits submitted through the Lines app. The one person who recorded the most actual waits during that time was Digordie95, with 38 overall timed waits – 34 standby waits and 4 single rider waits. Thanks for all of that timing, Digordie95! It unfortunately does not compete with the the 97 timed waits in a single week from our current timing champion, preef.
Looking Ahead: December 30 – January 5
I write this article on Tuesday evenings so that you all have the very freshest of data on Wednesdays. That means the 30th will already be in the past by the time you’ve read this, so welcome to the future!
Here we go. Crowds are going to stay very high for a bit – at least through the weekend after New Year’s day. Disney has unusually long park hours through Sunday, so we can expect that means lots of people. It’s the most crowded time of year. Pack your patience. And/or spend a lot of money on Lightning Lanes. But even finding return times will be frustrating.
Temperatures are starting out chilly, but should warm up nicely as we get closer to the weekend. But lows are still in the low 50s, and that feels surprisingly cold in the morning! Make sure you’re prepared with layers.
Were you in the parks this past week? Or are you headed to Orlando soon? Let me know in the comments below!
You May Also Like...
-

Early December really said, “Here, have everything you love … but without the lines.” Holiday decorations? Everywhere. Special treats and entertainment?…
-

It’s officially that fun little in-between season at Walt Disney World! The brief window after Thanksgiving crowds head home, but before…