
Disney Data Dump April 8 2026
What we saw this past week is a really good reminder that Spring Break season isn’t one clean spike. It’s a series of waves. And sometimes the biggest waves happen around the holidays, not on them. Easter weekend itself ended up being relatively manageable in most parks, while the days on either side carried more of the weight from peak travel demand.
There are also some very clear patterns continuing to emerge. The parks that can absorb crowds are doing exactly that. The parks with fewer attractions are feeling every bit of that pressure. And a couple of reliability issues are starting to show up at exactly the wrong time of year.
Let’s dig into what actually happened this week, and what it tells us about where crowds go from here.
Observed Crowd Levels March 31 – April 6
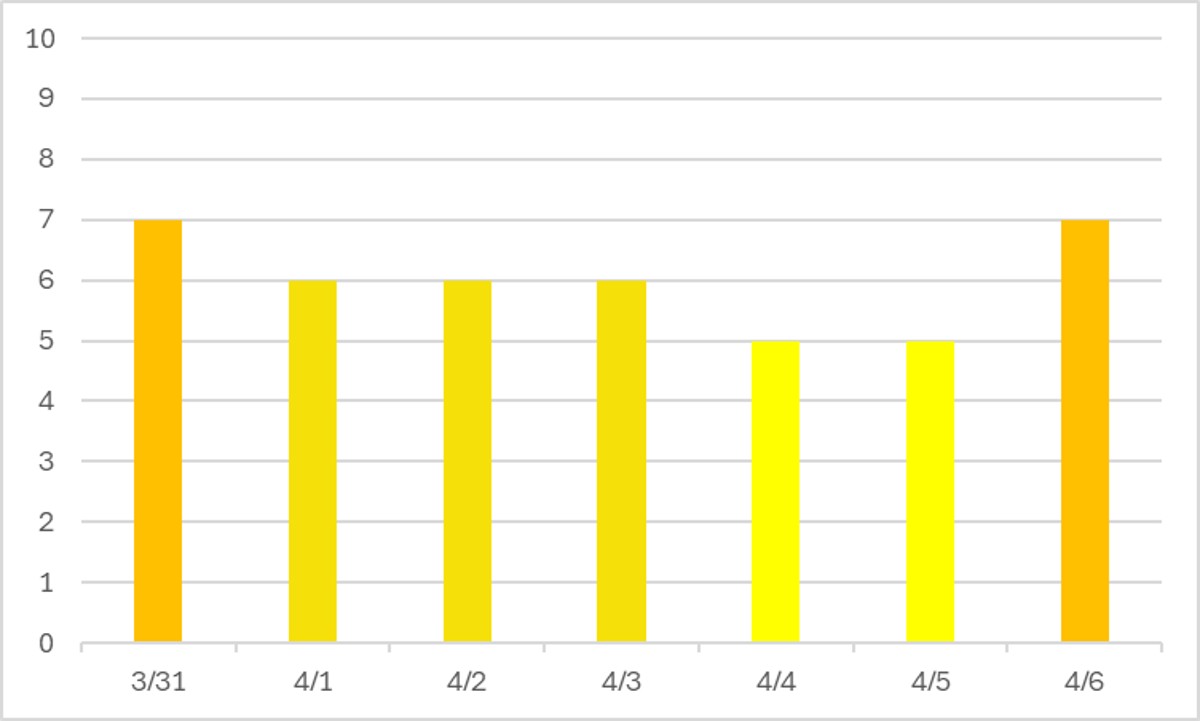
Interestingly, Easter weekend itself had the lowest crowds of the past week! Instead, the Spring Break weeks on either side seem to have the higher crowds. The lowest two tiers of Annual Passes were both blocked out during this entire 7-day window, so these crowds are mostly due to other guests.
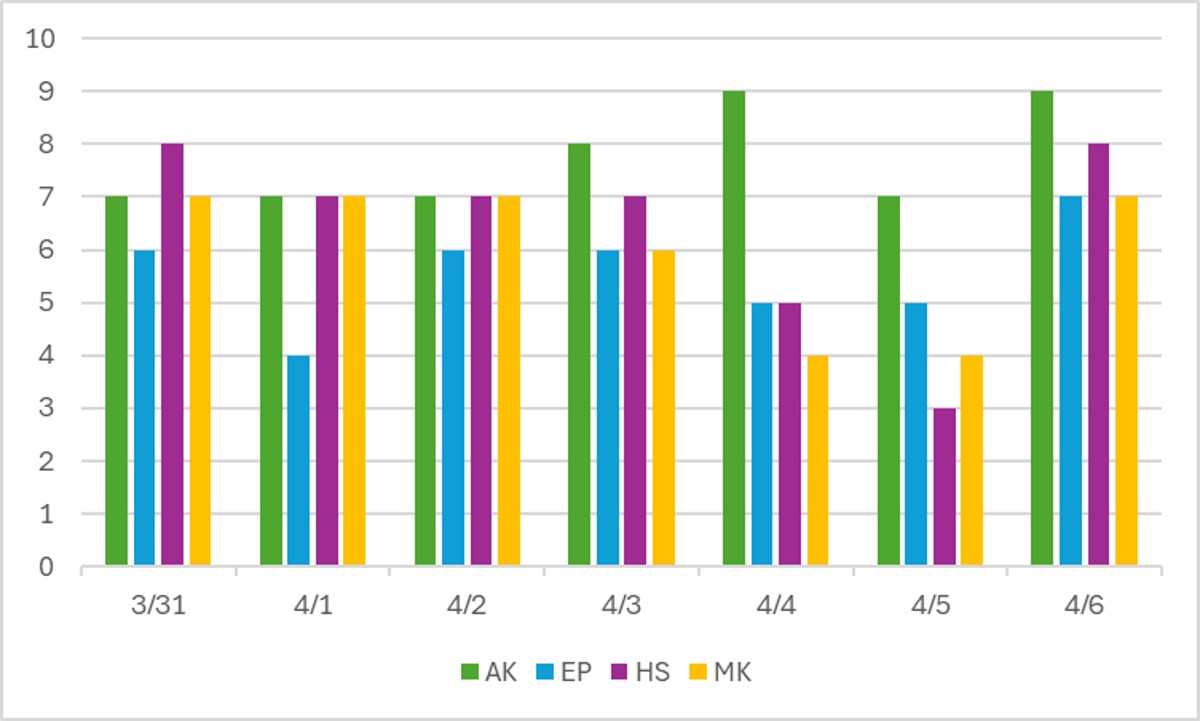
At the park-by-park level, things get even more interesting. Easter weekend was even less crowded than it appeared in the overall graph … unless you went to Animal Kingdom. AK hit a crowd level 9 twice this week – the only park to ever get above an 8. And one of those crowd level 9 days was on Saturday the 4th, when no other park even got above a crowd level 5. And then AK bounced right back to another 9 on the 6th too. Even with Flower and Garden Festival happening, EPCOT consistently had some of the lowest waits of the past week, other than on Easter itself.
Performance of Crowd Level Predictions
Each week, I give you a very transparent look into how the TouringPlans crowd level predictions performed. Each day at each park is one data point, so each week we have 28 different crowd level predictions to evaluate. Any time a prediction is within one or two crowd levels, things won’t really “feel” much different than what was predicted. Being off by 3 or more crowd levels is where you might feel that difference in wait times throughout the day.
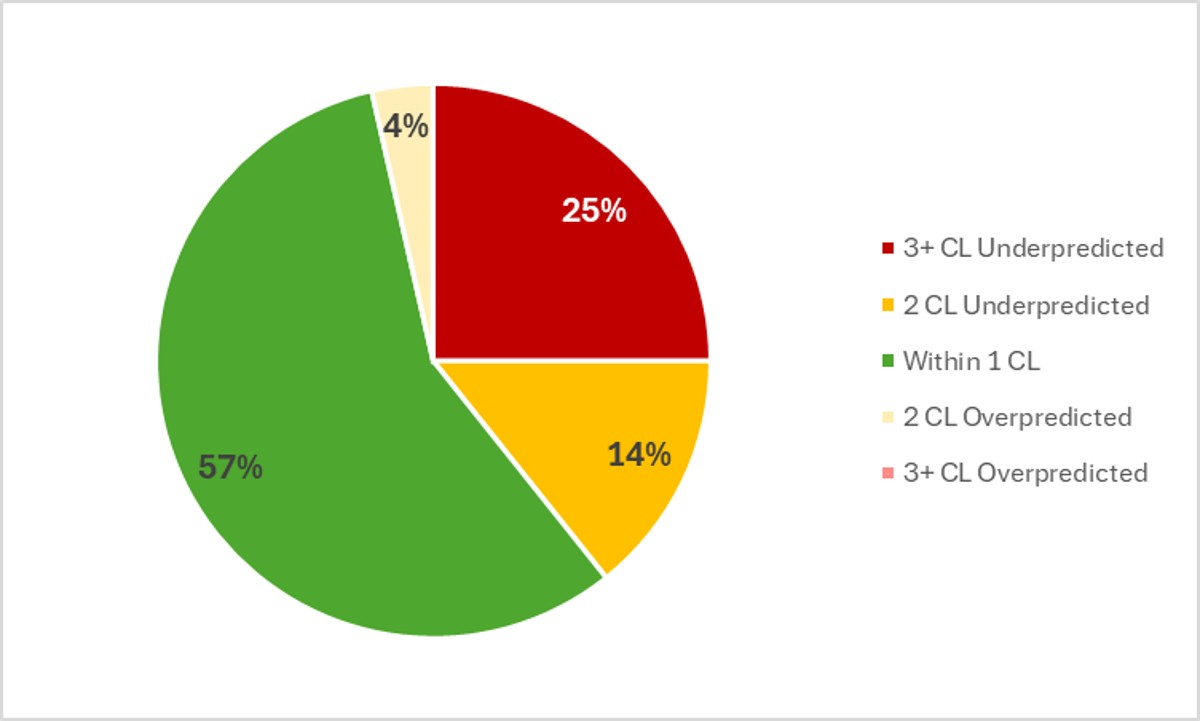
In the past week, Touring Plans predictions were either spot-on or within 1 crowd level 57% of the time, which is significantly lower than our average so far this year. And then 75% of the time Touring Plans predictions were within 2 crowd levels, so that means we get a C for our predictions in the past week. What may have been disappointing to those in the parks over the past week is that a large number of misses were significant under-predictions. That means the parks were more crowded than predicted. All of those big underpredictions were at Hollywood Studios and Animal Kingdom. Those are the two parks with the shortest slate of attractions right now thanks to construction, so they don’t handle crowds well. The biggest miss of the week was an under-prediction by 4 crowd levels, which happened at Hollywood Studios on the 6th.
Attraction Downtime March 31 – April 6
If we average all of the capacity lost due to unexpected downtime over the past week, it comes out to 4.6% of attractions unexpectedly being down. That’s pretty close to our result from last week, and still slightly higher than what we expect during crowded seasons. Usually Disney works pretty hard to keep as much online as possible when crowds are high. In the past week, Animal Kingdom was the park with the most overall downtime, averaging 7.7% of its capacity lost to downtime. That’s quite impactful at a park with so few attractions that have queues with timed waits.
The worst day for attraction downtime in the past week was on April 6th. On that day, 7% of all capacity at WDW was lost due to unexpected downtime. And the worst park-day of the was the nice, predictable combination of the worst overall day and worst park of the past week – at Animal Kingdom on April 6th, when 14% of that park’s capacity was lost due to unexpected downtime. Animal Kingdom was open for 11 hours on the 6th, so 14% downtime is the equivalent of the entire park shutting down for just over 92 minutes. Thankfully, you can always default to playing Wilderness Explorers or wandering animal trails or watching shows and musical acts while you wait for rides to come back online.
Attraction Downtime Worst Offender
In the past week, Kali River Rapids was the WDW attraction with the worst overall downtime. It was unexpectedly down for 22% of the past week. Almost a quarter of the week! That continues a trend with quite a bit of downtime as this attraction for the past month or two. The worst day at Kali River Rapids over the last week was on April 2nd, when it was down for 33% of the day. But there were a few other days where it was up over 25% downtime too.

Rope Drop Downtime
Here are problematic offenders from the past week, with the percentage of downtime during the first hour of the day in parentheses:
- Magic Kingdom: Country Bear Musical Jamboree (42%), Monsters Inc Laugh Floor (42%), Enchanted Tiki Room (42%), Hall of Presidents (39%), Buzz Lightyear (32%), Tiana’s Bayou Adventure (30%), Pirates of the Caribbean (20%), The Many Adventures of Winnie the Pooh (18%), Mad Tea Party (16%), Magic Carpets (11%)
- EPCOT: Spaceship Earth (25%), Frozen Ever After (19%), Remy’s Ratatouille Adventure (10%)
- Hollywood Studios: Rise of the Resistance (31%)
- Animal Kingdom: Kali River Rapids (98%)
MAGIC KINGDOM. For the second week in a row?! Seven different attractions that are missing at least 20% of their rope drop hours in the past week. Once again, it’s not many headliners. But that means there are fewer choices for everyone, which decreases the helpfulness of early entry or rope drop because everyone is forced into just a few lines that happen to be open.
Hollywood Studios is looking pretty great, other than Rise of the Resistance continuing to struggle in the morning. And we can all just assume at this point that Kali River Rapids won’t be open for the first hour of the day. Thankfully, not many people are looking to get soaked that early in the day anyway.
Over at EPCOT, we’re seeing an emerging trend of early downtime at the World Showcase attractions. This is something to pay close attention to if you’re entering from the International Gateway.
Wait Times March 31 – April 6
Attractions with the Highest Average Posted Wait at Each Park
- EPCOT: Test Track, average posted wait of 99 minutes (was 99 minutes at Cosmic Rewind last week)
- Hollywood Studios: Slinky Dog Dash, average posted wait of 96 minutes (was 88 minutes at Rise of the Resistance last week)
- Animal Kingdom: Flight of Passage, average posted wait time of 88 minutes (was 70 minutes last week)
- Magic Kingdom: TRON, average posted wait time of 82 minutes (was 76 minutes last week)
We had some more shifts in attractions with the highest wait this week, with Cosmic Rewind and Rise of the Resistance both calming back down slightly thanks to less downtime. Otherwise, wait times were generally up compared to last week.
Parks with the Highest and Lowest Average Wait
- Highest: Hollywood Studios, average park-wide posted wait of 49 minutes (was 44 minutes last week)
- Lowest: Magic Kingdom, average park-wide posted wait of 26.5 minutes (was 24 minutes last week)
This week, two parks once again popped over the whole-park average of more than 45 minutes, which means lots of waiting all throughout your park day. Thankfully, things were still manageable at Magic Kingdom with its sub-30 minute waits!
Most Inflated Posted Wait Times
We all know that Disney inflates their posted wait times on purpose. They have many reasons for doing this. Some are totally understandable, and some are potentially more problematic. We can figure out how much posted wait times are being inflated by comparing submitted actual wait times from the Lines App and the posted wait time when the person timing their wait entered the line.
Over the past week, actual wait times in the Lines App averaged 73% of what was posted. That’s close to our historical average in the era of Lightning Lanes. Overall, if the posted wait time at a popular attraction was 60 minutes, you could’ve expected to wait less than 44 minutes instead.
But the worst inflation offender for the past week was The Seas with Nemo and Friends. At this one attraction, submitted actual wait times were only 35% of posted wait times in the past week. That means that if Nemo had a 30 minute posted wait, you probably would have actually only waited less than 11 minutes instead. Almost a third of what was posted! Remember to always check the Lines app for predicted actual waits instead of making decisions based on what is posted.

This Week’s Wait Time Rock Star
Between March 31st and April 6th, we had just over 1000 timed actual waits submitted through the Lines app. The one person who recorded the most actual waits during that time was ekirchem, with 29 overall timed waits – 3 Lightning Lane waits, and 26 standby waits. Thanks for all of that timing, ekirchem! It unfortunately does not compete with the the 97 timed waits in a single week from our current timing champion, preef.
Looking Ahead: April 7 – 13
I write this article on Tuesday evenings so that you all have the very freshest of data on Wednesdays. That means the 13th will already be in the past by the time you’ve read this, so you’re back to the future!
Annual Pass blockout dates end after April 9th, so we may see more locals head to the parks, especially over the weekend. Otherwise, we should see crowd levels start to steadily decline from now through the rest of the school year.
After some rain early in the week, the rest of the next 7 days should be glorious – highs in the low or mid 80s, with plenty of sun. Enjoy that Florida spring!
Were you in the parks this past week? Or are you headed to Orlando soon? Let me know in the comments below!
You May Also Like...
-

If you were hoping for an April Fools’ joke where I tell you Spring Break crowds suddenly disappeared… I regret to…
-

March was surprisingly mild, and now April has entered the chat saying, “Hold my Dole Whip.” The first full week of…