
Disney Data Dump August 13 2025
We’re still coasting through the calm of August, and if you can handle the triple-digit feels-like temps, this is prime park time. Crowds stayed low again this week, with only one day even creeping up to a 4, and plenty of easy touring for anyone who doesn’t mind a little sweat equity. Schools are back in session in much of the country (including Orlando), EPCOT is still deep in Diet Mode, and Animal Kingdom keeps topping the crowd charts simply because fewer attractions means longer lines for the ones that are open. Let’s dive into the numbers before Halloween season kicks off and shakes things up.
Observed Crowd Levels August 5 – 11
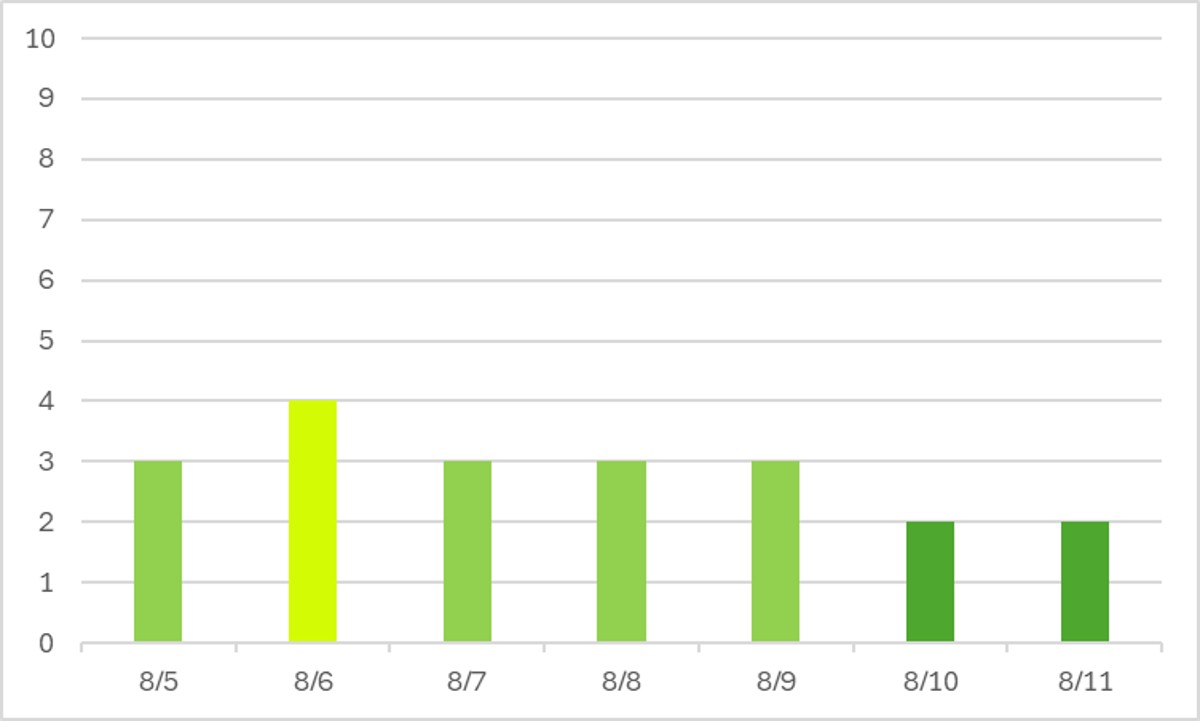
Maybe the most surprising thing here is that the parks actually hit a crowd level 4 one day? Otherwise we’re clearly in an August slump with many schools across the country already back in session, including the local public school districts in Orlando. It’s a great time to visit – if you can stand the heat.
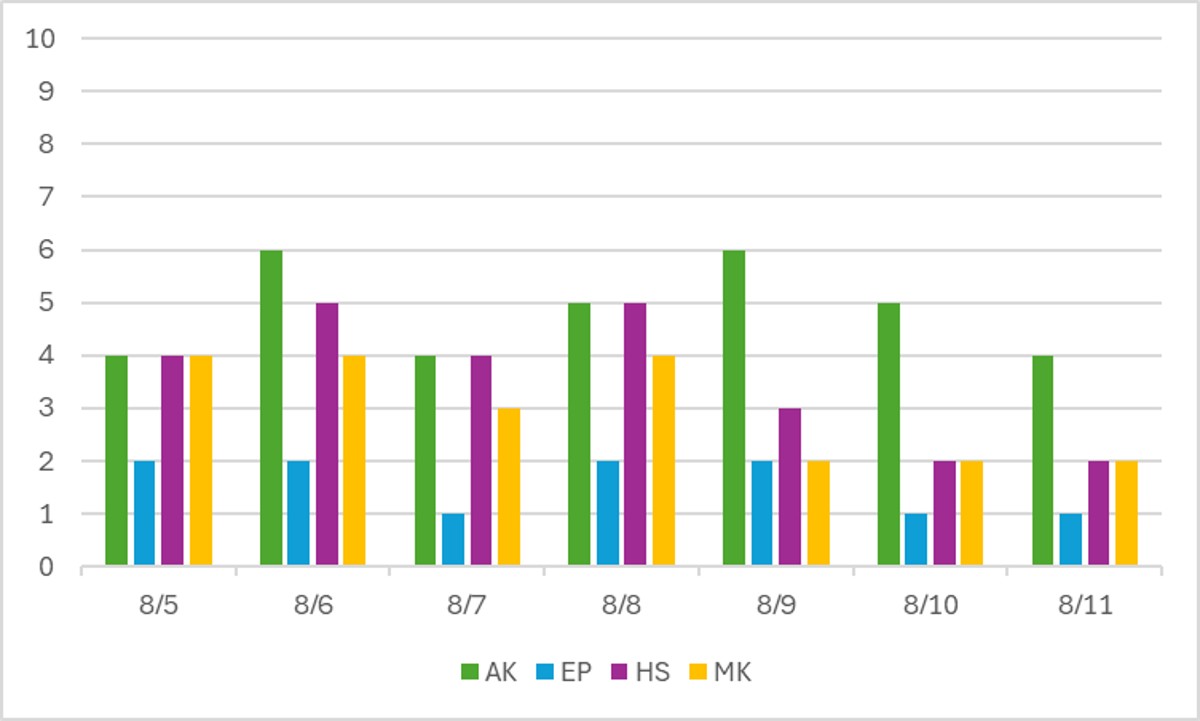
Not much has changed here from the past couple of weeks. Diet EPCOT is still living its best diet life. Other than major crowds at Test Track, where there are high wait times all day, not many other EPCOT attractions are seeing even moderate wait times. Magic Kingdom kicked out of its string of 1s and 2s for a few days – my hypothesis is that this was local families getting to MK one last time before the school year. Because as soon as the weekend hit, crowd levels went back down. Animal Kingdom continues its reign at the top of the crowd level charts. That doesn’t mean that the park itself is slammed with people, but it does mean that there are few attractions with lines that are open, and so they all have high wait times. You’ll want to go off the beaten path and explore other parts of the park to enjoy your time at AK.
Performance of Crowd Level Predictions
Each week, I give you a very transparent look into how the TouringPlans crowd level predictions performed. Each day at each park is one data point, so each week we have 28 different crowd level predictions to evaluate. Any time a prediction is within one or two crowd levels, things won’t really “feel” much different than what was predicted. Being off by 3 or more crowd levels is where you might feel that difference in wait times throughout the day.
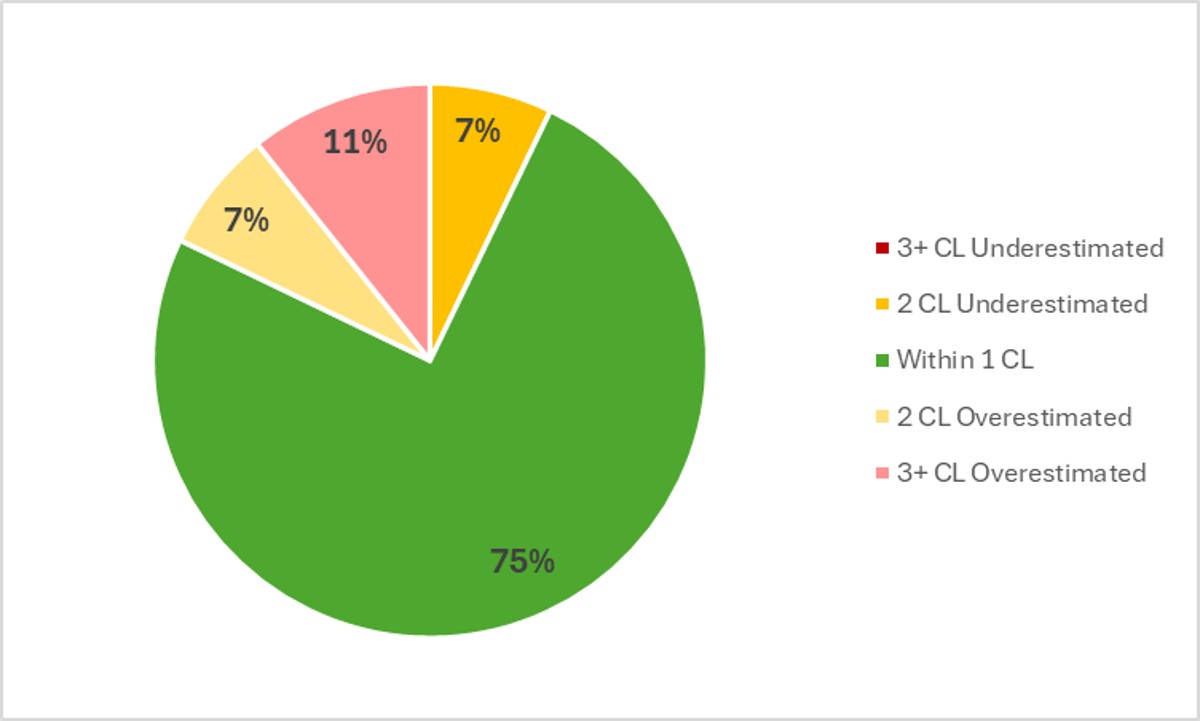
Y’all. Look at all that green! In the past week, Touring Plans predictions were either spot-on or within 1 crowd level 75% of the time, which is the highest number we’ve seen all year! 89% of the time Touring Plans predictions were within 2 crowd levels, so that means we get a B+ for our predictions in the past week. Again, that’s much higher than the average result for the year. Let there be great rejoicing throughout the World. On average, the crowd level at any park any day of the week was just 0.4 crowd levels below prediction. That’s barely a miss at all, and is a good sign that maybe the recent crowd calendar update is doing a good job capturing crowd behavior. The biggest miss of the week was an overprediction by 4 crowd levels, which happened at EPCOT on the 11th – Touring Plans predicted a 5, and the actual crowd level turned out to be a 2.
Attraction Downtime August 5 – 11
If we average all of the capacity lost due to unexpected downtime over the past week, it comes out to 5.3% of attractions unexpectedly being down. That’s a tick up from last week, and definitely above our historical average. In the past week, Magic Kingdom was the park with the most overall downtime, averaging 6.3% of its capacity lost to downtime throughout the week. At least it’s a park with a whole lot of attractions to absorb crowds who are displaced due to downtime.
The worst day for attraction downtime in the past week was on August 5th. On that day, 8% of all capacity at WDW was lost due to unexpected downtime. The worst park-day of the week was a nice predictable combination of the worst day and worst park – August 5th at Magic Kingdom. On that day, 13% of its attraction capacity was lost due to unexpected downtime. Magic Kingdom was open for 14 hours on the 5th, so 13% downtime is the equivalent of the entire park shutting down for 109 minutes. That’s almost 2 hours of the whole park being broken down!
Attraction Downtime Worst Offender
In the past week, Test Track was the WDW attraction with the worst overall downtime. It was unexpectedly down for 25% of the past week. That’s a really terrible number for an almost-brand-new attraction that already has high demand and high wait times. And it wasn’t even due to a lot of poor weather – otherwise a bunch of other outdoor attractions would’ve seen similar numbers. The worst day at Test Track was on August 5th, when it was down for 40% of the day. But there’s a really strong trend emerging, where most days it shuts down at 4 or 5 pm and never comes back up before the park closes, or only comes up around 8 pm. It happens often enough that I would encourage you to get in line well before 3 pm if you don’t want to risk a shut-down.

Rope Drop Downtime
Here are problematic offenders from the past week, with the percentage of downtime during the first hour of the day in parentheses:
- Magic Kingdom: Under the Sea (17%), Tiana’s Bayou Adventure (14%), TTA PeopleMover (14%)
- EPCOT: Remy’s Ratatouille Adventure (14%), Test Track (11%)
- Hollywood Studios: Rock’n’Roller Coaster (21%), Alien Swirling Saucers (14%)
- Animal Kingdom: No rope drop issues!
After two weeks of TRULY horrible rope drop performance, I will hesitantly declare that this week wasn’t … so bad? Animal Kingdom even gets a gold star! Rock’n’Roller Coaster has been showing up enough that we can call it a regular problem that you should have a backup plan for. Tiana’s is the same. Hopefully Test Track gets its act together and doesn’t show up again, especially since it’s having a lot of late afternoon issues. It doesn’t need morning issues too.
Wait Times August 5 – 11
Attractions with the Highest Average Posted Wait at Each Park
- EPCOT: Test Track, average posted wait of 81 minutes (was 77 minutes last week)
- Hollywood Studios: Rise of the Resistance, average posted wait of 77 minutes (was 96 minutes last week)
- Animal Kingdom: Flight of Passage, average posted wait time of 75 minutes (was 69 minutes last week)
- Magic Kingdom: TRON, average posted wait time of 69 minutes (was 68 minutes last week)
Rise of the Resistance has calmed back down a little, allowing Test Track to take the top spot this week (and Cosmic Rewind was actually right behind it, at 80 minutes). So EPCOT in general has really low waits, but if you’re wanting to do Cosmic Rewind and Test Track during your EPCOT day, you’re in for a rough time. FWIW – I recommend rope dropping Cosmic Rewind and then using Single Rider at Test Track, if you can.
Parks with the Highest and Lowest Average Wait
These parks likely won’t change week-to-week unless something ridiculous happens, but these data points will give us a high-level view of how wait times are trending from week to week.
- Highest: Animal Kingdom, average park-wide posted wait of 37 minutes (was 36 minutes at Hollywood Studios last week)
- Lowest: Magic Kingdom, average park-wide posted wait of 21.5 minutes (was 20 minutes last week)
Hollywood Studios mellowed back out enough this week to let Animal Kingdom squeeze past into the top overall spot for park-wide wait times. Otherwise, no major shifts at the park level.
Most Inflated Posted Wait Times
We all know that Disney inflates their posted wait times on purpose. They have many reasons for doing this. Some are totally understandable, and some are potentially more problematic. We can figure out how much posted wait times are being inflated by comparing submitted actual wait times from the Lines App and the posted wait time when the person timing their wait entered the line.
Over the past week, actual wait times in the Lines App averaged 68% of what was posted. That’s very close to our historical average. Overall, if the posted wait time at a popular attraction was 60 minutes, you could’ve expected to wait just under 41 minutes instead.
But the worst inflation offender for the past week was Gran Fiesta Tour, again! At this one attraction, submitted actual wait times were only 31% of posted wait times in the past week. (It was 32% last week, so we’re seeing a trend.) That means that if Gran Fiesta Tour had a 15 minute posted wait, you probably would have actually only waited less than 5 minutes instead. Less than a third of what was posted. Remember to always check the Lines app for predicted actual waits instead of making decisions based on what is posted.

This Week’s Wait Time Rock Star
Between August 5th and 11th, we had almost 1500 timed actual waits submitted through the Lines app. The one person who recorded the most actual waits during that time was tknittel, with 50 overall timed waits – 21 standby waits and 29 Lightning Lane waits. Thanks for all of that timing, tknittel! It unfortunately does not compete with the the 97 timed waits in a single week from our current timing champion, preef.
Looking Ahead: August 12 – 18
I write this article on Tuesday evenings so that you all have the very freshest of data on Wednesdays. That means the 12th will already be in the past by the time you’ve read this, so you’ve made it to the future!
For weeks and weeks I’ve talked about nothing remarkable happening. But we’re here. It’s now. Something remarkable is happening within the next week. That remarkable thing is the return of my very favorite Walt Disney World park days – party days at Magic Kingdom! If you haven’t paid attention before, or you’re new around here, party days at Magic Kingdom are almost ghost towns during the day. That’s because families on once-in-a-lifetime (or even once-for-several-years) vacations and only one Magic Kingdom don’t want to miss an evening in the park because it closes early for a Halloween or Holiday party. So everyone floods Magic Kingdom on non-party days, and party days are blessedly empty.
That behavior should be EVEN MORE pronounced this year thanks to the debut of Starlight. People who attend during party days aren’t just missing fireworks, they’re also missing the brand new parade. Party days should be even emptier, and non-party days will be even crazier. Over the past 3-4 years, the difference between party days and non-party days during party season was already an average of something like 4 crowd levels. If you’ve got flexibility in your vacation schedule, and especially if you have park hoppers, you should absolutely take advantage of touring Magic Kingdom on a party day. Two of those dates happen within the next week, on August 15th and 17th. Enjoy them!
The heat and humidity will be real this week, with feels-like temperatures frequently popping up to 105 or 110. Stay hydrated, and take frequent indoor air-conditioning breaks.
Were you in the parks this past week? Or are you headed to Orlando soon? Let me know in the comments below!
You May Also Like...
-

Well, that Starlight Summer Surge was ... brief. It fizzled fast, and now we’re solidly in empty August territory. Blame school…
-

For the first time ever, this week’s Data Dump comes to you from the back porch of Jambo House, with giraffes…
Thanks for all your info! My family trip starts tomorrow 🙂 It seems like Magic Kingdom hours shift to opening at 8am on party days, instead of 9am. Combined with the historically observed lower crowds on those days, do you think it is less important to show up early for early entry or rope drop on those days? Also, I noticed HS is open later and has 2 showings of Fantasmic on MK party days. I’m just curious if Disney has shifted operating hours on party days in past years at MNSSHP season?
Ehhhhhhhh define less important. It will be an uncrowded day, but that first hour will be even. more. empty. Ha! I wouldn’t miss it, but you’ll probably still have plenty of time to do everything you want to do during the rest of the day.
And yes, Hollywood Studios being slightly more crowded on MK party days has been a trend for a few years, so Disney has tweaked operating hours there before too.
From personal experience – Early Entry of these 8 am openings on party days is awesome and not to be missed. Personal example from August 15 this year: Peter Pan’s Flight, small world, Winnie the Pooh, Haunted Mansion, Jungle Cruise, Tiana’s Bayou Adventure, Pirates of the Caribbean, Tiki Room — all basically walk-ons, out of the park at 9:30, two hours after EE started. We have done this in other years too (always in August near the beginning of party season), the experience is similar. After about 9:30 there is less walking on as lines start to build, but you can keep going at that 4-ride per hour pace for another hour or so if you choose carefully. Especially when the weather is hot, it is worth it to do Early Entry / rope drop on these days.
In describing the 4-crowd-level overprediction for Epcot on August 11, you say the actual crowd level was a 2. However, your earlier graph shows it was a 1, which is what it would have to be in order to be off by 4 levels from a predicted 5.
Good catch as always! This is why I need a numpad …