
Disney Data Dump August 27 2025
We’re starting to close out August with a little bit of everything: low overall crowd levels, some bigger party-day vs. non-party-day swings at Magic Kingdom, and Test Track … well, continuing to test our patience. It’s the kind of week that reminds you just how variable late summer can be, all depending on the party schedule and what the weather decides to do that day. Let’s dig into what the numbers showed us this time around!
Observed Crowd Levels August 19 – 25
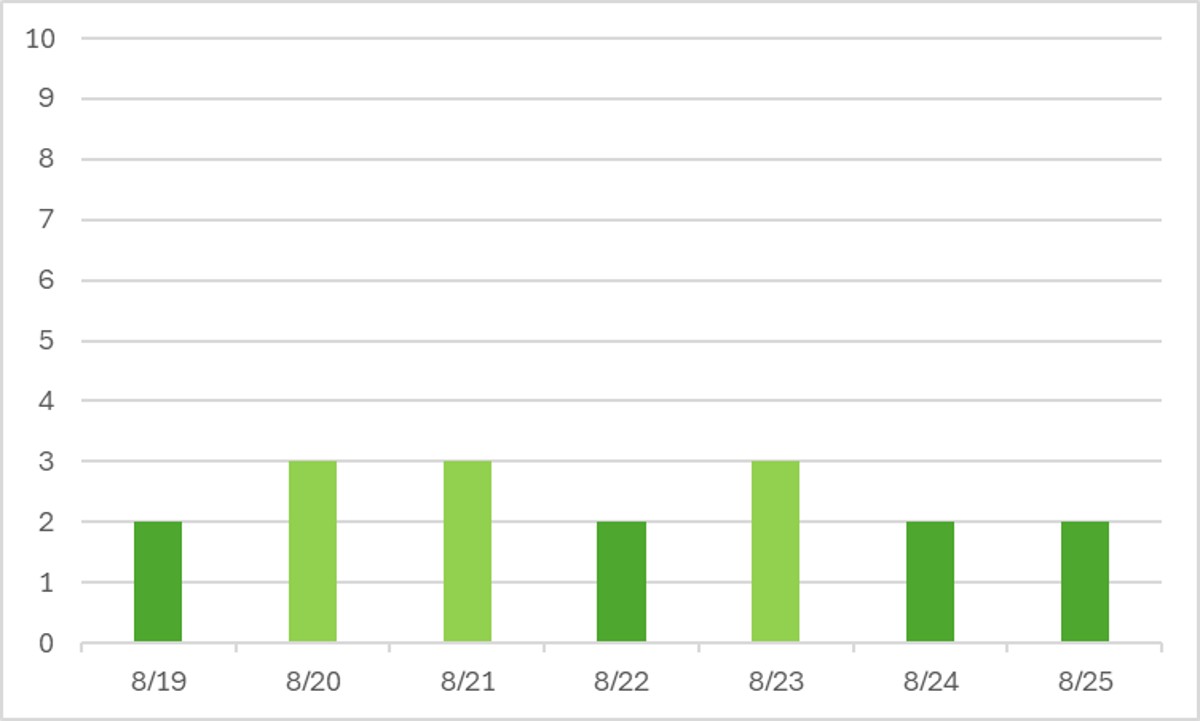
Ok, so things are a little more crowded than last week. But only a little – a whole three crowd level 3 days. Perhaps unsurprisingly, those three crowd 3 days were all non-party days at Magic Kingdom, so overall wait times were higher.
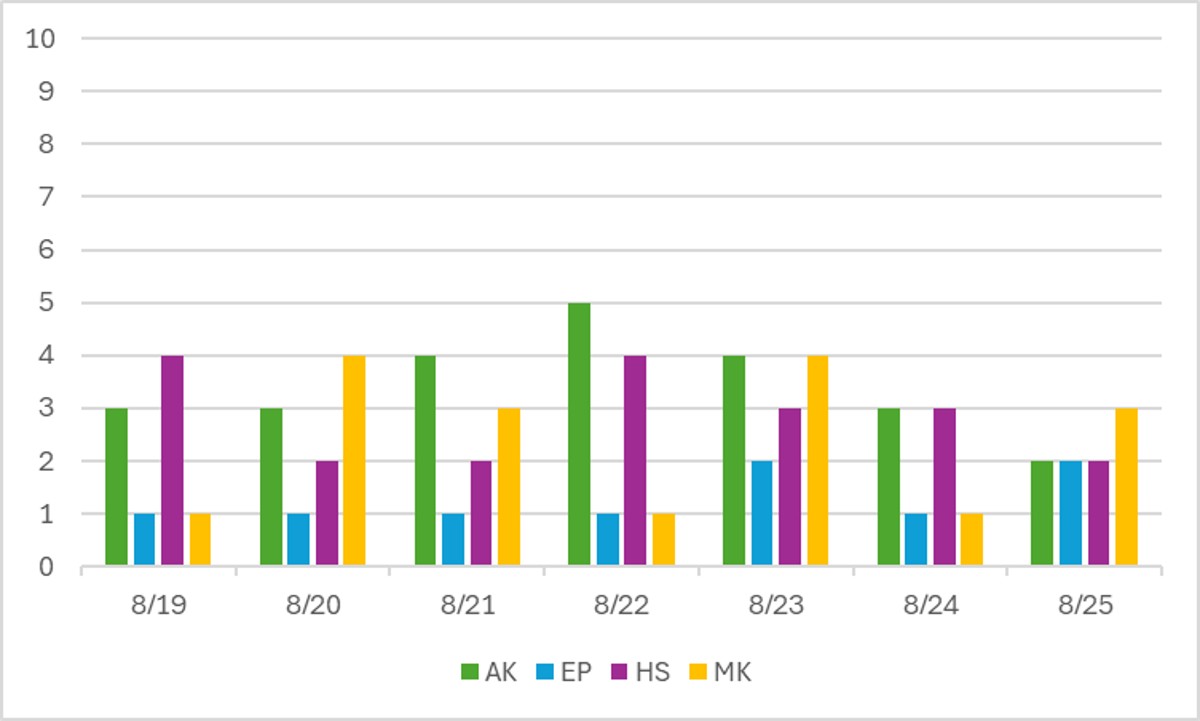
Let’s play a game called “pick out the party days” at Magic Kingdom. If you guessed the 19th, 22nd, and 24th, you’re a winner! Even in this low-crowd season overall, we’re seeing a difference of 2-3 crowd levels between party day and non-party day crowds at Magic Kingdom. Expect that difference to increase with increasing crowds as we head into the fall.
Animal Kingdom continues to be the most variable park. That’s thanks to so few attractions with timed waits in the park. If one goes down or weather goes through, it has a much bigger impact on wait times, and therefore crowd levels.
And we’re at the tail end of Diet EPCOT with Food & Wine Festival kicking off tomorrow. But for now, you can enjoy really low waits throughout the park … other than at Test Track and Cosmic Rewind.
Performance of Crowd Level Predictions
Each week, I give you a very transparent look into how the TouringPlans crowd level predictions performed. Each day at each park is one data point, so each week we have 28 different crowd level predictions to evaluate. Any time a prediction is within one or two crowd levels, things won’t really “feel” much different than what was predicted. Being off by 3 or more crowd levels is where you might feel that difference in wait times throughout the day.
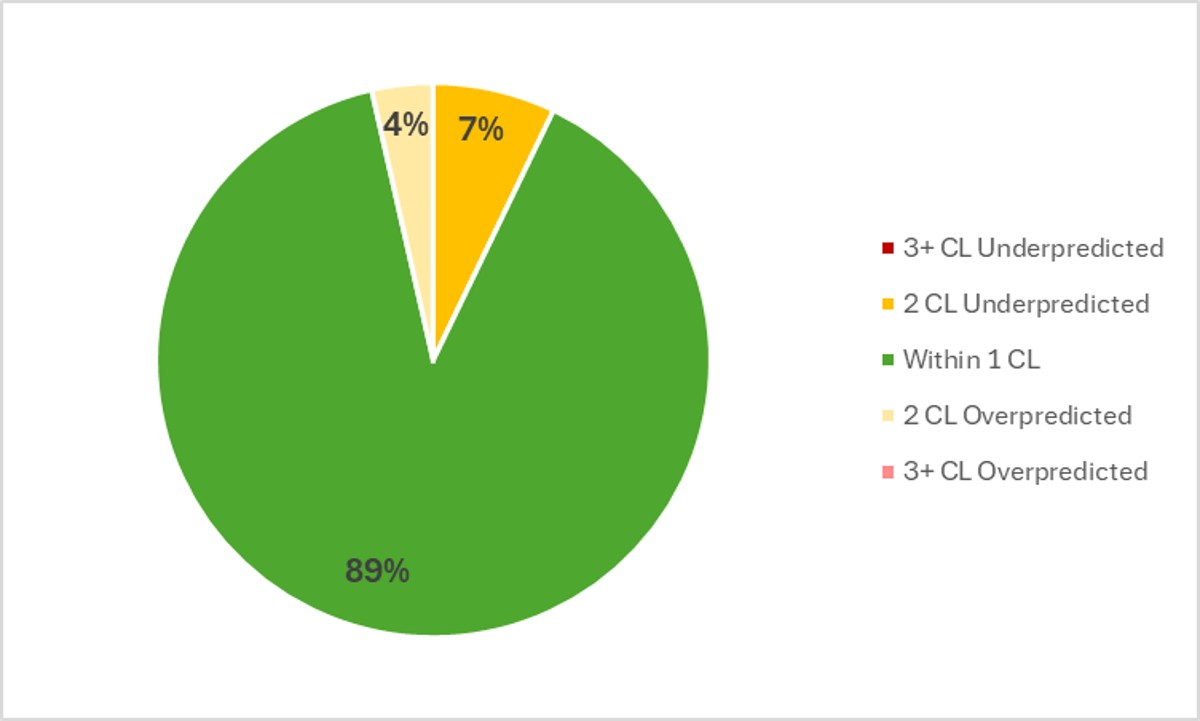
What is this glorious green pie chart?! With no red at all?! In the past week, Touring Plans predictions were either spot-on or within 1 crowd level 89% of the time, which is very incredible. 100% of the time Touring Plans predictions were within 2 crowd levels, so that means we get an A+ for our predictions in the past week. Literally cannot get better than that! On average, the crowd level at any park any day of the week was 0.4 crowd levels below prediction. That’s barely noticeable overall, which is what we’re going for. There were no big misses this week. Hooray, let there be great rejoicing throughout the World.
Attraction Downtime August 19 – 25
If we average all of the capacity lost due to unexpected downtime over the past week, it comes out to 6% of attractions unexpectedly being down. That’s still above our historical average, and a little lower than last week. In the past week, Hollywood Studios was the park with the most overall downtime, averaging 6.7% of its capacity lost to downtime throughout the week. (Magic Kingdom was barely behind at 6.6%).
The worst day for attraction downtime in the past week was on August 22nd. On that day, 9% of all capacity at WDW was lost due to unexpected downtime. The worst park-day of the week was also on the 22nd, at Magic Kingdom. On that day, 13% of its attraction capacity was lost due to unexpected downtime. The 22nd was a party day, so Magic Kingdom was only open for 10 hours, so 13% downtime is the equivalent of the entire park shutting down for 78 minutes. That’s like the entire park closing an hour and 15 minutes early on an already short day. No bueno.
Attraction Downtime Worst Offender
In the past week, Test Track was once again the WDW attraction with the worst overall downtime. It was unexpectedly down for 30% of the past week. Almost a third of the entire week! And this is technically the newest attraction in all of Walt Disney World. And it wasn’t all weather-related downtime either. The worst day at Test Track was on August 22nd, when it was down for 51% of the day. This is the third week in a row that Test Track has had more than 20% downtime overall, and it’s the worst week we’ve seen for it since it reopened. I think it’s safe to say that you have to plan on Test Track downtime in your EPCOT touring.
Rope Drop Downtime
Here are problematic offenders from the past week, with the percentage of downtime during the first hour of the day in parentheses:
- Magic Kingdom: Tiana’s Bayou Adventure (37%), Magic Carpets (26%), Pirates of the Caribbean ( 26%), Astro Orbiter (19%), Haunted Mansion (18%), Space Mountain (13%), Peter Pan’s Flight (10%)
- EPCOT: Test Track (34%), The Seas with Nemo & Friends (19%), Mission: SPACE (18%), Remy’s Ratatouille Adventure (18%), Living with the Land (11%)
- Hollywood Studios: Rock’n’Roller Coaster (45%), Rise of the Resistance (25%), Slinky Dog Dash (14%)
- Animal Kingdom: No rope drop issues!
Ugly week again for rope drop touring. Even Peter Pan’s Flight, my go-to reliable rope drop option, had its share of issues this week. Only Frozen and Cosmic Rewind at EPCOT stayed good rope drop options. And three headliners at Hollywood Studios that draw guest to different corners of that park at the beginning of the day all had problems.
Thank you to Animal Kingdom for being our reliable rope drop queen.
Wait Times August 19 – 25
Attractions with the Highest Average Posted Wait at Each Park
- EPCOT: Test Track, average posted wait of 79 minutes (was 72 minutes last week)
- Hollywood Studios: Slinky Dog Dash, average posted wait of 60 minutes (was 63 minutes last week)
- Animal Kingdom: Flight of Passage, average posted wait time of 60 minutes (was 63 minutes last week)
- Magic Kingdom: TRON, average posted wait time of 59 minutes (was 59 minutes last week)
Three of our highest in-park posted waits were an hour or less. That’s crazy talk, and very good news for anyone touring the parks this past week! EPCOT once again came in with the top two posted waits overall, with Cosmic Rewind averaging a posted wait of 61 minutes. So while EPCOT in general is a breeze when a festival isn’t running, the Test Track/Cosmic Rewind combo is a tricky one to get right and not have a long wait at one or both.
Parks with the Highest and Lowest Average Wait
These parks likely won’t change week-to-week unless something ridiculous happens, but these data points will give us a high-level view of how wait times are trending from week to week.
- Highest: Hollywood Studios, average park-wide posted wait of 33 minutes (was 31.5 minutes at Animal Kingdom last week)
- Lowest: Magic Kingdom, average park-wide posted wait of 20 minutes (was 19 minutes last week)
Hollywood Studios and Animal Kingdom now keep trading back and forth for park with the highest wait time, mostly based on which park has more overall downtime that pushes the wait times up a little. I think Hollywood Studios also “catches” more visitors on Magic Kingdom party days, and so that’s increasing its wait times a little overall across the week.
Most Inflated Posted Wait Times
We all know that Disney inflates their posted wait times on purpose. They have many reasons for doing this. Some are totally understandable, and some are potentially more problematic. We can figure out how much posted wait times are being inflated by comparing submitted actual wait times from the Lines App and the posted wait time when the person timing their wait entered the line.
Over the past week, actual wait times in the Lines App averaged 70% of what was posted. That’s above our historical average, which means that posted wait times were more accurate than normal this week. Hooray! Overall, if the posted wait time at a popular attraction was 60 minutes, you could’ve expected to wait just 42 minutes instead.
But the worst inflation offender for the past week was Mad Tea Party. At this one attraction, submitted actual wait times were only 27% of posted wait times in the past week. That means that if Mad Tea Party had a 15 minute posted wait, you probably would have actually only waited just about 4 minutes instead. Less than a third of what was posted! Remember to always check the Lines app for predicted actual waits instead of making decisions based on what is posted.

This Week’s Wait Time Rock Star
Between August 19th and 25th, we had just over 1500 timed actual waits submitted through the Lines app. The one person who recorded the most actual waits during that time was dqjamie99, with 39 overall timed waits – 36 standby waits and 3 single rider waits. Thanks for all of that timing, dqjamie99! It unfortunately does not compete with the the 97 timed waits in a single week from our current timing champion, preef.
Looking Ahead: August 26 – September 1
I write this article on Tuesday evenings so that you all have the very freshest of data on Wednesdays. That means the 19th will already be in the past by the time you’ve read this, so welcome back to the future!
By the time this article posts on Wednesday, I’ll already be down in Orlando for the opening of Food & Wine Festival! I’ve got a few fun things planned for this trip:
- Haircut at Grand Floridian Spa
- Dinner at the new Bourbon Steak Orlando (which replaced Shula’s)
- ALL of the food and drinks for Food & Wine with my Main St Dish podcast friends
- Hopefully seeing Starlight Parade for the first time
- The very first reservation of opening day at The Beak and Barrel – the new Pirates lounge at Magic Kingdom
If you want to follow along, head over to my Instagram page (@raisingminniemes) where I’ll be sharing all of my adventures and thoughts throughout my trip.
If you’re going to be in Walt Disney World this upcoming week too, here’s what we have to look forward to! Food & Wine festival ends our Diet EPCOT drought on August 28th. From that point on, expect plenty of EPCOT crowds, especially on weekend evenings. The Beak and Barrel then opens on the 29th. We’ve also got D23 this weekend, which brings in a decent number of Disney fans to hear all of the most recent news and announcements. But they’ll be in the panels and presentations, so I don’t expect that to translate to much higher wait times in the parks.
The only two Halloween parties this week are on the 26th and 29th. That means that Magic Kingdom guests should be able to spread out on the rest of the days and not create terrible spikes on non-party days.
Labor Day is on September 1st, so there may be an increase in local visitors over the long weekend. But the week after Labor Day is typically very empty, I don’t think it’ll be a large or lengthy bump in wait times.
Wednesday and Thursday look clear and hot, but after that there should be a return of afternoon thunderstorms and slightly more reasonable temperatures.
Were you in the parks this past week? Or are you headed to Orlando soon? Let me know in the comments below!
You May Also Like...
-

Well, that Starlight Summer Surge was ... brief. It fizzled fast, and now we’re solidly in empty August territory. Blame school…
-

We’re still coasting through the calm of August, and if you can handle the triple-digit feels-like temps, this is prime park…
Has there every been a 100% A+ week as long as touringplans has been tracking their predictions?
Great job by the data team!