Disney Data Dump August 6 2025
Well, that Starlight Summer Surge was … brief. It fizzled fast, and now we’re solidly in empty August territory. Blame school start dates. Blame reduced international travel. Blame the return of pumpkin spice if you want. Has pumpkin spice returned already? I admittedly am not cool enough to keep track. Either way, wait times are down again, and Magic Kingdom is still the quietest park on property, unless you’re trying to find a spot for the new parade. But Diet EPCOT is giving it a run for its money. Let’s dig into the trends as we slide toward spooky season.
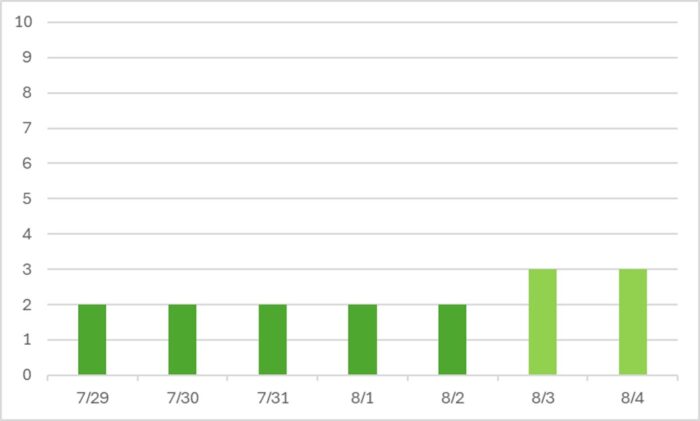
Observed Crowd Levels July 29 – August 4

Well …. maybe whatever summer surge existed has now passed. This isn’t surprising. We’re now in August, when a lot of schools across the country are starting up the new year. Typically any August crowds that do exist are mostly made up of international visitors. But since international travel is down right now, this might be an especially empty end of summer.

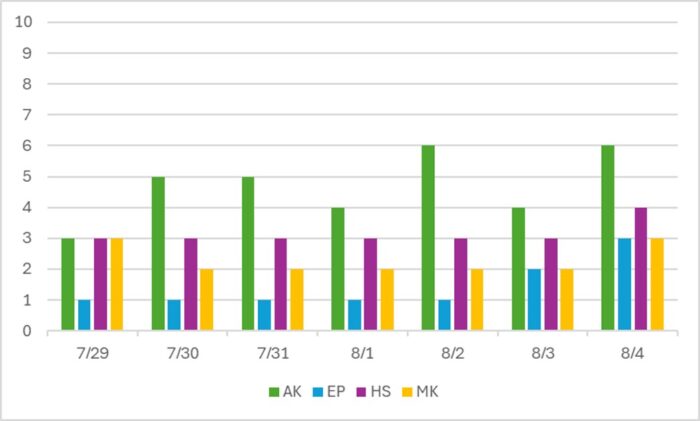
There are a couple of interesting trends at the park-level from the past week. The first is Diet EPCOT fully living up to its name, even with the re-opening of Test Track. EPCOT with a festival was actually one of the two most crowded parks during the first half of the year, with crowd levels regularly up in the 5-6 range. But without a festival, wait times have plummeted (other at Test Track, obviously). The second is that Animal Kingdom continues to stay crowded compared to every other park. That’s not necessarily because it’s so popular. It’s mostly due to the low number of attractions there, plus some weather and downtime issues. Finally, it’s important to re-emphasize that low crowd levels at Magic Kingdom don’t mean that you can just stroll up and get a spot for the new parade at night. The park isn’t crowded during the day, but the new parade is still very popular and you’ll want to arrive early to see it.
Performance of Crowd Level Predictions
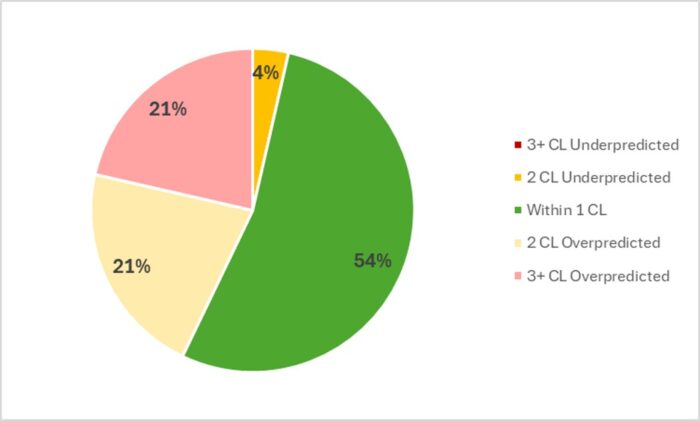
Each week, I give you a very transparent look into how the TouringPlans crowd level predictions performed. Each day at each park is one data point, so each week we have 28 different crowd level predictions to evaluate. Any time a prediction is within one or two crowd levels, things won’t really “feel” much different than what was predicted. Being off by 3 or more crowd levels is where you might feel that difference in wait times throughout the day.

In the past week, Touring Plans predictions were either spot-on or within 1 crowd level 54% of the time, which is the highest number we’ve seen all year! 79% of the time Touring Plans predictions were within 2 crowd levels, so that means we get a C+ for our predictions in the past week. Again, that’s much higher than the average result for the year. AND. Hold onto your hats. One of the misses was an under-prediction. That hasn’t happened … all year? Maybe? I’d have to go back and check. But under-predictions have been incredibly rare this year. Still, on average, the crowd level at any park any day of the week was about 1.5 crowd levels below prediction. That’s within our “feels roughly the same” margin overall, and it’s only the second time it’s been less than 2 crowd levels all year. The biggest miss of the week was an overprediction by 5 crowd levels, which happened at EPCOT on the 29th and 31st.
Attraction Downtime July 29 – August 4
If we average all of the capacity lost due to unexpected downtime over the past week, it comes out to 4.3% of attractions unexpectedly being down. That’s back down from last week, closer to our historical average. In the past week, Animal Kingdom was once again the park with the most overall downtime, averaging 7.3% of its capacity lost to downtime throughout the week. Last week it was down for over 10% of the week, so we’re seeing some improvement … but that’s still very impactful at a park with relatively few attractions to absorb crowds.
The worst day for attraction downtime in the past week was on July 31st. On that day, 6% of all capacity at WDW was lost due to unexpected downtime. The worst park-day of the week was a nice predictable combination of the worst day and worst park – July 31st at Animal Kingdom. On that day, 20% of attraction capacity was lost due to unexpected downtime. Animal Kingdom was open for 10 hours on the 31st, so 20% downtime is the equivalent of the entire park shutting down for 120 minutes. Out of a 600 minute day. If the park randomly closed 2 hours early, or opened 2 hours late, everyone would be up in arms. But this is essentially the same thing happening, spread throughout the day.
Attraction Downtime Worst Offender
In the past week, Expedition Everest was again the WDW attraction with the worst overall downtime. It was unexpectedly down for 20% of the past week. It was down 31% of the previous week, so things are improving … but not by enough. And it definitely contributed to the overall downtime woes at Animal Kingdom this week. The worst day at Everest was on July 30th, when the attraction was down for 64% of the day. It didn’t open until almost 4 pm. But it had significant issues on a couple of other days too.

Rope Drop Downtime
Here are problematic offenders from the past week, with the percentage of downtime during the first hour of the day in parentheses:
- Magic Kingdom: Tiana’s Bayou Adventure (27%), Under the Sea (24%), Seven Dwarfs Mine Train (23%), Winnie the Pooh (15%), Mickey’s PhilharMagic (14%), Pirates of the Caribbean (14%)
- EPCOT: Frozen Ever After (29%), Living with the Land (14%)
- Hollywood Studios: Rock’n’Roller Coaster (39%), Tower of Terror (13%), Runaway Railway (11%), Star Tours (10%)
- Animal Kingdom: Expedition Everest (30%), Kali River Rapids (14%)
Last week was a historically awful rope drop week. This week wasn’t much better! The good news is that Frozen Ever After is the only EPCOT headliner that repeated on the list this week. And that Rise of the Resistance and Slinky Dog Dash both dropped off the list this week too.
But otherwise, we’ve still got a lot of attractions with a lot of early morning downtime, making rope drop difficult to plan and approach efficiently.
Wait Times July 29 – August 4
Attractions with the Highest Average Posted Wait at Each Park
- Hollywood Studios: Rise of the Resistance, average posted wait of 96 minutes (was 100 minutes last week)
- EPCOT: Test Track, average posted wait of 77 minutes (was 90 minutes last week)
- Animal Kingdom: Flight of Passage, average posted wait time of 69 minutes (was 74 minutes last week)
- Magic Kingdom: TRON, average posted wait time of 68 minutes (was 67 minutes last week)
Our two newcomers to the list last week are back on top this week. But at least they both saw decreases in their average posted wait time. In Test Track’s case, it was a significant decrease! In fact, Tron is the only headliner at any park that saw an increase in wait time compared to the previous week.
Parks with the Highest and Lowest Average Wait
These parks likely won’t change week-to-week unless something ridiculous happens, but these data points will give us a high-level view of how wait times are trending from week to week.
- Highest: Hollywood Studios, average park-wide posted wait of 36 minutes (was 38 minutes last week)
- Lowest: Magic Kingdom, average park-wide posted wait of 20 minutes (was 22 minutes last week)
Not much changed at a park level compared to last week. Every park was a couple of minutes lower, which matches the lower crowd levels that we saw at the top of the post.
Most Inflated Posted Wait Times
We all know that Disney inflates their posted wait times on purpose. They have many reasons for doing this. Some are totally understandable, and some are potentially more problematic. We can figure out how much posted wait times are being inflated by comparing submitted actual wait times from the Lines App and the posted wait time when the person timing their wait entered the line.
Over the past week, actual wait times in the Lines App averaged 69% of what was posted. That’s very close to our historical average. Overall, if the posted wait time at a popular attraction was 60 minutes, you could’ve expected to wait just over 41 minutes instead.
But the worst inflation offender for the past week was Gran Fiesta Tour. At this one attraction, submitted actual wait times were only 32% of posted wait times in the past week. That means that if Gran Fiesta Tour had a 15 minute posted wait, you probably would have actually only waited less than 5 minutes instead. Less than a third of what was posted. Remember to always check the Lines app for predicted actual waits instead of making decisions based on what is posted.

This Week’s Wait Time Rock Star
Between July 29th and August 4th, we had over 1200 timed actual waits submitted through the Lines app. The one person who recorded the most actual waits during that time was MrsFredricksen), with 35 overall timed waits – 19 standby waits and 16 Lightning Lane waits. Thanks for all of that timing, MrsFredricksen! It unfortunately does not compete with the the 97 timed waits in a single week from our current timing champion, preef.
Looking Ahead: August 5 – 11
I write this article on Tuesday evenings so that you all have the very freshest of data on Wednesdays. That means the 5th will already be in the past by the time you’ve read this, so welcome back to the future!
Once again, there is nothing remarkable happening over the next week at Walt Disney World. We’re almost to Halloween season, which kicks off on August 15th at Magic Kingdom. Then we’ll start seeing more of a roller coaster of crowd levels at that park. But for now, park hours are standard, and crowd levels should remain pretty steady. I expect EPCOT, especially, to keep those nice low crowds until Food & Wine kicks off at the end of the month.
This upcoming week looks especially stormy. So if you’re going to be in the parks, make sure you prioritize outdoor attractions in the morning before the weather rolls in and shuts things down. And be especially careful during your Animal Kingdom day, when storms force almost everyone into shows or just a couple of indoor attractions.
Were you in the parks this past week? Or are you headed to Orlando soon? Let me know in the comments below!


