Disney Data Dump December 24 2025
’Twas the week before Christmas, and all through the World,
not a crowd was yet stirring — few strollers unfurled.
The parks were still calm, in that December sweet spot,
where decorations sparkle but waits… mostly do not.
But look closely at the data and you can see it coming: school calendars wrapping up for the year, more families arriving each day, and the quiet beginnings of the most intense travel stretch of the year. This is the calm before the Christmas crush. Let’s take a look at what actually happened in the parks over the past two weeks, and what it tells us about where we’re headed next.
Observed Crowd Levels December 9 – 22
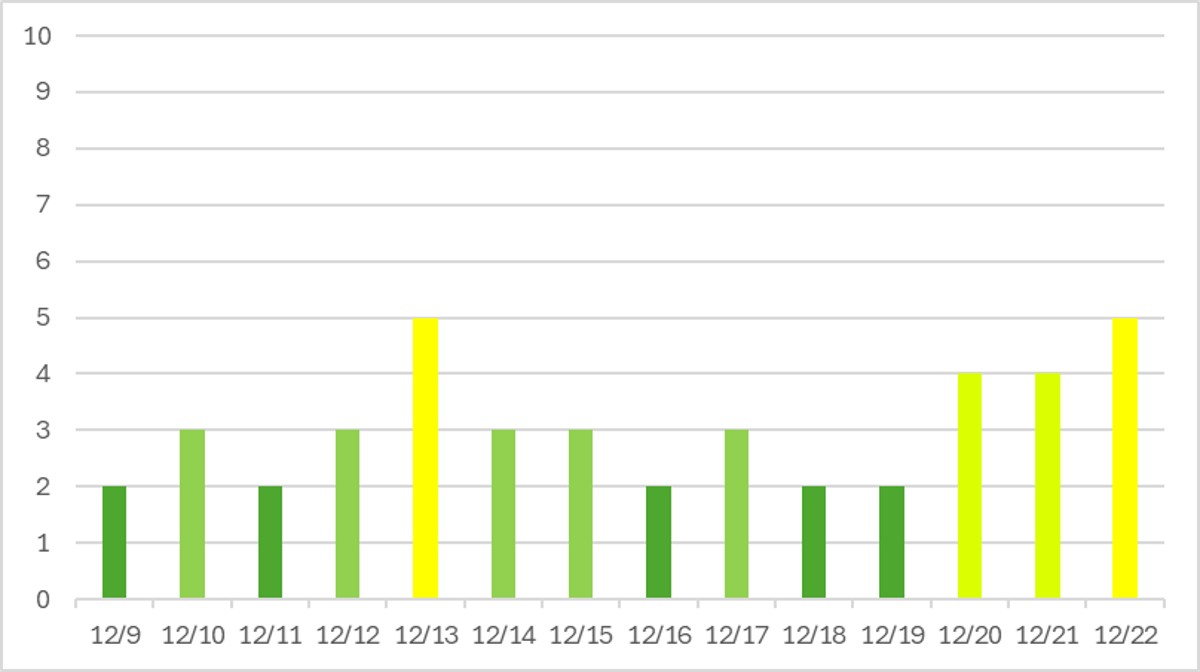
Those post-Christmas crowds … they’re coming. They’re not here yet though! As predicted, things stayed pretty “moderate” (and moderate for 2025 really means low) through mid-December. But once most school districts got out on December 19th, families started heading to Florida. Expect those bars to keep creeping up through the end of the year.
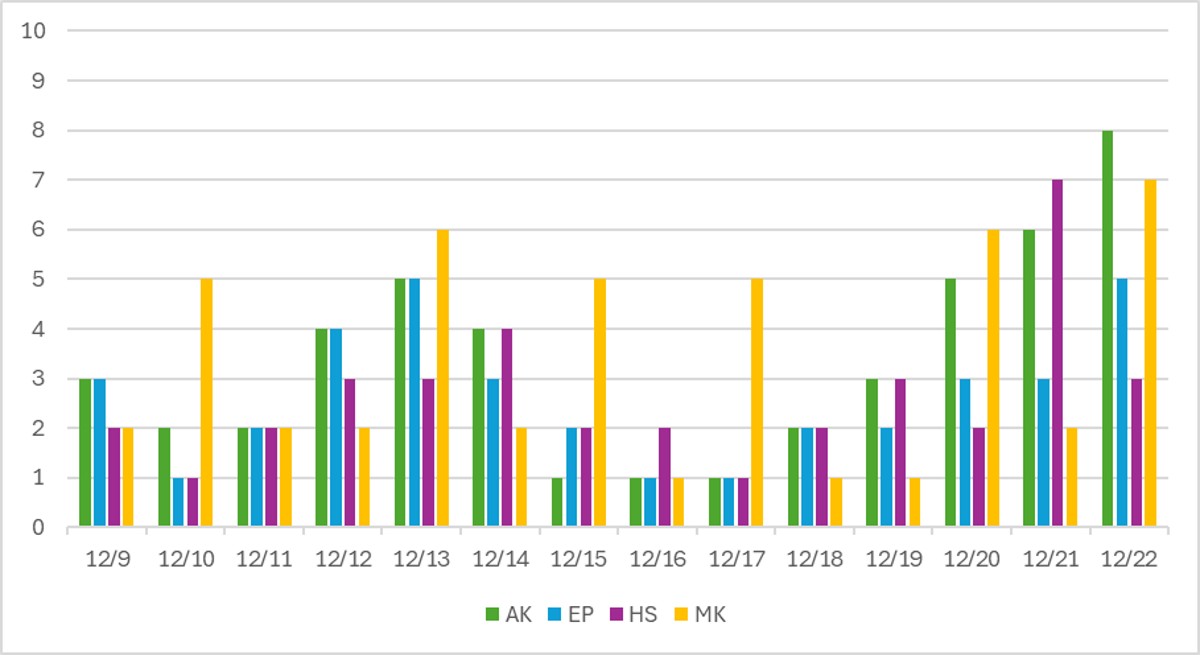
This chart is really busy when we’re covering two weeks of data. But we’ve got a couple of clear overall trends. First, the 15th through the 18th was a great time to be in the parks – other than locals trying to get in some last visits for the year before most APs are blocked out, the parks were very empty. The 9th through 11th wasn’t bad either.
And then we can play our favorite weekly game one last time this year – guess the party dates! This week it should be really obvious for those gold bars at Magic Kingdom. Parties were on the 8th, 11th, 12th, 14th, 16th, 18th, 19th, and 21st. That led to big crowd spikes on the 10th , 13th, 15th, and 17th even though surrounding dates were very uncrowded otherwise.
For our purple bars, the Jollywood Nights dates were on the 13th, 17th, 20th, and 22nd. The only BIG impact from that schedule was on the 21st, when Hollywood Studios saw its biggest crowds for months and months.
The one other interesting note here is that Animal Kingdom is staying more crowded than EPCOT, relatively speaking. Its wait times are high, while EPCOT is staying much lower than we normally see it this late in December.
Performance of Crowd Level Predictions
Each week, I give you a very transparent look into how the TouringPlans crowd level predictions performed. Each day at each park is one data point, so each week we have 28 different crowd level predictions to evaluate. Any time a prediction is within one or two crowd levels, things won’t really “feel” much different than what was predicted. Being off by 3 or more crowd levels is where you might feel that difference in wait times throughout the day.

In the past two weeks, Touring Plans predictions were either spot-on or within 1 crowd level 50% of the time, which is slightly worse than the past month or so. And then 75% of the time Touring Plans predictions were within 2 crowd levels, so that means we get a C for our predictions in the past two weeks, which is pretty in line with what we’ve been seeing this winter. On average, any park on any day of the past two weeks was about 1.5 crowd levels less crowded than what was predicted. Pretty par for the course in 2025. The biggest miss of the week was an overprediction by SIX crowd levels, which happened at EPCOT on December 16th. EPCOT was predicted to be a crowd level 7 that day, but only ended up being a 1. In fact, EPCOT had all six of the biggest misses this week – three overpredictions by 4 crowd levels, two overpredictions by 5 crowd levels, and that one six-level miss. From December 15th through 22nd, EPCOT averaged FOUR crowd levels lower than predicted, every day. That’s crazy.
Attraction Downtime December 9 – 22
If we average all of the capacity lost due to unexpected downtime over the past two weeks, it comes out to 4.0% of attractions unexpectedly being down. That’s pretty similar to our historical average, but higher than what we’ve seen for the past month or so. In the past two weeks, Animal Kingdom was the park with the most overall downtime, averaging 6.1% of its capacity lost to downtime throughout that period. Not great for the park with the fewest attractions – what’s there needs to be reliable!
The worst day for attraction downtime in the past two weeks was on December 14th. On that day, 8% of all capacity at WDW was lost due to unexpected downtime. And the worst park-day was a predictable combination of our worst day and worst park – Animal Kingdom on December 14th. On that day, 18% of Animal Kingdom’s attraction capacity was lost due to unexpected downtime. Animal Kingdom was open for 11 hours on the 14th, so 18% downtime is the equivalent of the entire park shutting down for almost exactly two hours. Two Hours! No thank you.
Attraction Downtime Worst Offender
In the past two weeks, Kali River Rapids was the WDW attraction with the worst overall unplanned downtime. (We finally broke the streak of Winnie the Pooh!) It was unexpectedly down for 17% of the past week. That’s almost double the downtime of the next-worst attraction, which happens to be Slinky Dog Dash this week, where there was 9% unexpected downtime. The worst day at Kali River Rapids over the last two weeks was easily on December 14th, when it was down for 88% of the day.

Rope Drop Downtime
Here are problematic offenders from the past two weeks, with the percentage of downtime during the first hour of the day in parentheses:
- Magic Kingdom: Tiana’s Bayou Adventure (24%), The Many Adventures of Winnie the Pooh (16%), Pirates of the Caribbean (10%)
- EPCOT: Spaceship Earth (22%), Test Track (18%), Remy’s Ratatouille Adventure (17%), Living with the Land (17%), The Seas with Nemo (11%)
- Hollywood Studios: Slinky Dog Dash (20%), Runaway Railway (10%)
- Animal Kingdom: Kali River Rapids (41%), Dinosaur (13%), Expedition Everest (13%)
No gold stars again this week, thanks to a rare BAD two weeks at Animal Kingdom.
Hollywood Studios only had a few rope drop issues, but Slinky having 20% rope drop downtime over the course of two weeks is a big deal. That messes up a lot of early morning plans for a lot of people.
Spaceship Earth pops back on the list at EPCOT. It’s not a big rope drop draw, but it does point to continued instability even after a lengthy refurbishment.
Wait Times December 9 – 22
Attractions with the Highest Average Posted Wait at Each Park December 9-15
- EPCOT: Cosmic Rewind, average posted wait of 67 minutes (was 65 minutes at Test Track the week before)
- Magic Kingdom: TRON, average posted wait time of 52 minutes (was 47 minutes the week before)
- Hollywood Studios: Slinky Dog Dash, average posted wait of 52 minutes (was 54 minutes the week before)
- Animal Kingdom: Flight of Passage, average posted wait time of 51 minutes (was 49 minutes the week before)
What these numbers hide is the fact that EPCOT had all three of the top overall posted waits (Cosmic Rewind at 67 minutes, Test Track at 66 minutes, and Remy at 53 minutes). Otherwise, waits were manageable everywhere (including at EPCOT’s other attractions).
Attractions with the Highest Average Posted Wait at Each Park December 16-22
- EPCOT: Cosmic Rewind, average posted wait of 76 minutes (was 67 minutes last week)
- Animal Kingdom: Flight of Passage, average posted wait time of 65 minutes (was 51 minutes last week)
- Magic Kingdom: TRON, average posted wait time of 63 minutes (was 52 minutes last week)
- Hollywood Studios: Slinky Dog Dash, average posted wait of 60 minutes (was 52 minutes last week)
Here’s where we can clearly see the impact of schools finishing up for the year and families starting to head to Orlando.
Parks with the Highest and Lowest Average Wait December 9-15
- Highest: EPCOT, average park-wide posted wait of 31.5 minutes (was 31.5 minutes at Hollywood Studios the week before)
- Lowest: Magic Kingdom, average park-wide posted wait of 19.5 minutes (was 19 minutes the week before)
It’s a rare week for EPCOT to have the highest average park-wide wait. Usually it’s Hollywood Studios, and occasionally Animal Kingdom will sneak into the top spot. But those top three attractions had a big impact this week.
Parks with the Highest and Lowest Average Wait December 16-22
- Highest: Hollywood Studios, average park-wide posted wait of 34 minutes (was 31.5 minutes at EPCOT last week)
- Lowest: Magic Kingdom, average park-wide posted wait of 21 minutes (was 19 minutes last week)
Ah, things are back the way they should be. Overall wait times are creeping upward, and Hollywood Studios is back on top, even with some Jollywood Nights dates dragging average wait times down.
Most Inflated Posted Wait Times
We all know that Disney inflates their posted wait times on purpose. They have many reasons for doing this. Some are totally understandable, and some are potentially more problematic. We can figure out how much posted wait times are being inflated by comparing submitted actual wait times from the Lines App and the posted wait time when the person timing their wait entered the line.
Over the past two weeks, actual wait times in the Lines App averaged 70% of what was posted. That’s close to our LLMP historical average. Overall, if the posted wait time at a popular attraction was 60 minutes, you could’ve expected to wait about 42 minutes instead.
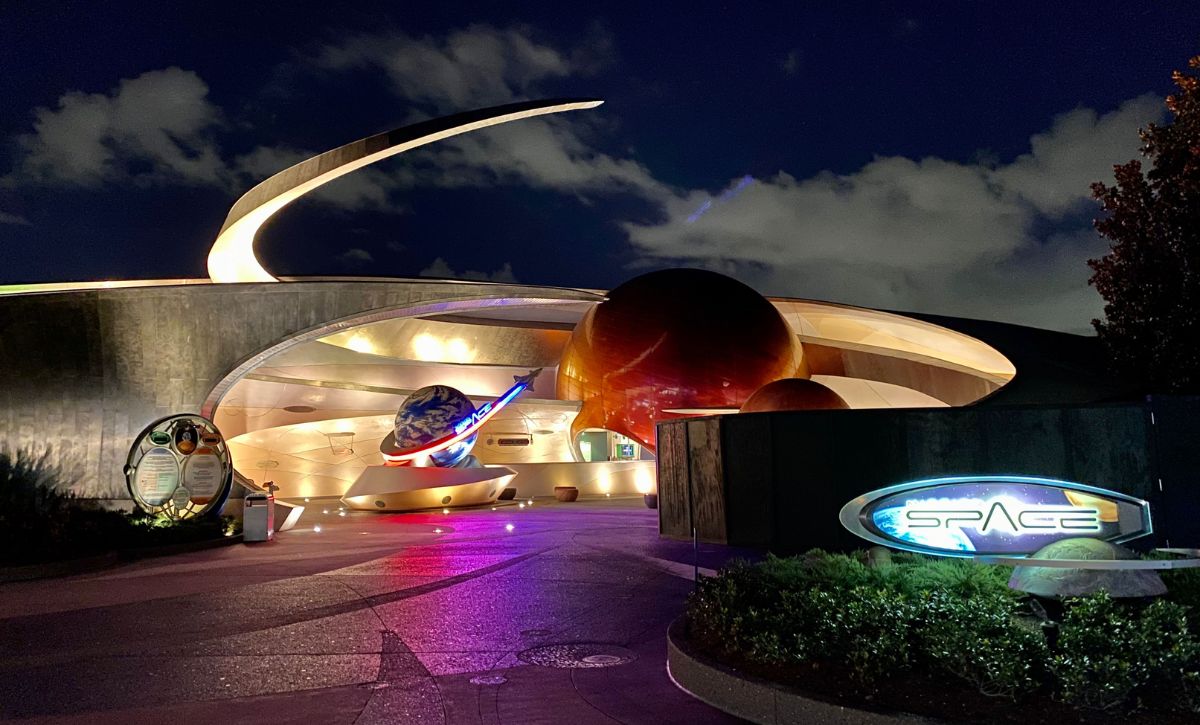
But the worst inflation offender for the past two weeks was Mission: Space. At this one attraction, submitted actual wait times were only 25% of posted wait times in the past week. That means that if Mission: Space had a 30 minute posted wait, you probably would have actually only waited 7.5 minutes instead. A quarter of what was posted! Remember to always check the Lines app for predicted actual waits instead of making decisions based on what is posted.
This Week’s Wait Time Rock Star
Between December 9th and 15th, we had just under 1500 timed actual waits submitted through the Lines app. The one person who recorded the most actual waits during that time was QueenofHearts, with 27 overall timed waits – 17 Lightning Lane waits, 7 standby waits, and 3 single rider waits. Thanks for all of that timing, QueenofHearts! It unfortunately does not compete with the the 97 timed waits in a single week from our current timing champion, preef.
Between December 16th and 22nd, we had just under 1000 timed actual waits submitted through the Lines app. The one person who recorded the most actual waits during that time was ortegame, with 25 overall timed waits – 3 Lightning Lane waits and 25 standby waits. Thanks for all of that timing, ortegame! It unfortunately does not compete with the the 97 timed waits in a single week from our current timing champion, preef.
Looking Ahead: December 24 – 30
I write this article on Tuesday evenings so that you all have the very freshest of data on Wednesdays. That means the 24th will already be in the past by the time you’ve read this, so you’re basically the ghost of Christmas future!
First big bit of news is that we have no more party dates to consider. We’ve made it! We’re back to the land of other crowd behavior drivers, and not our predictable party day/non-party day cadence.
Otherwise, this stretch of 7 days should be the most crowded of the year. We’re already seeing families start to arrive to Orlando, but the biggest wave of crowds usually doesn’t descend until after Christmas and before New Years. Everything will be crowded everywhere. Pack your patience.
It looks like a GORGEOUS week in Orlando – sunny with highs right around 80 for most of the week. One heads-up: temperatures are supposed to drop off a cliff on the night of the 29th, with lows in the mid 30s and a high only in the mid-50s on the 30th. So if you’re staying through NYE or longer, make sure to bring some layers so you don’t have to pay for an overpriced sweatshirt (or four).
I hope you all have a happy holiday season! Lots of you reached out with well wishes after I mentioned my surgery last week. Thank you for that! I have a great new scar above my right eyebrow up to my hairline which means I’m very Harry Potter chic now. Might have to cover more Universal in the future 😉
Were you in the parks this past week? Or are you headed to Orlando soon? Let me know in the comments below!
You May Also Like...
-

Early December really said, “Here, have everything you love … but without the lines.” Holiday decorations? Everywhere. Special treats and entertainment?…
-

It’s officially that fun little in-between season at Walt Disney World! The brief window after Thanksgiving crowds head home, but before…
As Universal becomes more of a primary destination, would you consider doing Universal data dumps?
Unfortunately, I don’t have enough time to branch out beyond my WDW posts and the book, but I’ll pass along the idea to others!