Disney Data Dump February 11 2026
And we’re back!! If you’re a weekly Disney Data Dump reader, I apologize for the interlude while we went through all of our crowd calendar retrospectives to kick off the year. If you’re new around here, hooray! It’s a good time to start paying attention to Disney data to help plan your upcoming Walt Disney World trip. As always, we’ll look at crowd levels from the past week, attraction downtime trends, and posted and actual wait time data. Then I’ll give you a peek into what to expect next week. Let’s see what that Disney data says today!
Observed Crowd Levels February 3 – 9
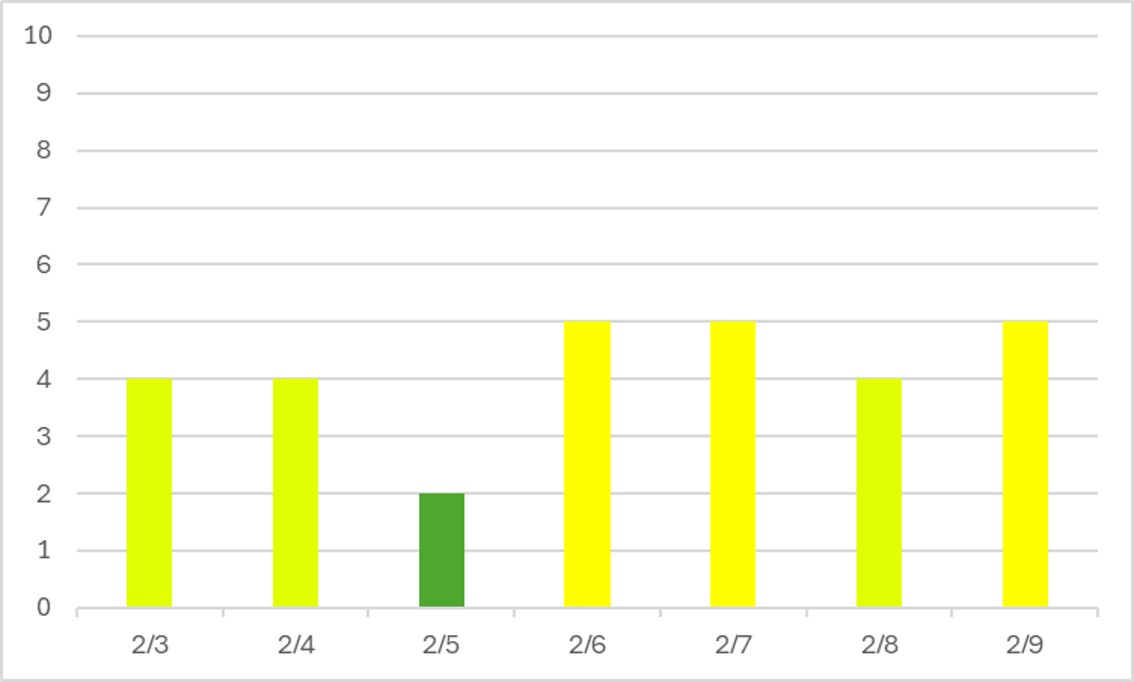
I’ve heard from a lot of people that the parks feel crowded this February. And they are – February is one of the most crowded months of the year (usually only behind December and January). But statistically, wait times don’t come close to touching those peak days. In fact, they’re just average. Walking spaces will still be crowded. People will get spots early for parades and fireworks. But wait times aren’t unreasonable.
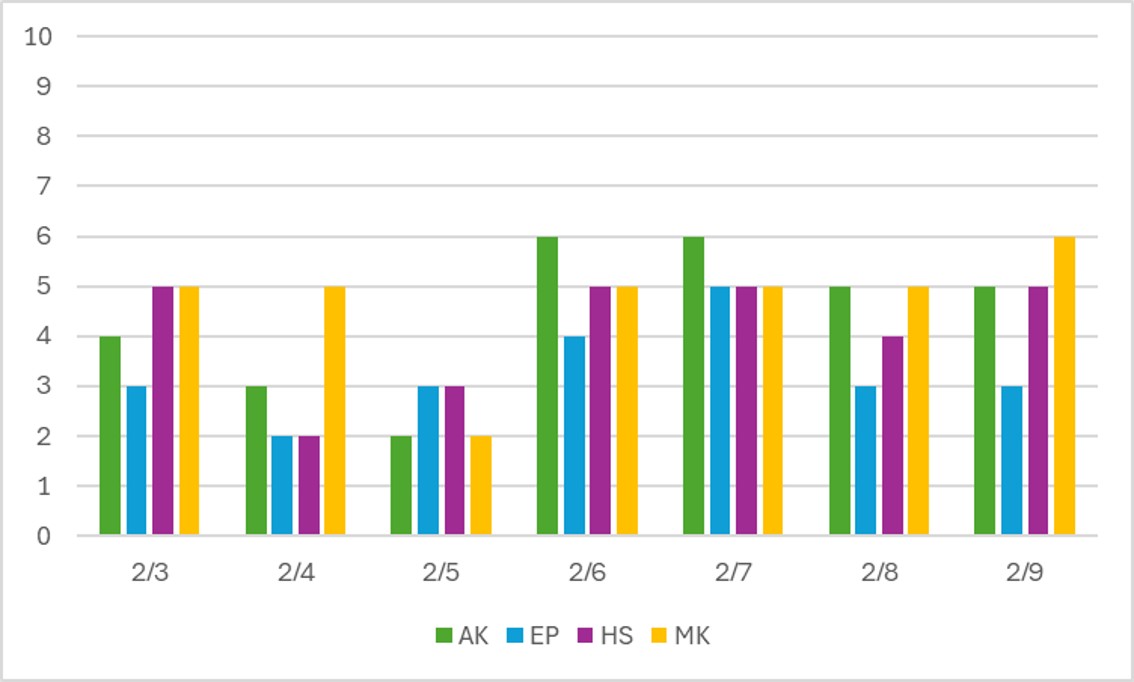
Nothing particularly exciting to see at the park level here, but let’s look at a couple of trends. Animal Kingdom is the park that struggles the most to absorb crowds. That’s thanks the rock bottom number of attractions and ways to spend your time. That’s going to be especially true from late February through the summer, when the Wildlife Express Train and Conservation Station close to make way for the arrival of Bluey and Bingo. All of Dinoland is also closed. So when more people head to the park, wait times at any open attractions skyrocket quickly. We see that in the difference between 2/5 and 2/6 in the chart above. We also see that while EPCOT is popular during Festival of the Arts, that doesn’t have a big impact on wait times until the weekend when there are SO many people visiting the park that wait times finally pop above the 2-3 level.
Performance of Crowd Level Predictions
Each week, I give you a very transparent look into how the TouringPlans crowd level predictions performed. Each day at each park is one data point, so each week we have 28 different crowd level predictions to evaluate. Any time a prediction is within one or two crowd levels, things won’t really “feel” much different than what was predicted. Being off by 3 or more crowd levels is where you might feel that difference in wait times throughout the day.
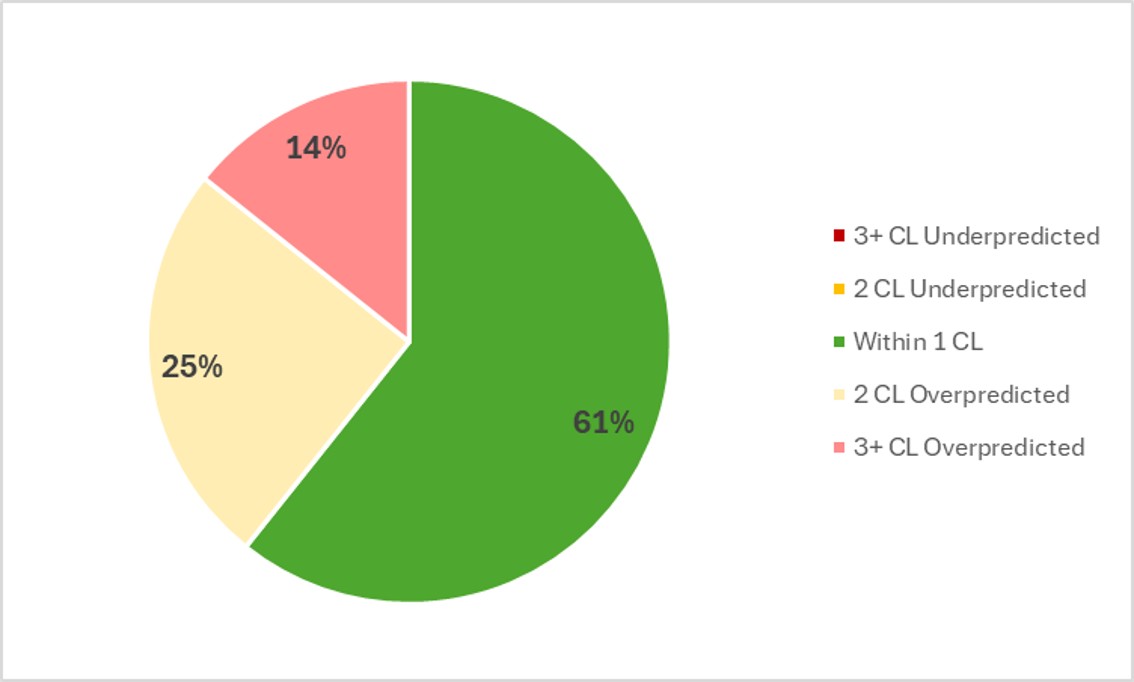
In the past week, Touring Plans predictions were either spot-on or within 1 crowd level 61% of the time, which is better than we’ve done since late last fall. And then 86% of the time Touring Plans predictions were within 2 crowd levels, so that means we get a B for our predictions in the past week, which is also better than our average last year. We are skewed in our prediction results this week – every miss was an overprediction (even within 1 crowd level). On average, every park every day of the week was 1.4 crowd levels lower than the Touring Plans prediction. The biggest miss of the week was an overprediction of 4 crowd levels, which happened at Hollywood Studios on the 4th Studios was predicted to see a crowd level 6 that day, but only managed a crowd level 2.
Attraction Downtime February 3 – 9
If we average all of the capacity lost due to unexpected downtime over the past week, it comes out to 5.4% of attractions unexpectedly being down. That’s definitely above our historical average, which tends to happen in the winter. In the past week, Magic Kingdom was the park with the most overall downtime (by far), averaging 6.7% of its capacity lost to downtime throughout that period. No other park was above 4.5% downtime.
The worst day for attraction downtime in the past week was on February 9th. On that day, 9% of all capacity at WDW was lost due to unexpected downtime. That’s a particularly bad day compared to all of the other bad days that have “won” this in the past. And the worst park-day was a nice, predictable combination of our worst park and worst day – Magic Kingdom on February 9th. On that day, 14% of Magic Kingdom’s attraction capacity was lost due to unexpected downtime. Magic Kingdom was open for 13 hours on the 9th, so 14% downtime is the equivalent of the entire park shutting down for almost 2 hours that day – about 110 minutes, to be exact. That’s a lot of lost attraction time.
Attraction Downtime Worst Offender
In the past week, Space Mountain was the WDW attraction with the worst overall unplanned downtime. It was unexpectedly down for 27% of the past week. That’s a big downtime number for a big headliner. The worst day at Space Mountain over the last week was easily on February 8th, when it was down for the whole day. And it didn’t come back online until almost noon on the 9th.

Rope Drop Downtime
Here are problematic offenders from the past week, with the percentage of downtime during the first hour of the day in parentheses:
- Magic Kingdom: Country Bear Jamboree (34%), Tiana’s Bayou Adventure (32%), Space Mountain (29%), Pirates of the Caribbean (27%), Winnie the Pooh (26%), Seven Dwarfs Mine Train (26%), TTA PeopleMover (24%), Under the Sea (17%), Haunted Mansion (17%), Monsters Inc Laugh Floor (17%)
- EPCOT: Test Track (47%), Spaceship Earth (21%), Gran Fiesta Tour (12%)
- Hollywood Studios: Rise of the Resistance (40%), Slinky Dog Dash (25%), Rock’n’Roller Coaster (20%), Runaway Railway (19%)
- Animal Kingdom: Kali River Rapids (19%)
Holy terrible week, Magic Kingdom! Ten different attractions had more than 10% downtime during rope drop. There were almost NO good rope drop options other than Peter Pan’s Flight during early entry and Tron and Jungle Cruise at regular park opening.
Elsewhere, the two biggest rope drop downtime numbers hit big headliners – Test Track was down for almost half of its rope drop hours this week, and Rise of the Resistance was right behind at 40%. Those are terrible, horrible, no good, very bad numbers. Officially. If you’re headed to EPCOT or Hollywood Studios in the next week and plan to rope drop either of those attractions, it’s very important to have a backup plan!
Wait Times February 3 – 9
Attractions with the Highest Average Posted Wait at Each Park
- EPCOT: Cosmic Rewind, average posted wait of 83 minutes
- Animal Kingdom: Flight of Passage, average posted wait time of 81 minutes
- Magic Kingdom: TRON, average posted wait time of 77 minutes
- Hollywood Studios: Slinky Dog Dash, average posted wait of 64 minutes
These are decently high wait times. But they’re still nowhere close to what we saw between Christmas and New Years Day. At that time, for example, the average posted wait at Flight of Passage was 160 minutes, not 81. That’s a great picture of why these crowd levels are average. High, but not even close to the highest.
Parks with the Highest and Lowest Average Wait
- Highest: Hollywood Studios, average park-wide posted wait of 38 minutes
- Lowest: Magic Kingdom, average park-wide posted wait of 23 minutes
Again, these are moderate park-wide numbers. They’re not what we saw last summer, when every park had an average below 30 minutes almost every week. But they’re not what we saw at peak, when Animal Kingdom and Hollywood Studios were both right around 60 minutes, and even Magic Kingdom was up at 33 minutes.
Most Inflated Posted Wait Times
We all know that Disney inflates their posted wait times on purpose. They have many reasons for doing this. Some are totally understandable, and some are potentially more problematic. We can figure out how much posted wait times are being inflated by comparing submitted actual wait times from the Lines App and the posted wait time when the person timing their wait entered the line.
Over the past week, actual wait times in the Lines App averaged 72% of what was posted. That’s slightly above our historical average in the era of Lightning Lanes, which means that posted waits are not as inflated as normal! Overall, if the posted wait time at a popular attraction was 60 minutes, you could’ve expected to wait about 43 minutes instead.
But the worst inflation offender for the past two weeks was Mad Tea Party. At this one attraction, submitted actual wait times were only 41% of posted wait times in the past week. That means that if Mad Tea Party had a 10 minute posted wait, you probably would have actually only waited 4 minutes instead. Less than half of what was posted! Remember to always check the Lines app for predicted actual waits instead of making decisions based on what is posted.

This Week’s Wait Time Rock Star
Between February 3rd and 9th, we had just over 1000 timed actual waits submitted through the Lines app. The one person who recorded the most actual waits during that time was Tinkerbellwish, with 36 overall timed waits – 1 Lightning Lane wait and 35 standby waits. Thanks for all of that timing, Tinkerbellwish! It unfortunately does not compete with the the 97 timed waits in a single week from our current timing champion, preef.
Looking Ahead: February 10 – 16
I write this article on Tuesday evenings so that you all have the very freshest of data on Wednesdays. That means the 10th will already be in the past by the time you’ve read this, so you’re time travelling!
We’re headed into one of the most crowded weeks of the year! And it should be an especially exciting (read: crowded) one this year. A lot of schools have President’s Day off. Some take off the Friday before President’s Day too. So we’ve already got a winter long weekend that draws families to Orlando. But this year, Mardi Gras is also on Tuesday the 17th. And a lot of east coast schools will take “Ski Week” the week of President’s Day. That equals a whole lot of families with the ability to head to Walt Disney World. Expect wait times to start picking up on the 14th and 15th and to stay elevated at least through the 17th.
The good news is, the weather should be pretty gorgeous this week (that’s why everyone is travelling now instead of the summer). You’ll still want to pack your rain gear just in case, but temperatures will be moderate and days should be mostly sunny!
Were you in the parks this past week? Or are you headed to Orlando soon? Let me know in the comments below!
You May Also Like...
-

What happens when you combine steamy weather, shorter park hours, and most families being out of school? Apparently, you get another…
-

Most weeks you get some sort of clever intro here. Instead, I'm going to be real with you and say your…
We also learned from Cast Members that Disney is trying out a new wait time system. Because too many people were accusing them of inflating times to sell LLs, last week and this week they are posting the average wait time for the rides, instead of the actual times. We experienced this first hand last week which was so strange because on several occasions the “lesser” ride queues were completely empty but said, 20 minutes and on a few “popular” rides the wait time said 60, but were 70+.
That is a terrible way to show wait times! That’s even worse than the red cards from many years ago!
It doesn’t seem to be working too well since light lane premiere passes are reportedly sold out already at Magic Kingdom for the week of President’s Day.
I’m so happy you’re back! I love the Data Dumps!! So true that the “feels like” and queue times don’t match. We visited the parks twice this week, and while we didn’t wait long for rides, the restaurants and walk areas were absolutely miserable. We talked to a few people here and there; many of them stated that they were northerners “escaping the cold with no intentions of riding rides.” Apparently, they just wanted to be at Disney instead of the snow. We did notice that the majority of the “wanderers” left after the sun went down and the temps dropped, so then the queue times matched the crowd levels.
The annual retrospectives are a nice chance to bride out, but skipping the weekly reports every January creates a blind spot around Marathon Weekend since we could neither look back at that week from the prior year nor see the week leading up to our trip. I know there’s no perfect way to cover 52 weeks AND show the big picture, but wanted to mention this. Maybe it’s possible provide abbreviated weekly info in January, or the retrospectives could be spread out over time?