
Disney Data Dump March 25 2026
Spring Break has officially arrived! And because this edition covers two full weeks, you can really see the Spring Break crowd progression play out in a way that a single week never quite captures. The first few days ease you in, with crowds that feel elevated but manageable. And then, almost without warning, things start stacking(more schools out, more families arriving, more pressure on the parks) and wait times follow right along.
What makes this stretch especially interesting is where that pressure is showing up. One park in particular struggled in a way we haven’t consistently seen this year, another continued a pattern we’ve been watching for weeks, and the parks that usually handle crowds best once again proved why they’re so important during busy seasons.
Let’s take a look at what actually happened over these two weeks, and what it tells us about the rest of Spring Break season.
Observed Crowd Levels March 10 – 23
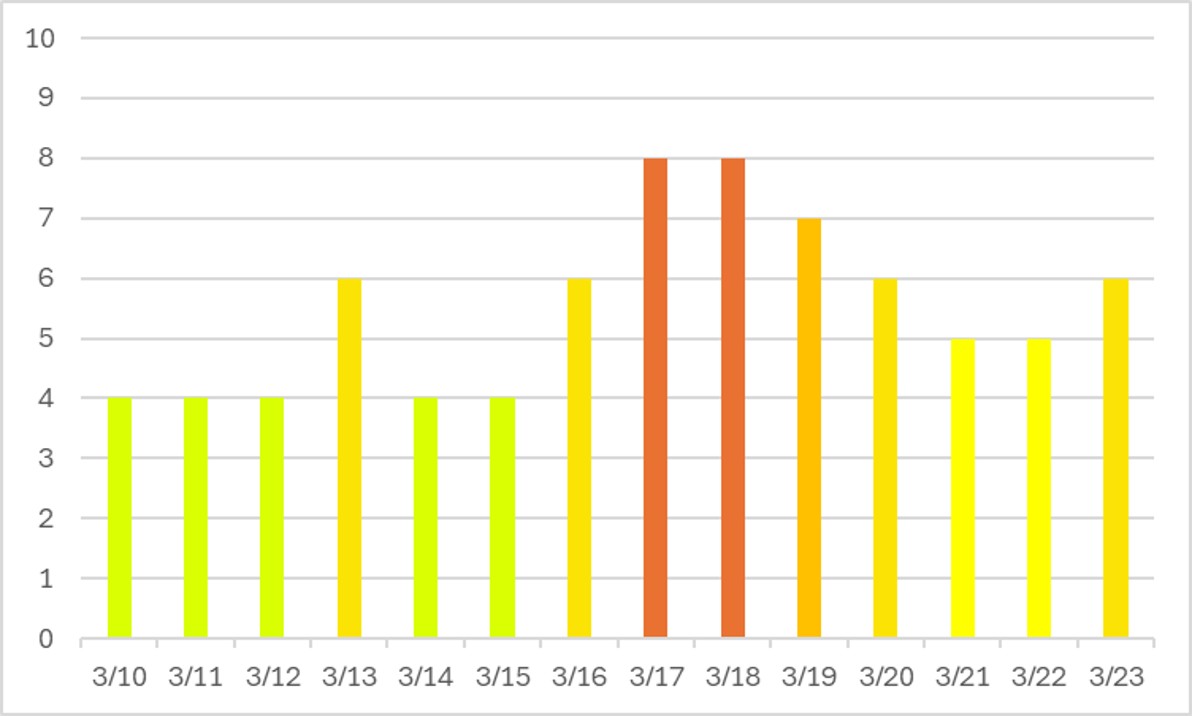
Was this first major week of Spring Break the most crowded week we’ve ever seen at Disney? No. It’s not even the most crowded week of the year. It’s not even the second-most-crowded week of the year. Those crowns go to the week after New Years and the week of Presidents Day and Mardi Gras. Still, crowd level 7 and 8 days are pretty packed!
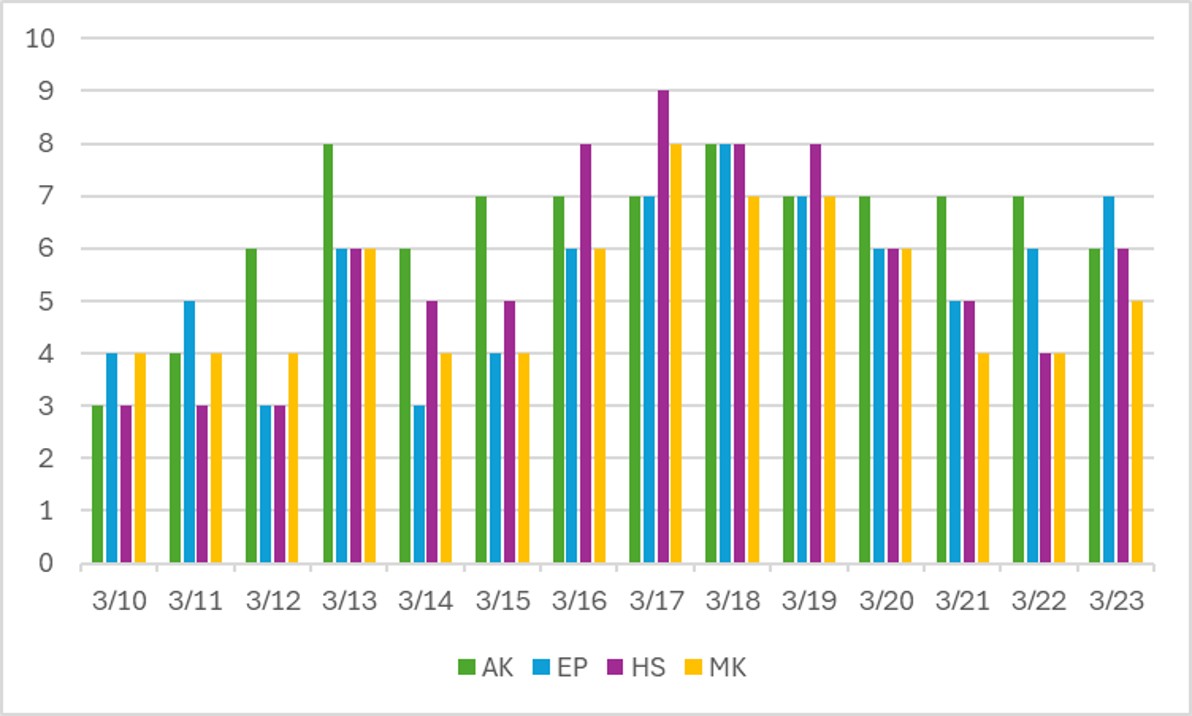
This is a lot of color and information when it covers two weeks, so let’s talk about it! Hollywood Studios is clearly the problem child during Spring Break – which is a little bit surprising. So far this year, Animal Kingdom has been the park that struggles to absorb crowds. Its wait times spike quickly thanks to so few attractions being open. It’s very possible with the closure of Animation Courtyard AND Rock’n’Roller Coaster, Hollywood Studios is now in the exact same situation. It was hanging out at crowd level 3 for a while, and then spiked all the way up to a 9 – the highest crowd level of any park in the past two weeks. There was a stretch of four days where it didn’t ever get below a crowd level 8.
Animal Kingdom looks a little similar. It didn’t spike as high as Hollywood Studios, but it did stay up in the 7-ish crowd level range longer than any other park.
EPCOT and Magic Kingdom, meanwhile, handled their crowds relatively well. Each only hit a crowd level 8 once in the past two weeks.
Performance of Crowd Level Predictions
Each week, I give you a very transparent look into how the TouringPlans crowd level predictions performed. Each day at each park is one data point, so each week we have 28 different crowd level predictions to evaluate. That means this week, we’re looking at 56 data points! Any time a prediction is within one or two crowd levels, things won’t really “feel” much different than what was predicted. Being off by 3 or more crowd levels is where you might feel that difference in wait times throughout the day.
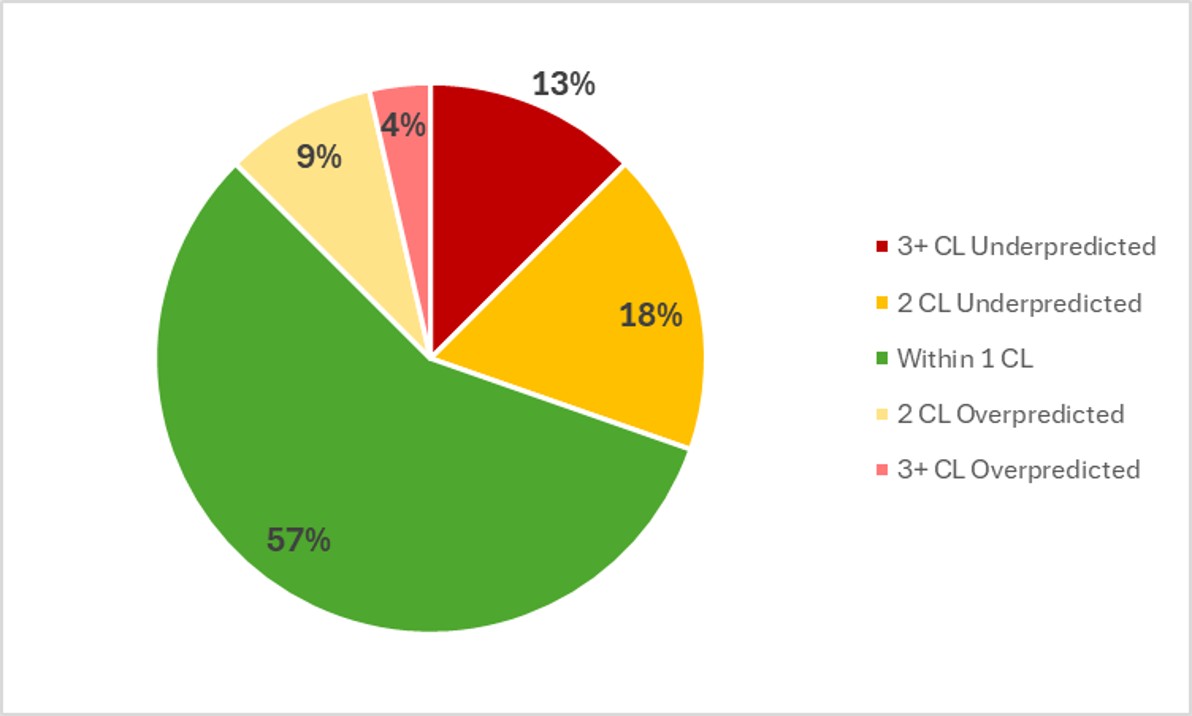
In the past two weeks, Touring Plans predictions were either spot-on or within 1 crowd level 57% of the time, which is lower than our average so far this year. And then 83% of the time Touring Plans predictions were within 2 crowd levels, so that means we get a B for our predictions in the past two weeks. What may have been disappointing to those in the parks in the past two weeks is that a large number of misses were significant under-predictions. That means the parks were more crowded than predicted. After almost a full year of practically only having over-predictions, having more underpredictions is actually a good thing. It means we’re getting more accurate. But ideally we have fewer big misses in either direction. The biggest miss of the week was an under-prediction by 5 crowd levels, and it happened twice – on the 17th and 18th at Hollywood Studios.
Attraction Downtime March 10 – 23
If we average all of the capacity lost due to unexpected downtime over the past two weeks, it comes out to 5.4% of attractions unexpectedly being down. That’s well above our historical average, which is unusual for a crowded season. Usually Disney works pretty hard to keep as much online as possible when crowds are high. In the past two weeks, Animal Kingdom was the park with the most overall downtime, averaging 9% of its capacity lost to downtime. That’s a lot of downtime over a two-week period! It’s like the entire park being closed for more than a full day out of the past two weeks.
The worst day for attraction downtime in the past two weeks was on March 14th. On that day, 9% of all capacity at WDW was lost due to unexpected downtime. But the worst park-day of the past two weeks was a tie – it happened on March 10th AND 16th at Animal Kingdom. Prepare yourselves for this one. Because on both of those days, 22% of attraction capacity at Animal Kingdom was lost due to unexpected downtime. 22%!! Twice!! That’s almost a quarter of capacity for the whole day. Animal Kingdom was open for 10 hours on the 10th, so 22% downtime is the equivalent of the entire park shutting down for 132 minutes. Over 2 hours of the entire park opening late or shutting down early. And Animal Kingdom was open for 11 hours on the 16th, so 22% downtime that day is the equivalent of the entire park shutting down for 145 minutes! Almost 2.5 hours. Out of 11. Ouch.
Attraction Downtime Worst Offender
In the past two weeks, Kali River Rapids was the WDW attraction with the worst overall unplanned downtime. It was unexpectedly down for 25% of the past two weeks. A quarter of the week! The worst day at Kali River Rapids over the last week was on March 10th, when it was down for 76% of the day. But there were plenty of days when it was down at least a third of the day – usually at the beginning and end of park hours.

Rope Drop Downtime
Here are problematic offenders from the past two weeks, with the percentage of downtime during the first hour of the day in parentheses:
- Magic Kingdom: Haunted Mansion (19%), it’s a small world (18%), Tiana’s Bayou Adventure (16%), Tron (14%), Country Bear Jamboree (14%), Mad Tea Party (13%), Monsters Inc Laugh Floor (11%), Seven Dwarfs Mine Train (11%)
- EPCOT: Spaceship Earth (30%), Frozen Ever After (17%), Remy’s Ratatouille Adventure (14%), Test Track (12%)
- Hollywood Studios: Rise of the Resistance (26%), Slinky Dog Dash (12%)
- Animal Kingdom: Kali River Rapids (66%), Kilimanjaro Safaris (24%)
Back to a season of every park having problems. Kilimanjaro Safaris being back on this list for a second Data Dump in a row is concerning. It’s usually very reliable. The past two weeks did have quite a few cold mornings, which could mean slow animals or problems getting safari trucks started. Might be time for Disney to consider replacing that fleet!
Hollywood Studios didn’t have a terrible rope drop experience the past two weeks – but it is sad that the top two rope drop options in the park are the two attractions that are least reliable.
Over at Magic Kingdom, there are LOTS of problems. Even at attractions that don’t normally have issues, like Tron or Mad Tea Party or it’s a small world! Always have a backup plan for your backup plan there.
Wait Times March 10 – 23
Attractions with the Highest Average Posted Wait at Each Park: March 10 – 16
- EPCOT: Cosmic Rewind, average posted wait of 90 minutes (was 75 minutes the week before)
- Magic Kingdom: TRON, average posted wait time of 81 minutes (was 64 minutes the week before)
- Hollywood Studios: Slinky Dog Dash, average posted wait of 80 minutes (was 68 minutes the week before)
- Animal Kingdom: Flight of Passage, average posted wait time of 64 minutes (was 57 minutes the week before)
Once again, decent increases week-over-week as we headed from early March into mid-March. Six different attractions had average posted waits that were over an hour – in addition to the four above, Test Track had the second-highest overall average (86 minutes), and Rise of the Resistance also sneaked in above an hour (62 minutes).
Attractions with the Highest Average Posted Wait at Each Park: March 17 – 23
- EPCOT: Cosmic Rewind, average posted wait of 115 minutes (was 90 minutes last week)
- Hollywood Studios: Slinky Dog Dash, average posted wait of 94 minutes (was 80 minutes last week)
- Magic Kingdom: TRON, average posted wait time of 90 minutes (was 81 minutes last week)
- Animal Kingdom: Flight of Passage, average posted wait time of 90 minutes (was 64 minutes last week)
Now these are ugly number. Last week there were 6 attractions with average posted waits over an hour. This week, there were 5 attractions with average posted waits over an hour and a half. And a whopping twelve attractions with their overall average over an hour! That sort of increase makes a massive different in your ability to tour efficiently.
Parks with the Highest and Lowest Average Wait: March 10 – 16
- Highest: Hollywood Studios, average park-wide posted wait of 39 minutes (was 33 minutes the week before)
- Lowest: Magic Kingdom, average park-wide posted wait of 23 minutes (was 21.5 minutes the week before)
Every park saw modest increases from the first week of March. That first week of March was the clear winner of the month!
Parks with the Highest and Lowest Average Wait: March 17 – 23
- Highest: Hollywood Studios, average park-wide posted wait of 47 minutes (was 39 minutes last week)
- Lowest: Magic Kingdom, average park-wide posted wait of 27 minutes (was 23 minutes last week)
From a park-wide perspective, Hollywood Studios, EPCOT, and Animal Kingdom all had park-wide wait time averages of 45 minutes or more. That’s remarkably high! Magic Kingdom was the only park that stayed under an average of half an hour – the blessing of having many attractions for people to choose from.
Most Inflated Posted Wait Times
We all know that Disney inflates their posted wait times on purpose. They have many reasons for doing this. Some are totally understandable, and some are potentially more problematic. We can figure out how much posted wait times are being inflated by comparing submitted actual wait times from the Lines App and the posted wait time when the person timing their wait entered the line.
Over the past two weeks, actual wait times in the Lines App averaged 73% of what was posted. That’s slightly above our historical average in the era of Lightning Lanes, which means that posted waits were less inflated than normal. Hooray! Overall, if the posted wait time at a popular attraction was 60 minutes, you could’ve expected to wait just less than 44 minutes instead.
But the worst inflation offender for the past two weeks was The Seas with Nemo and Friends. At this one attraction, submitted actual wait times were only 26% of posted wait times in the past week. That means that if Nemo had a 30 minute posted wait, you probably would have actually only waited less than 8 minutes instead. Almost a quarter was posted! Remember to always check the Lines app for predicted actual waits instead of making decisions based on what is posted.

This Week’s Wait Time Rock Star: March 10 – 16
Between March 10th and 16th, we had just over 900 timed actual waits submitted through the Lines app. The one person who recorded the most actual waits during that time was passesforsix, with 41 overall timed waits – 38 standby waits, and 3 single rider waits. Thanks for all of that timing, passesforsix! It unfortunately does not compete with the the 97 timed waits in a single week from our current timing champion, preef.
This Week’s Wait Time Rock Star: March 17 – 23
Between March 17th and 23rd, we had just over 900 timed actual waits submitted through the Lines app. The one person who recorded the most actual waits during that time was tkyllmann, with 30 overall timed waits – 26 Lightning Lane waits, and 4 standby waits. Thanks for all of that timing, tkyllmann! It unfortunately does not compete with the the 97 timed waits in a single week from our current timing champion, preef.
Looking Ahead: March 24 – 30
I write this article on Tuesday evenings so that you all have the very freshest of data on Wednesdays. That means the 24th will already be in the past by the time you’ve read this, so you’re back to the future!
We’re still in the heart of Spring Break season. Pirate and Pixie Dust Annual Passes are blocked out March 29-April 9, which means Disney is expecting higher crowds. My original prediction is that those dates would be more crowded than March 14-21 (the first blockout), so we’ll see if that comes true. Right now, the crowd calendar is predicting just moderate crowds, but we already saw spikes in mid-March, and many more schools are out for Spring Break as we head closer to April.
The weather for the upcoming week looks just about perfect. Sunny, with lows in the 60s and highs in the 70s or 80s! As always, you should be prepared for a passing rain shower, but for the next 7 days, sunscreen is going to be more important than an umbrella.
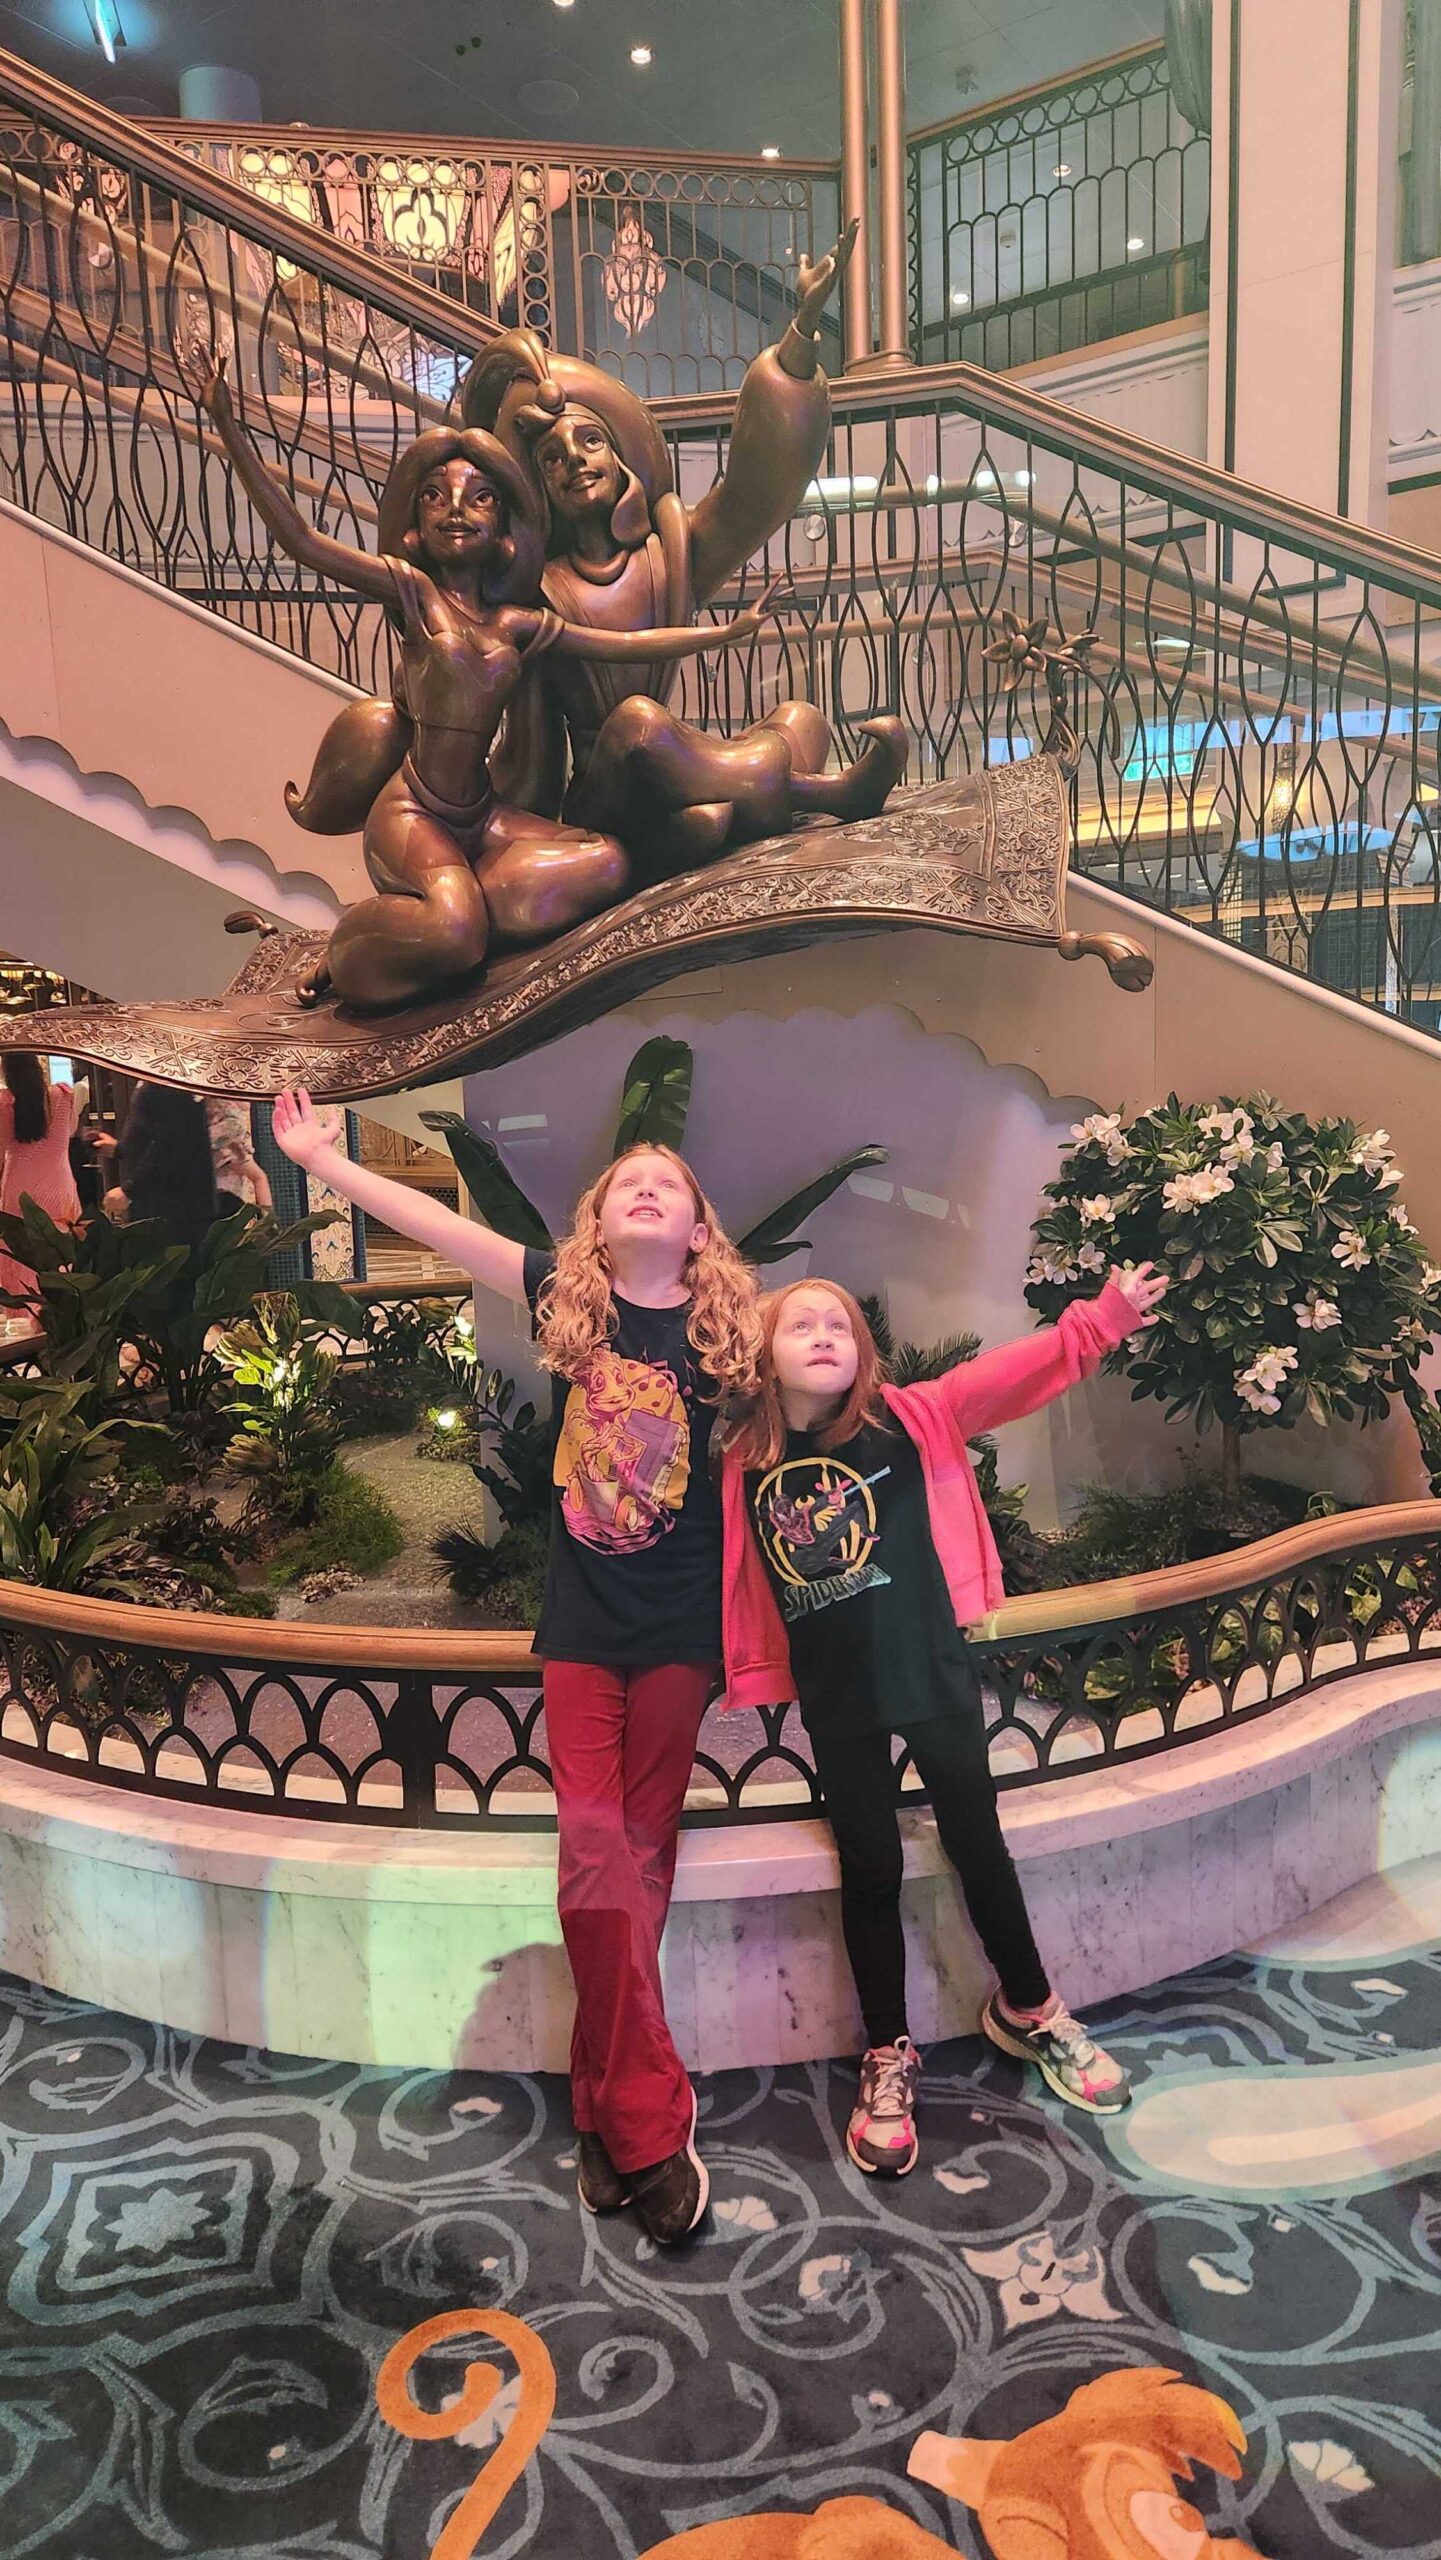
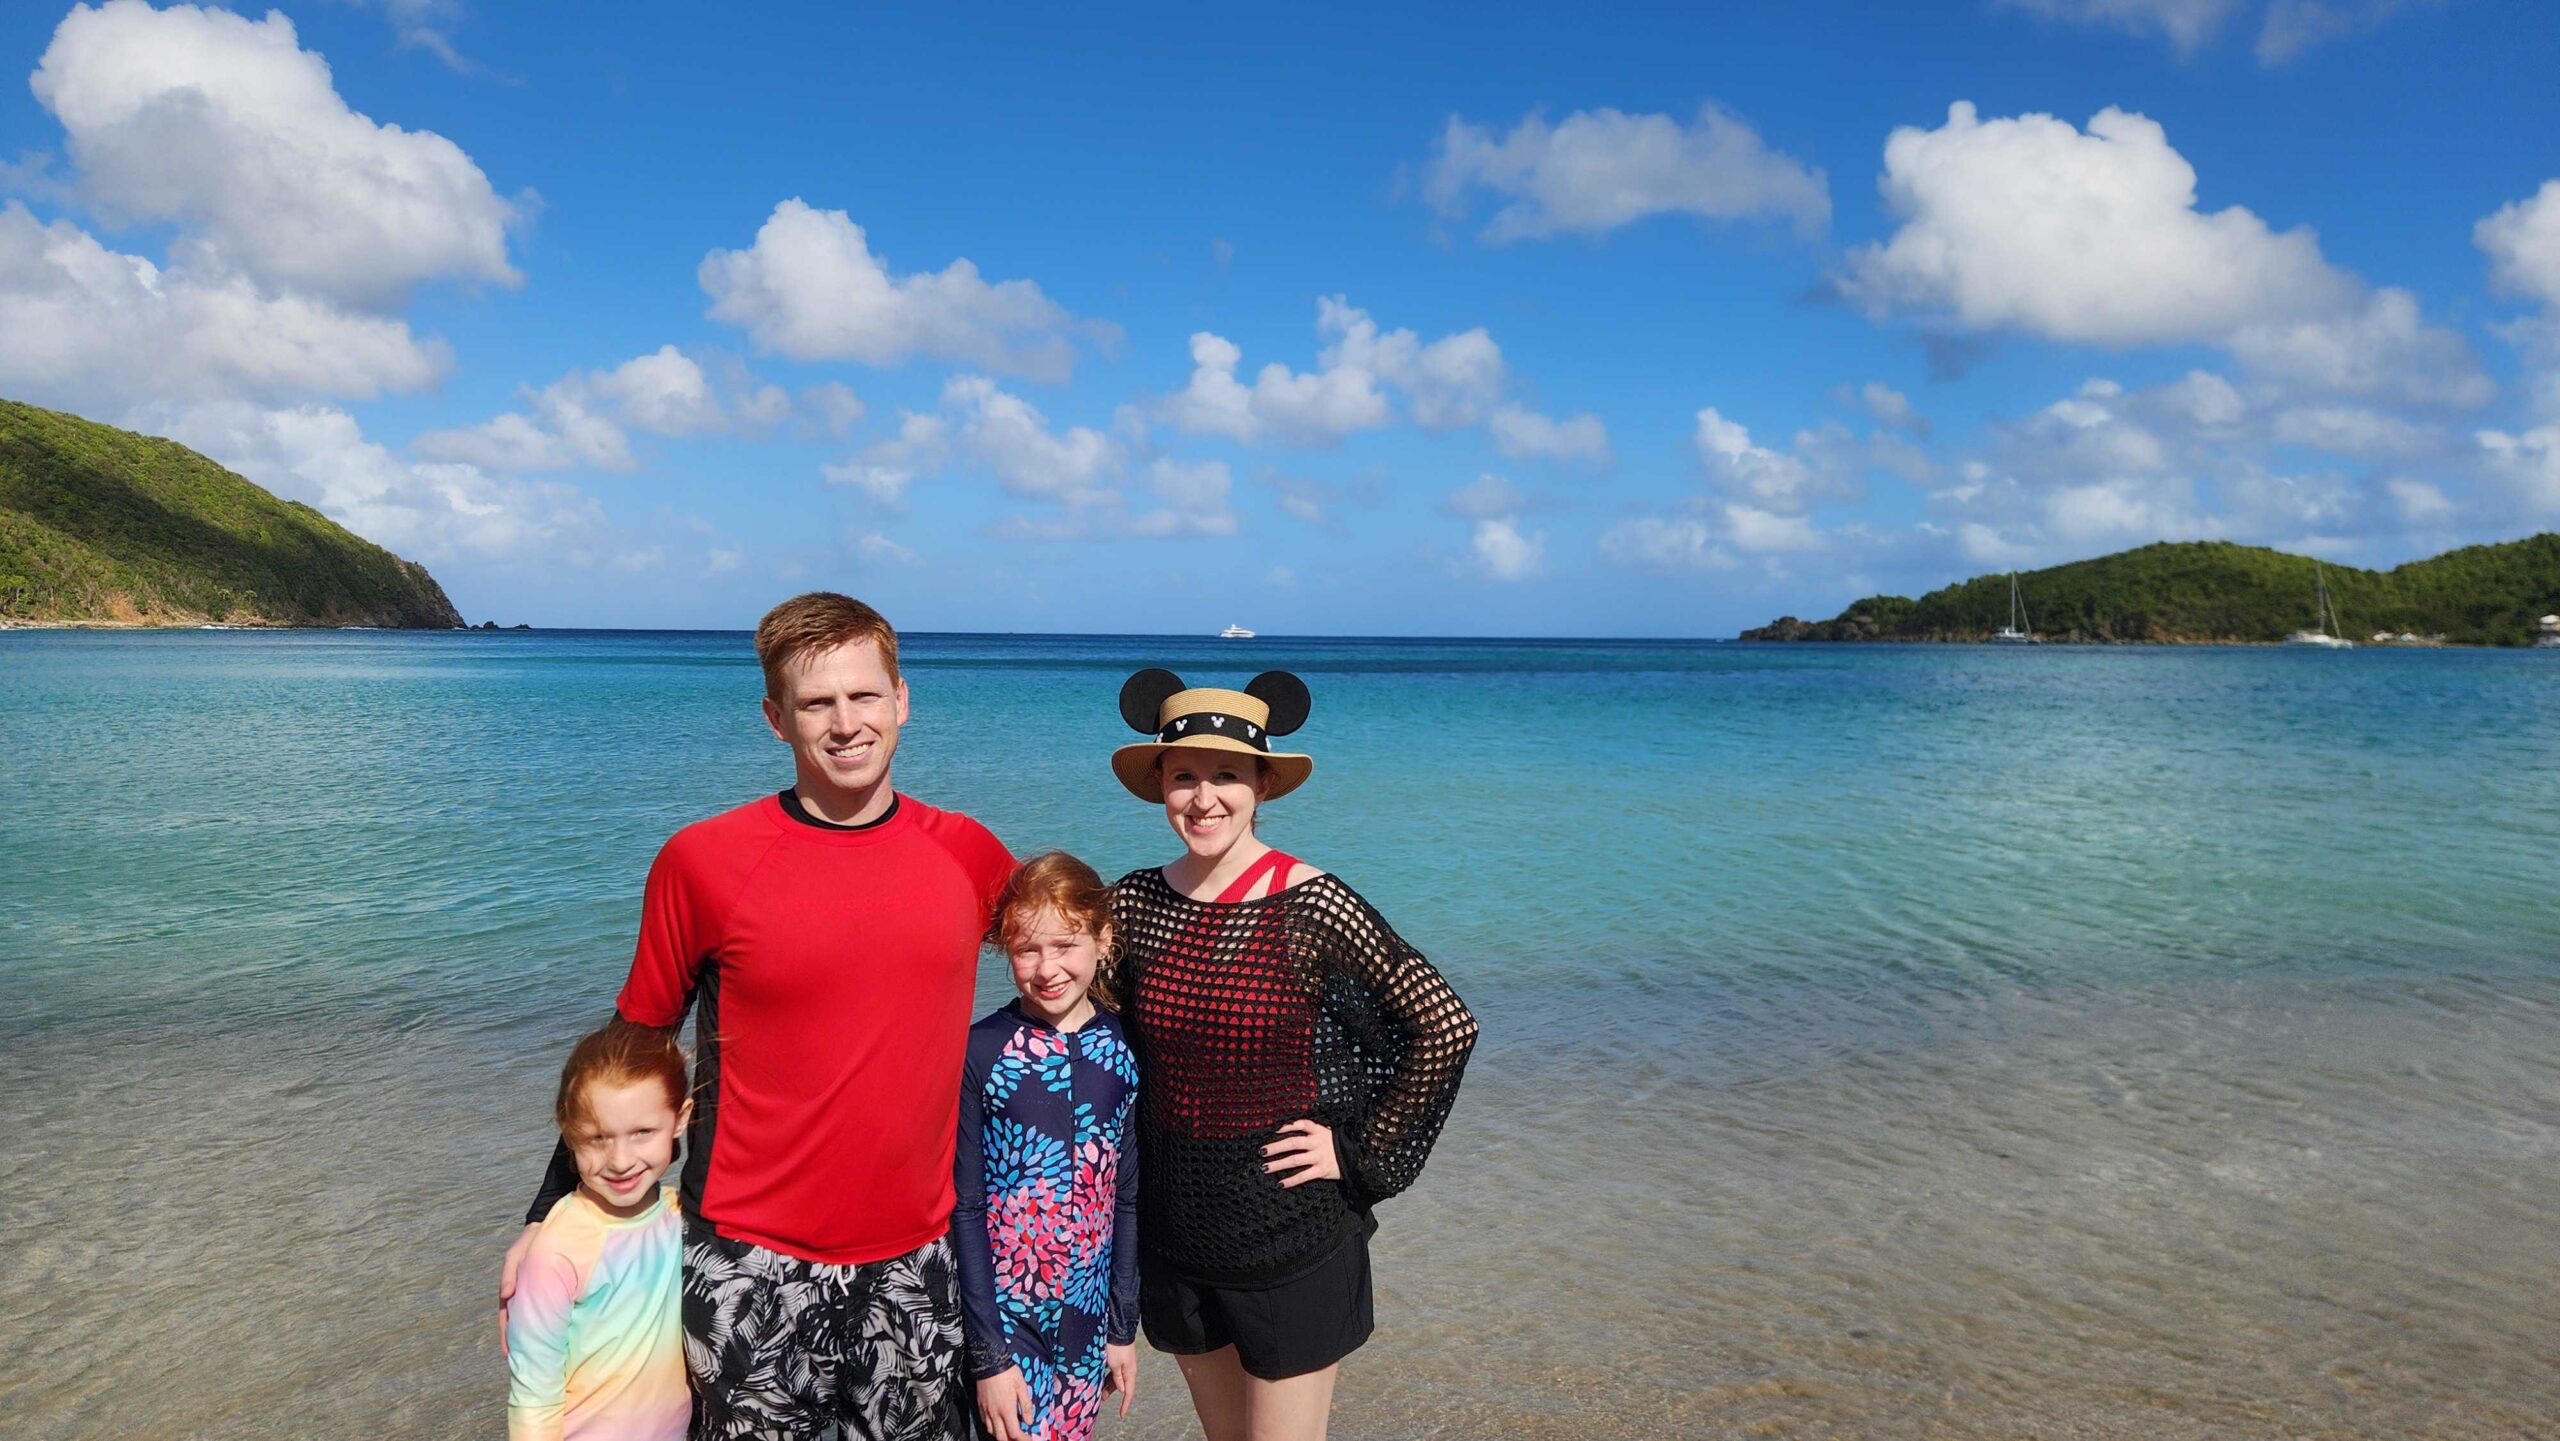
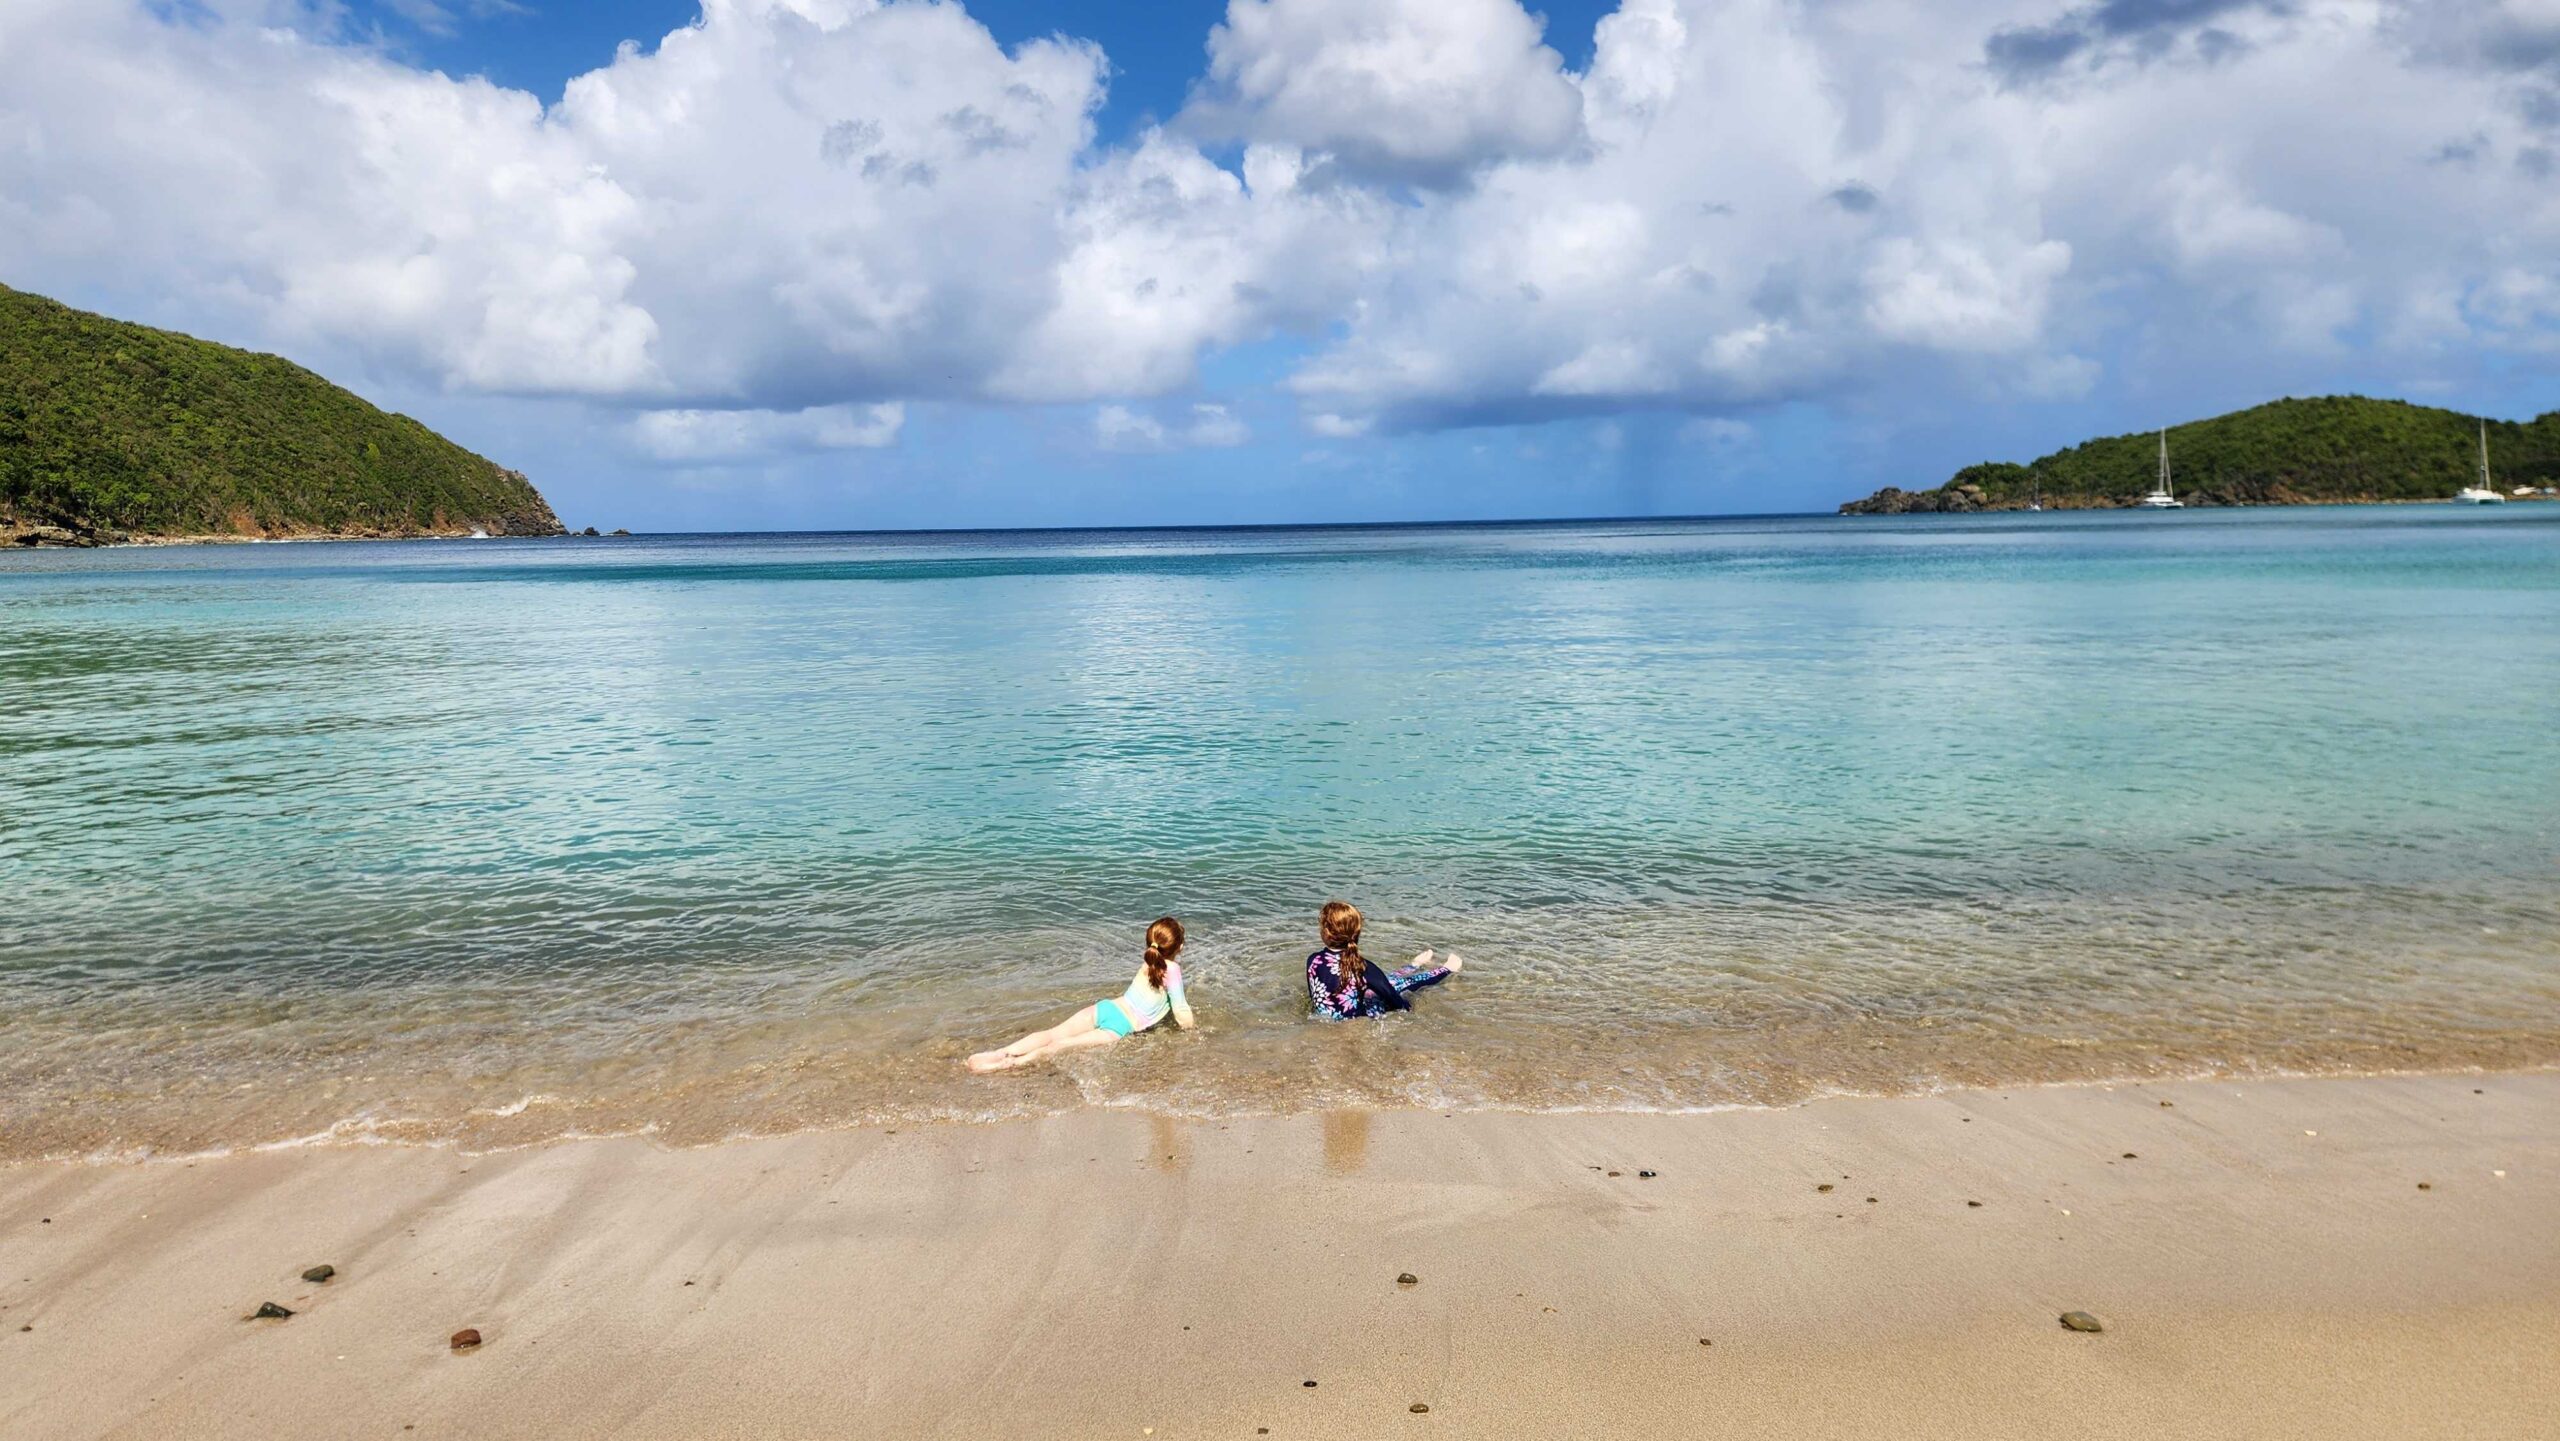
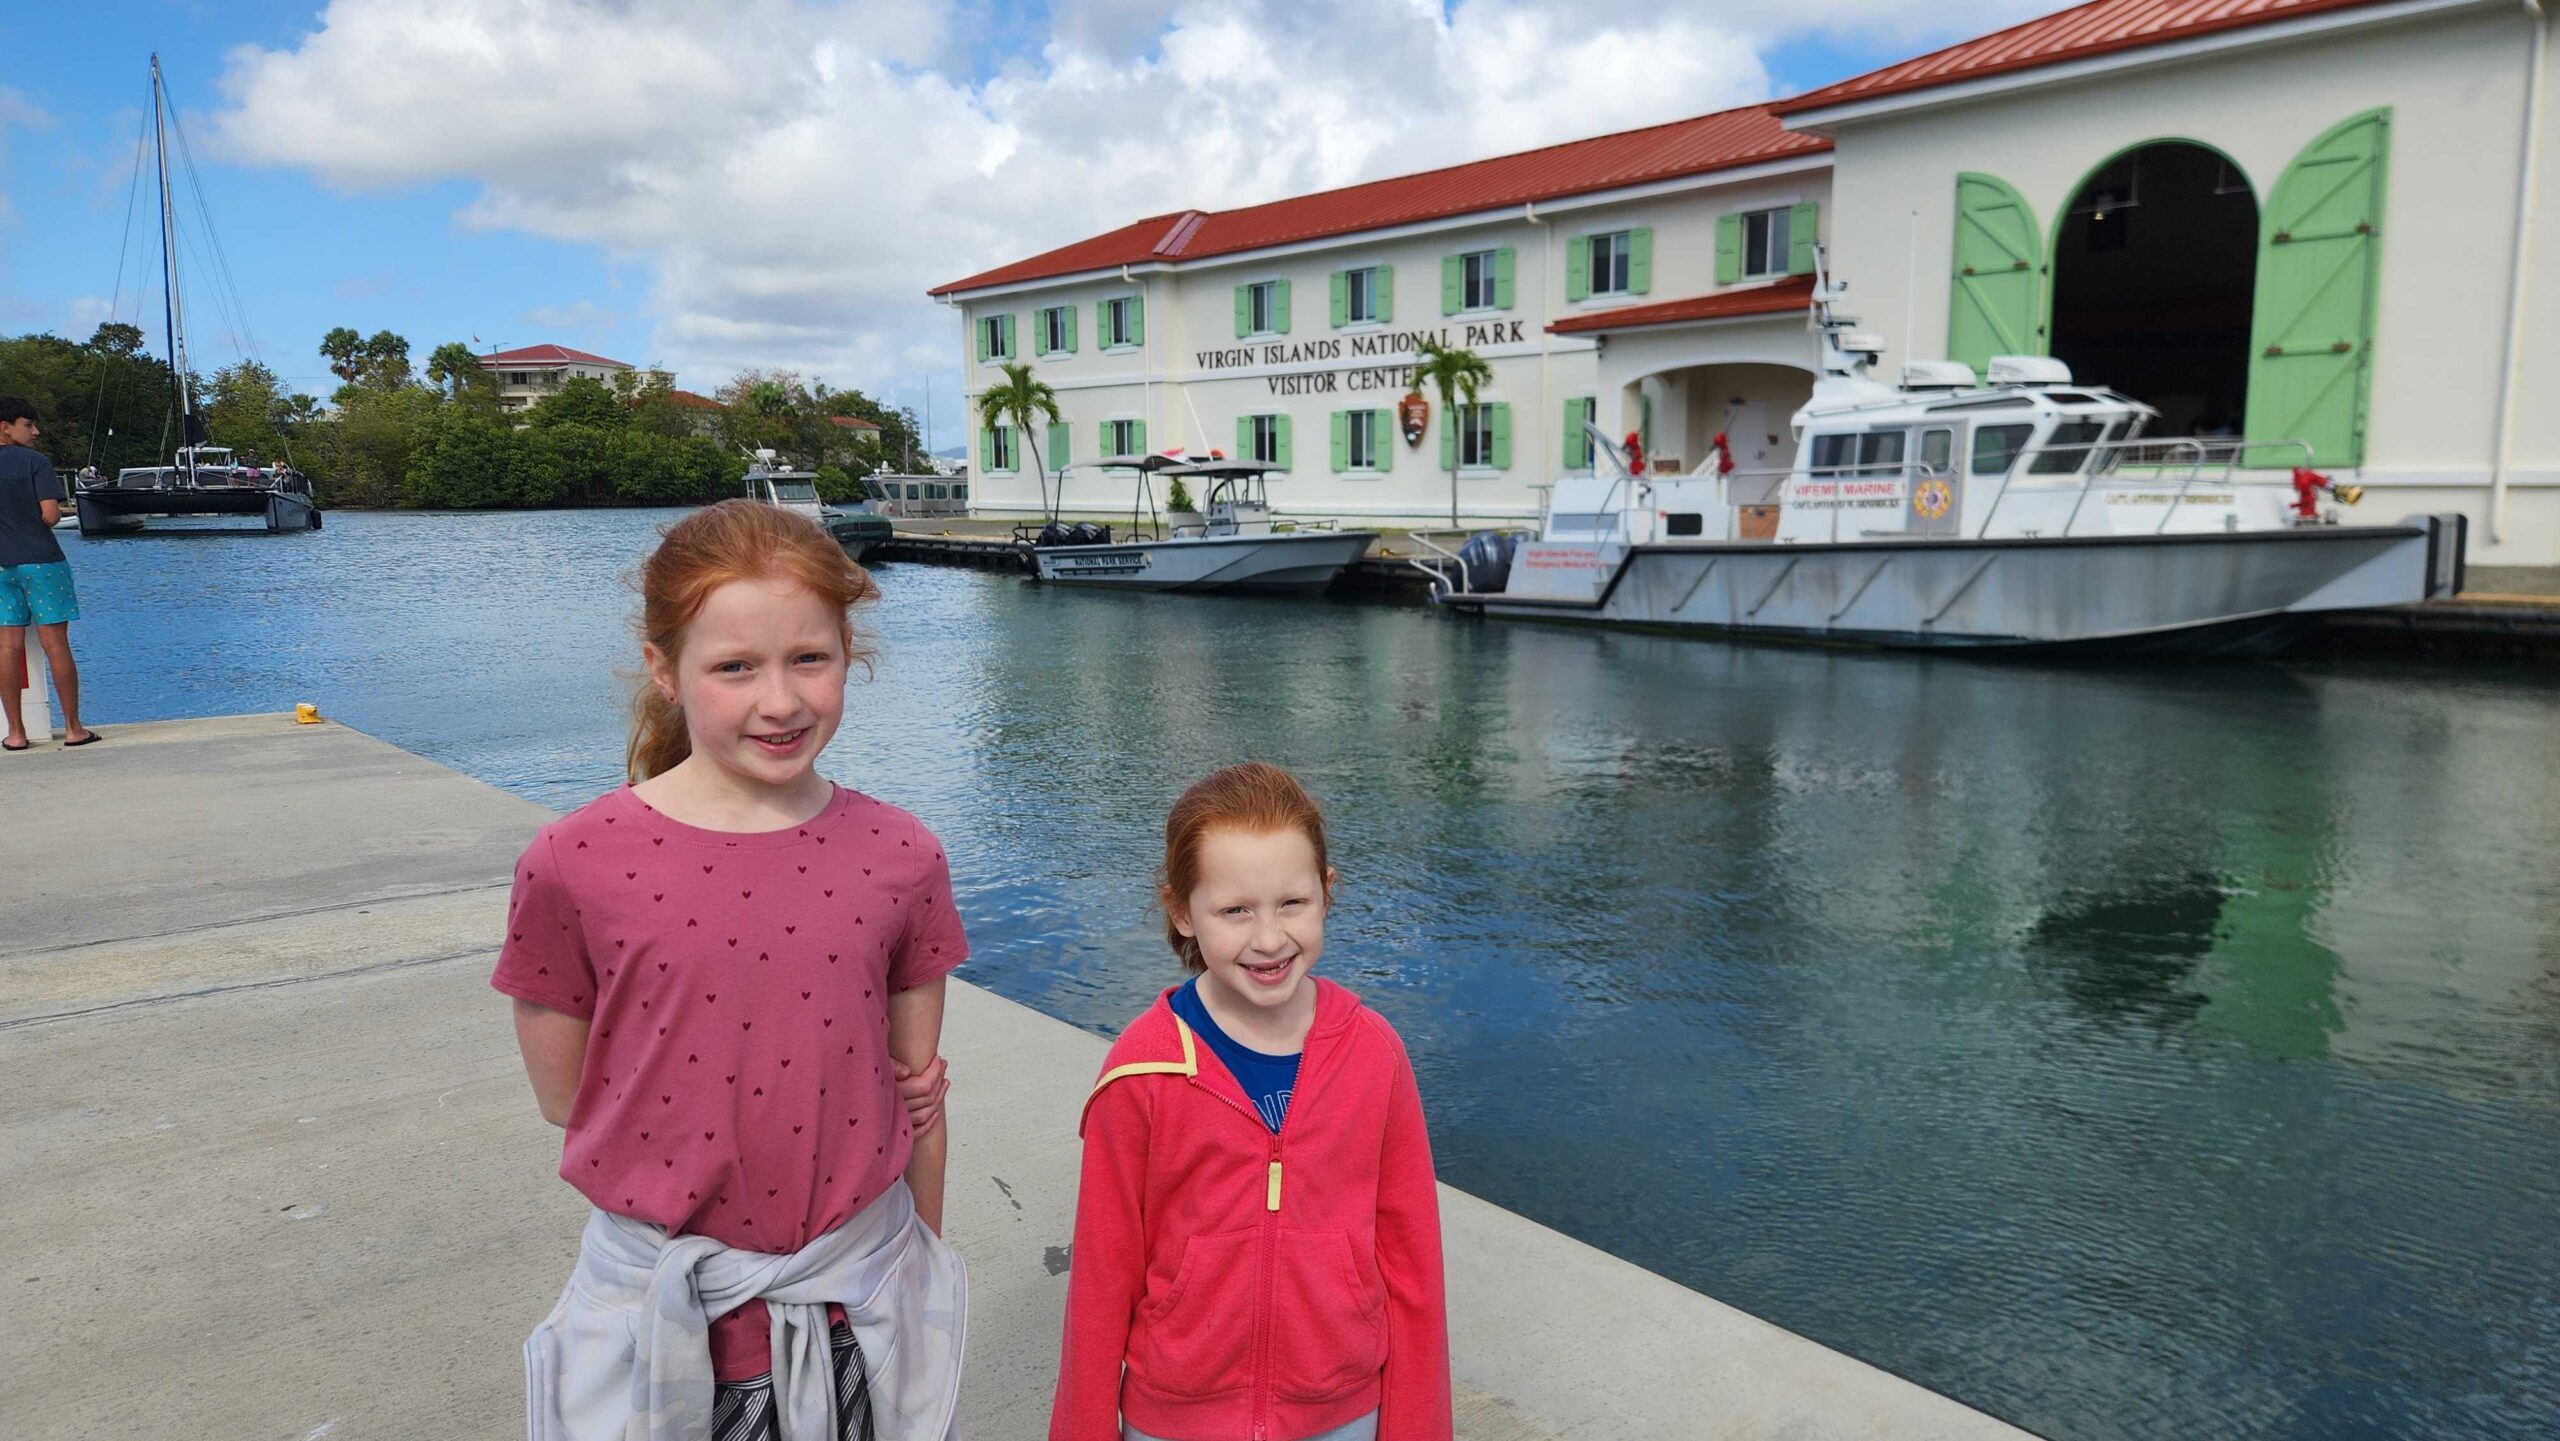
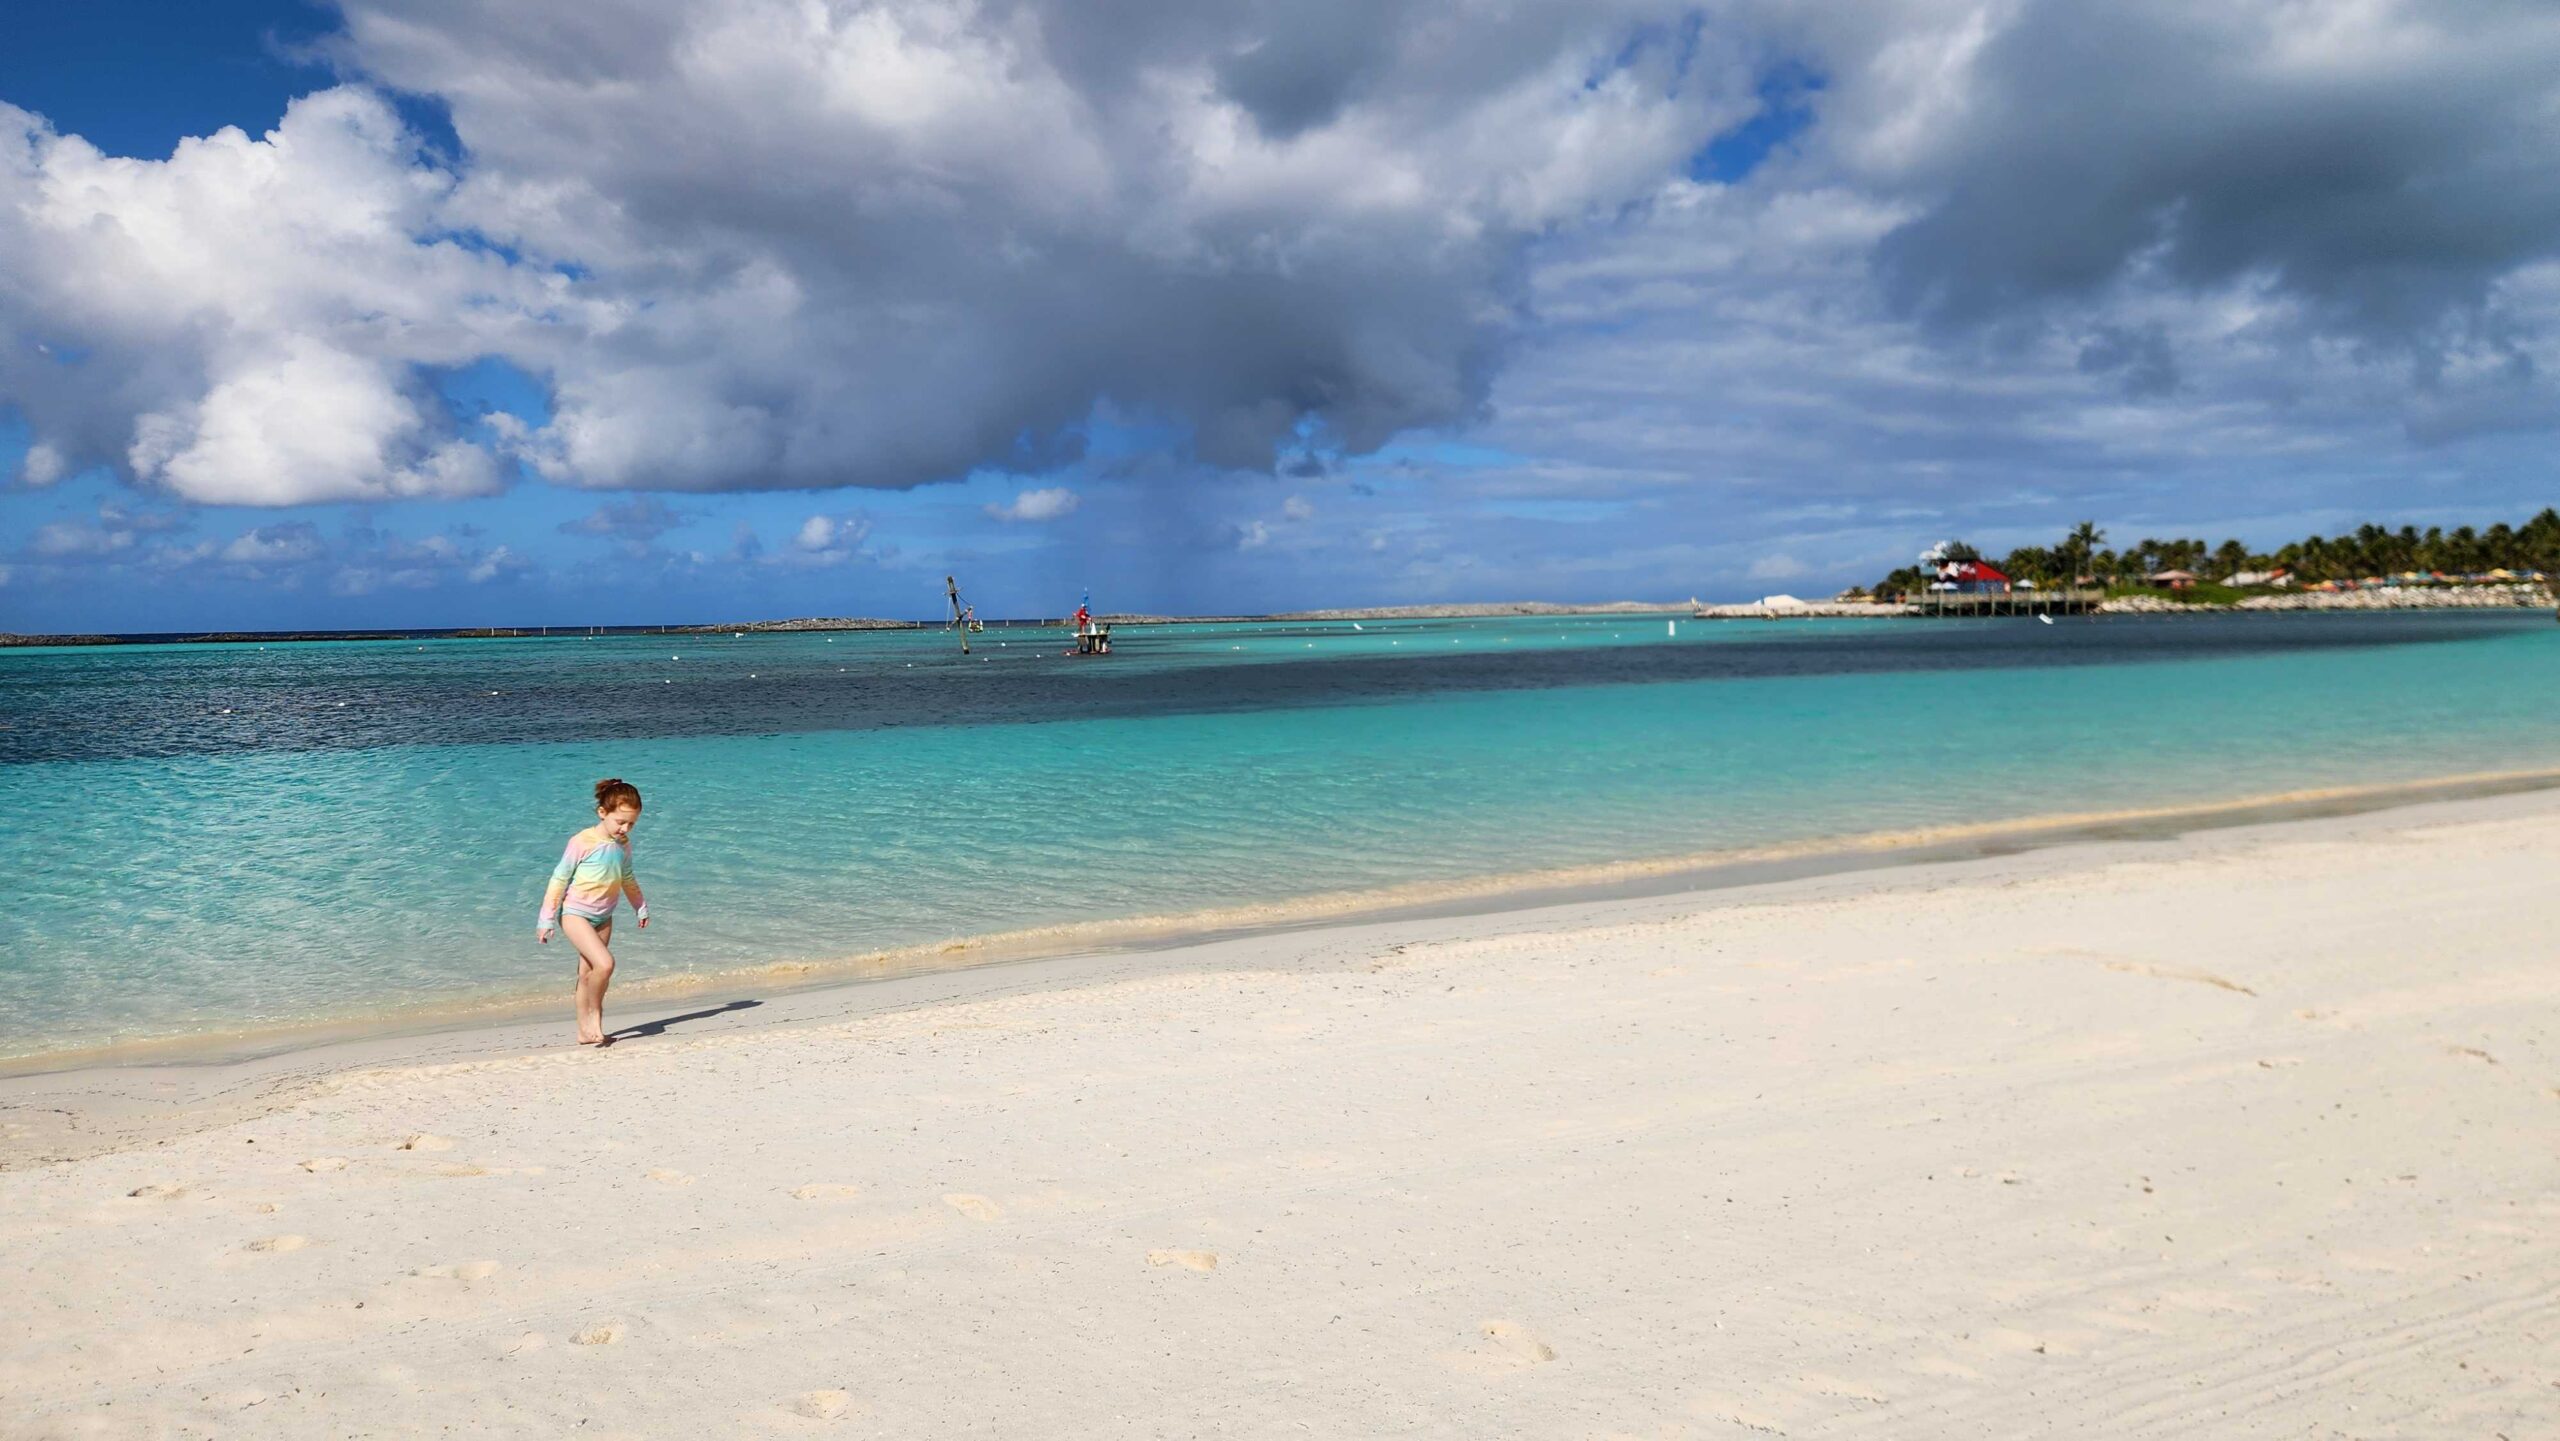
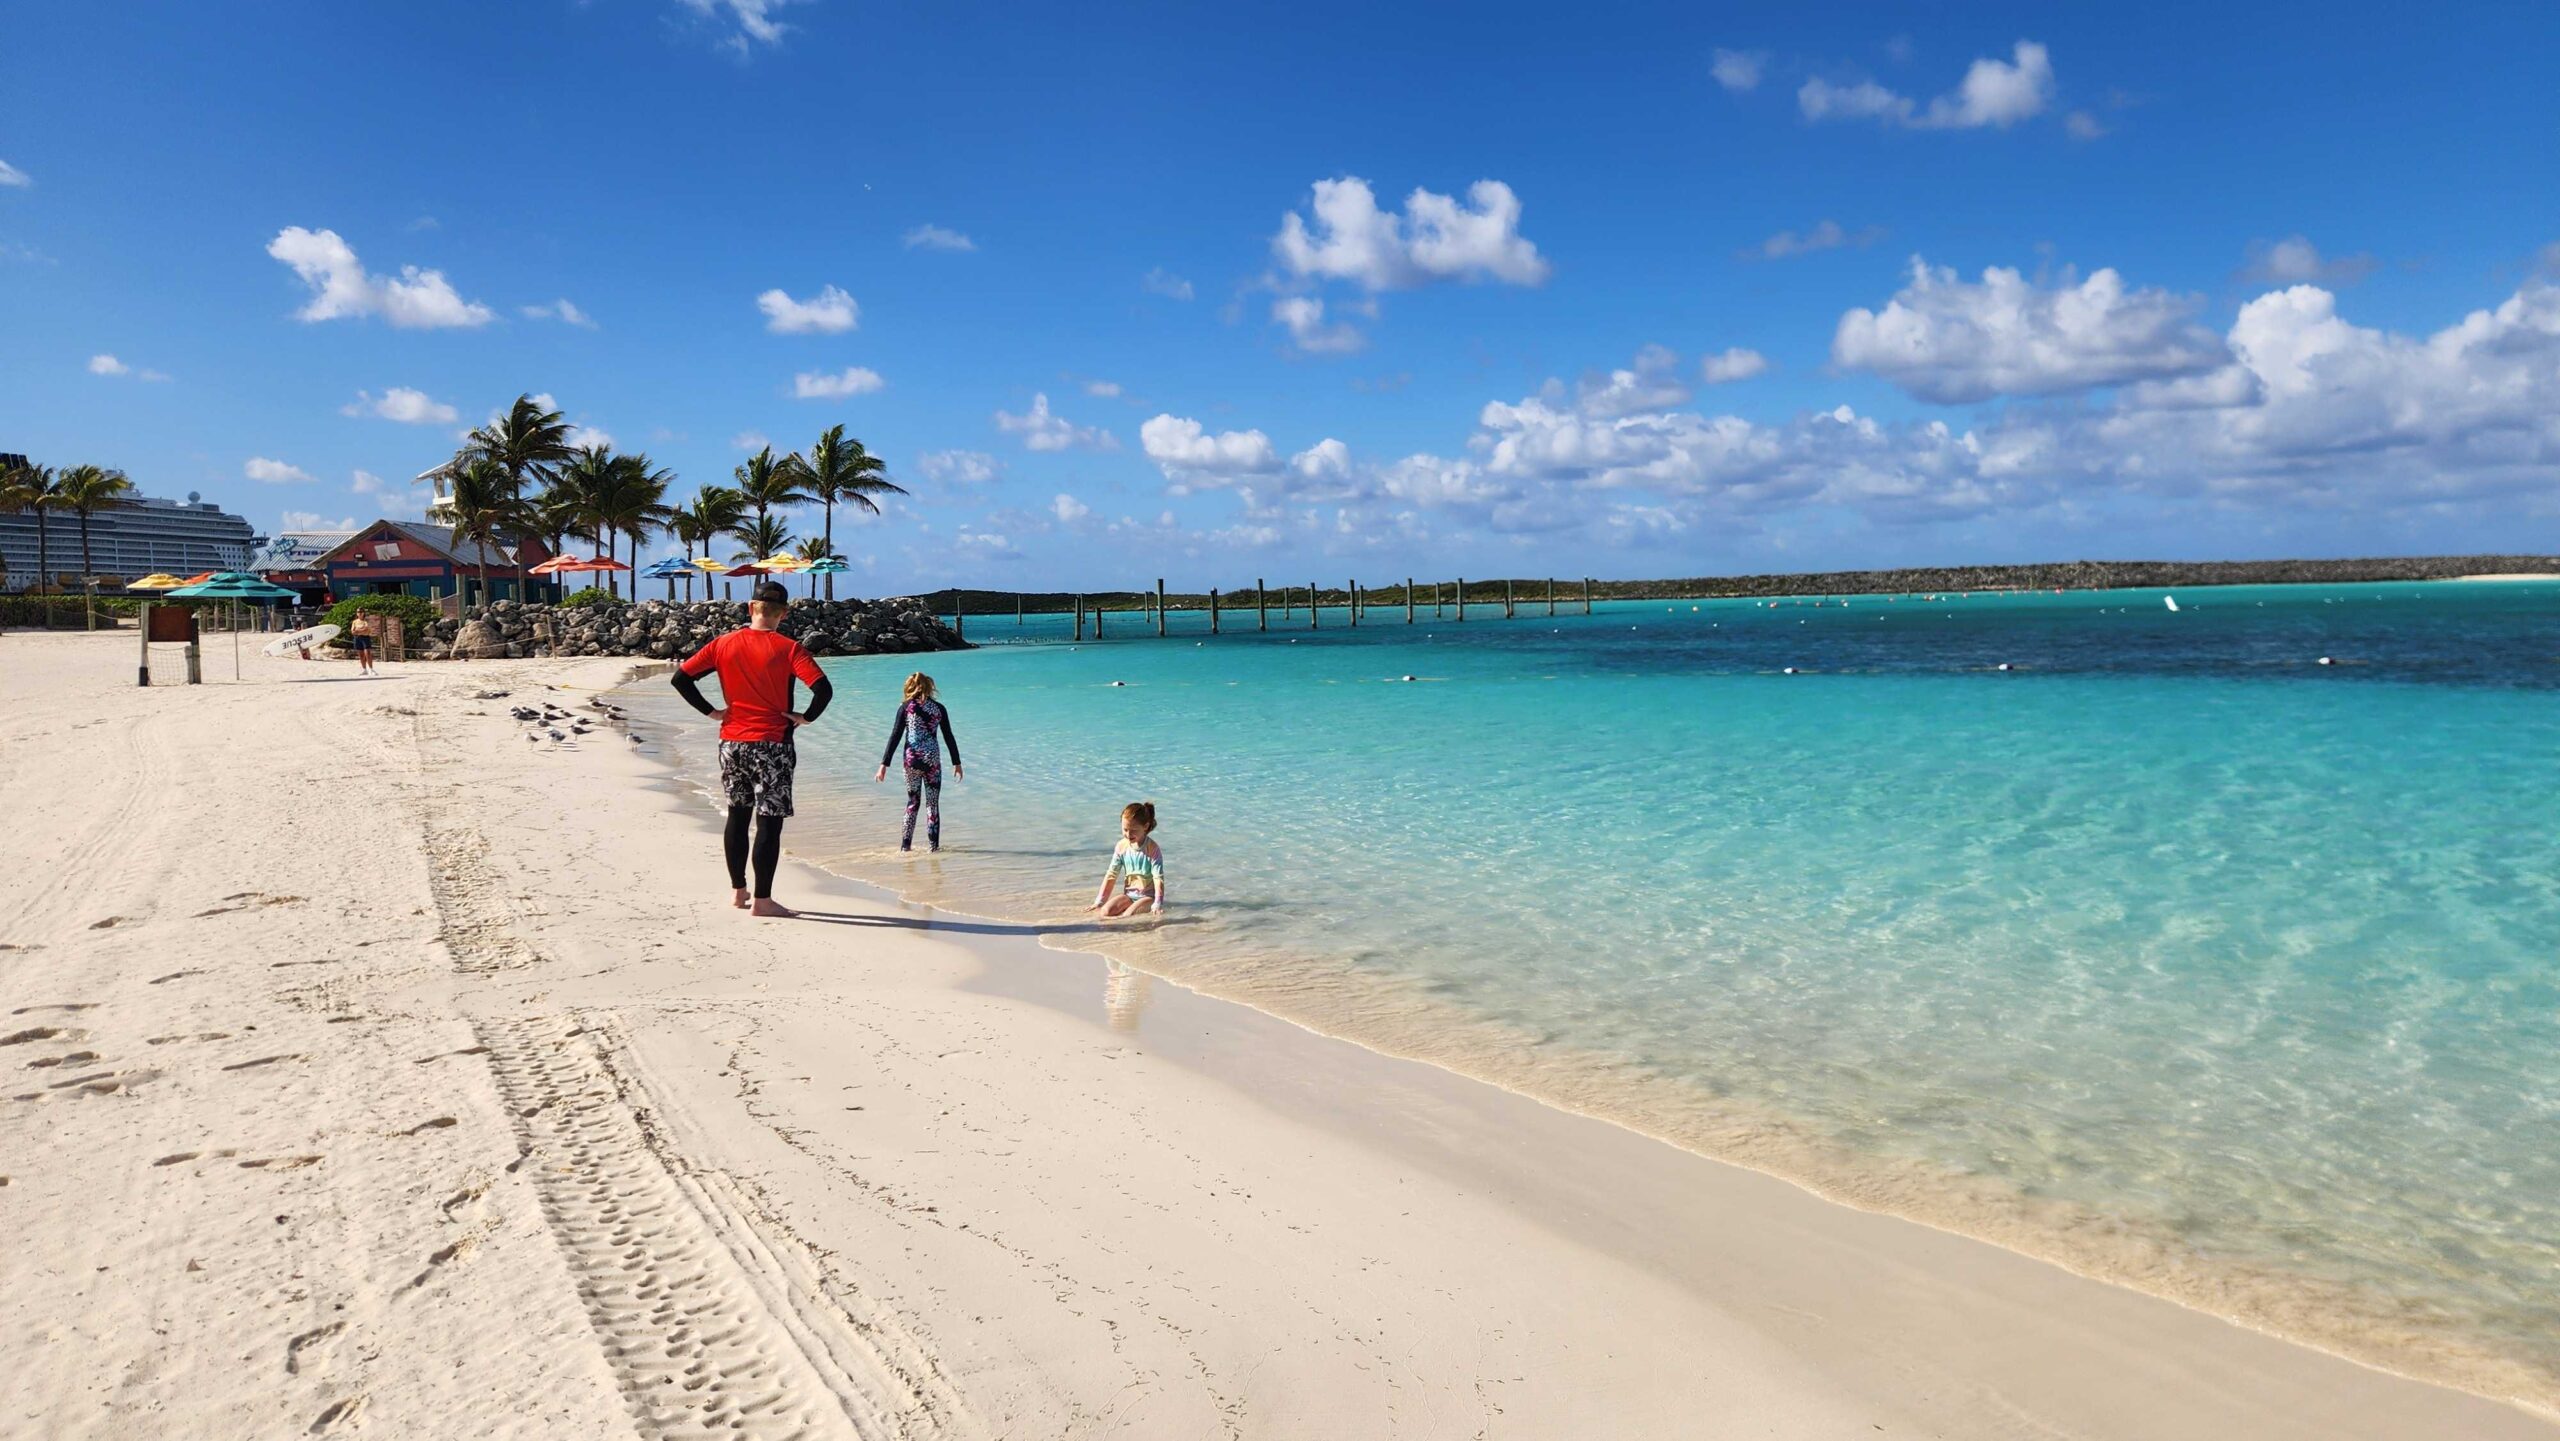
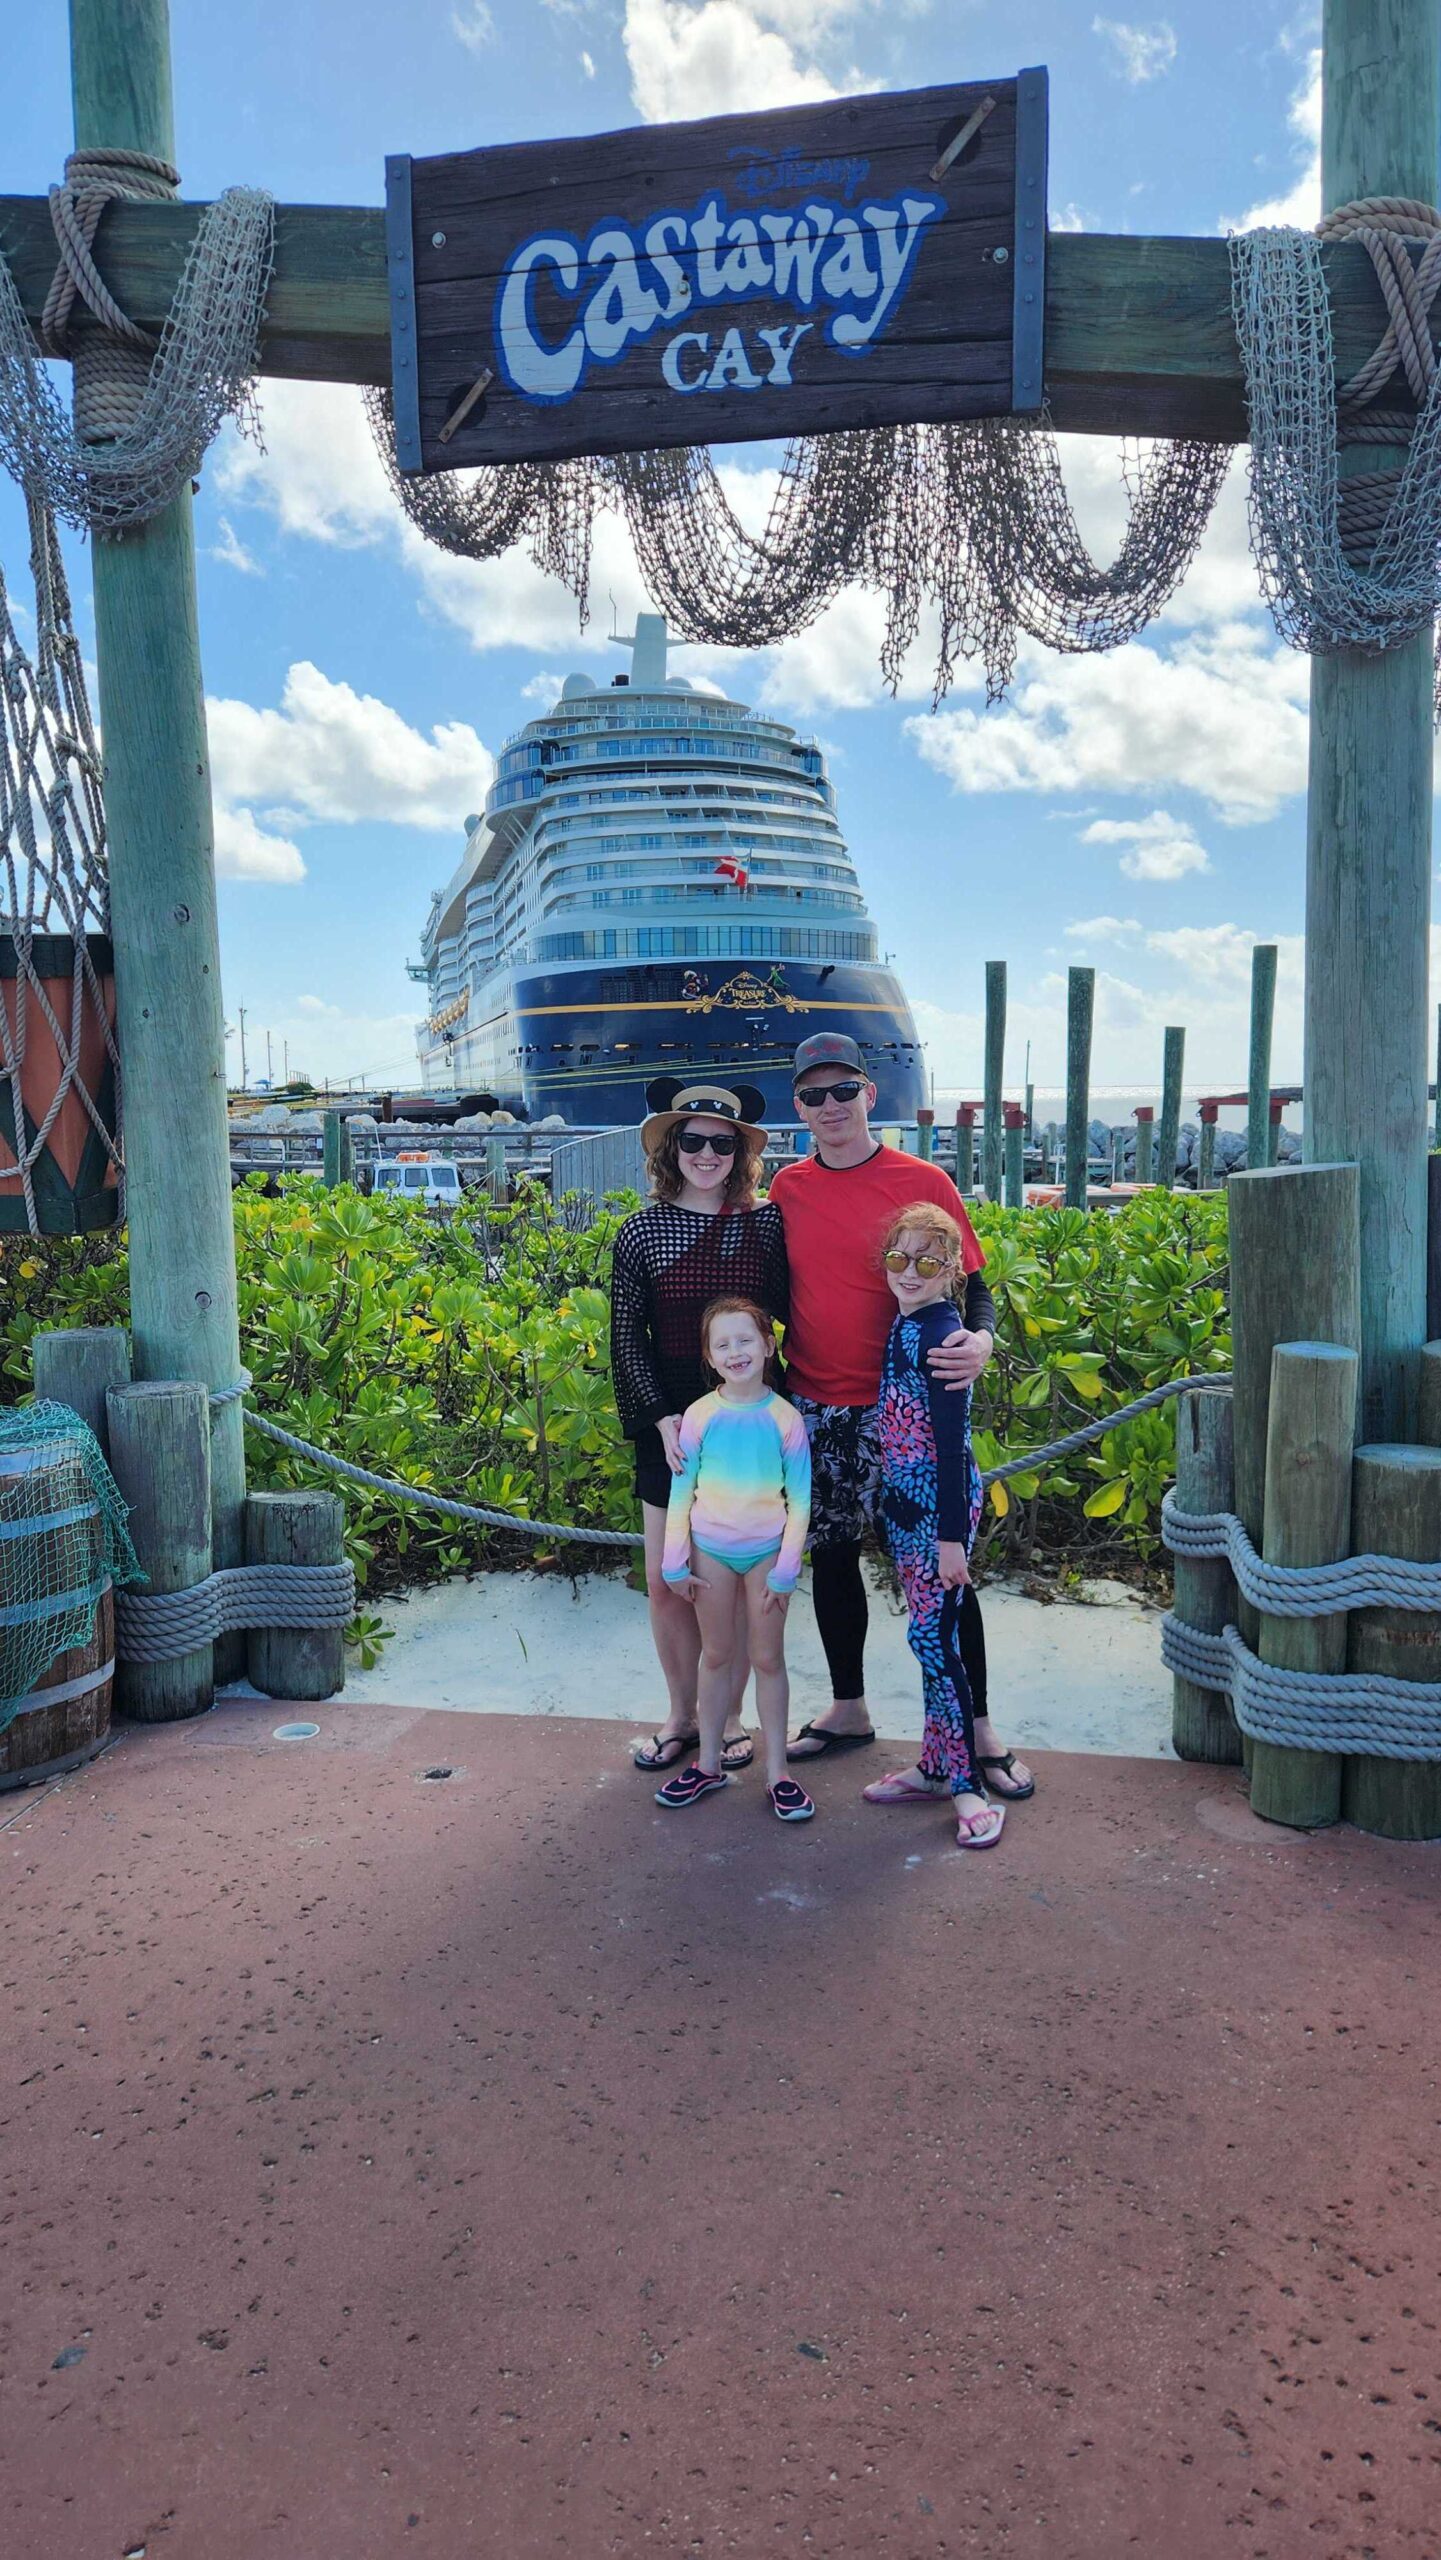
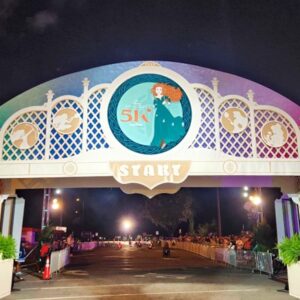
Bonus: Cruise Photos!
My family just returned from a 7-night Eastern Caribbean cruise on the Disney Treasure! The seas were rough, but the vacation was great. Enjoy a few scenes from our trip.


Were you in the parks this past week? Or are you headed to Orlando soon? Let me know in the comments below!
You May Also Like...
-

After a few weeks of winter wait time whiplash (holiday mash-ups, lingering long-weekend crowds, and the brief runDisney bump) the parks…
-
Now this is the late winter/early spring that we know and love. After a couple of weeks of lingering long-weekend chaos,…