Disney Data Dump November 26 2025
Thanksgiving week is here, and the crowd patterns at Walt Disney World did almost exactly what we’d expect. The first half of the week was delightfully empty. And then, almost overnight (specifically, over the weekend), the Thanksgiving travelers started rolling in and those numbers jumped fast. Not wild, not wall-to-wall, but definitely enough to make you say, “Oh hey, the holidays have arrived.”
Layer in a mix of Christmas parties and some surprisingly reliable attractions (plus a few surprising unreliable ones), and you get a week that looks simple on the surface but has some really fun little storylines underneath. Let’s look at it all together.
Observed Crowd Levels November 18 – 24
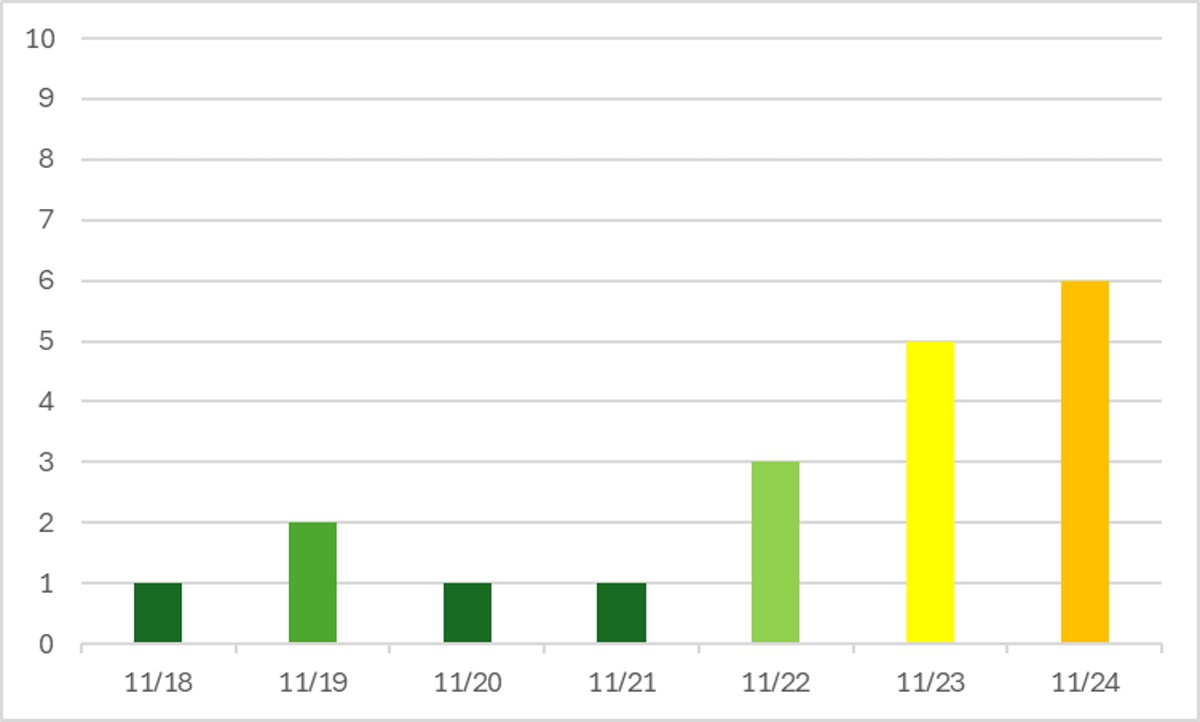
Whoa! Look at that arrival of Thanksgiving crowds! Ooh. Ahh. I mostly kid, because a crowd level 6 still isn’t all that crowded. But it’s certainly VERY different than the three crowd level one days we saw last week. But don’t worry – things should calm back down again just as quickly as they ramped up.
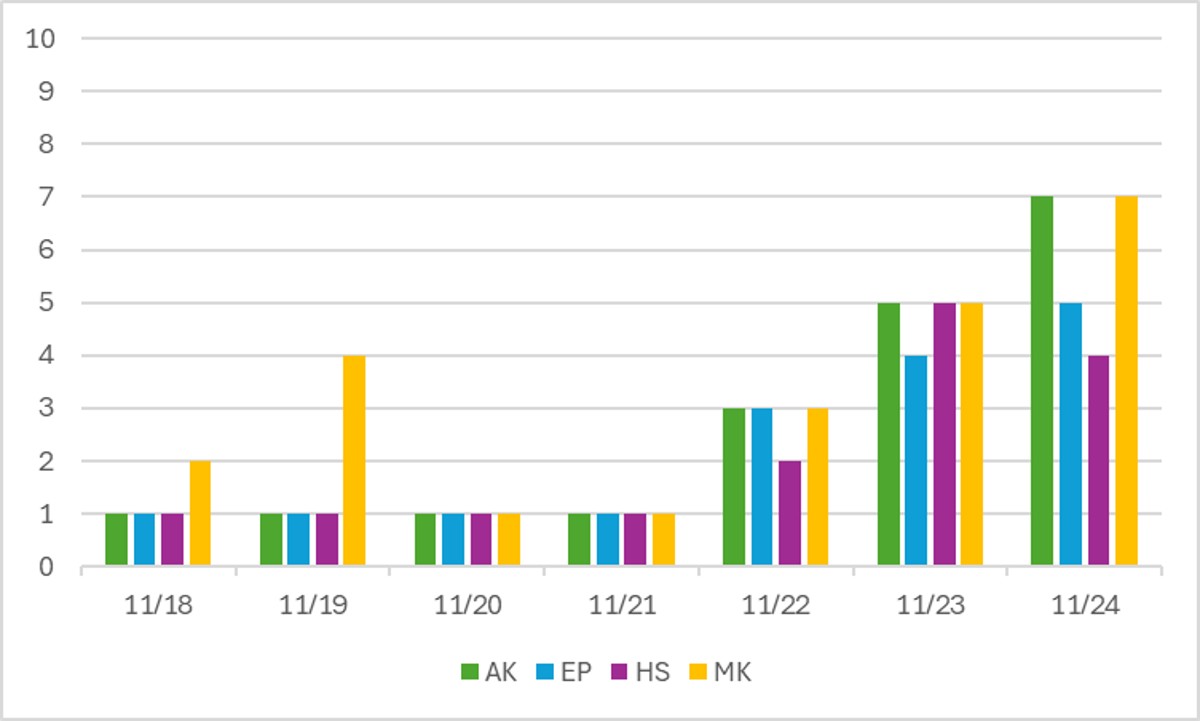
Thanks to the rock-bottom crowds at the beginning of this seven-day period, and then people flooding into the parks in the past couple of days, it’s a little harder to play our favorite “when were the parties” game. Jollywood happened on the 22nd and 24th, and we can tell because it was the least-crowded park on both of those days. MVMCP was on the 18th, 20th, 21st this week, and that’s it. I warned that the 19th would be “very” crowded. since it was surrounded by a bunch of party days. And, relatively speaking it was, lol. But still overall a 4.
Performance of Crowd Level Predictions
Each week, I give you a very transparent look into how the TouringPlans crowd level predictions performed. Each day at each park is one data point, so each week we have 28 different crowd level predictions to evaluate. Any time a prediction is within one or two crowd levels, things won’t really “feel” much different than what was predicted. Being off by 3 or more crowd levels is where you might feel that difference in wait times throughout the day.
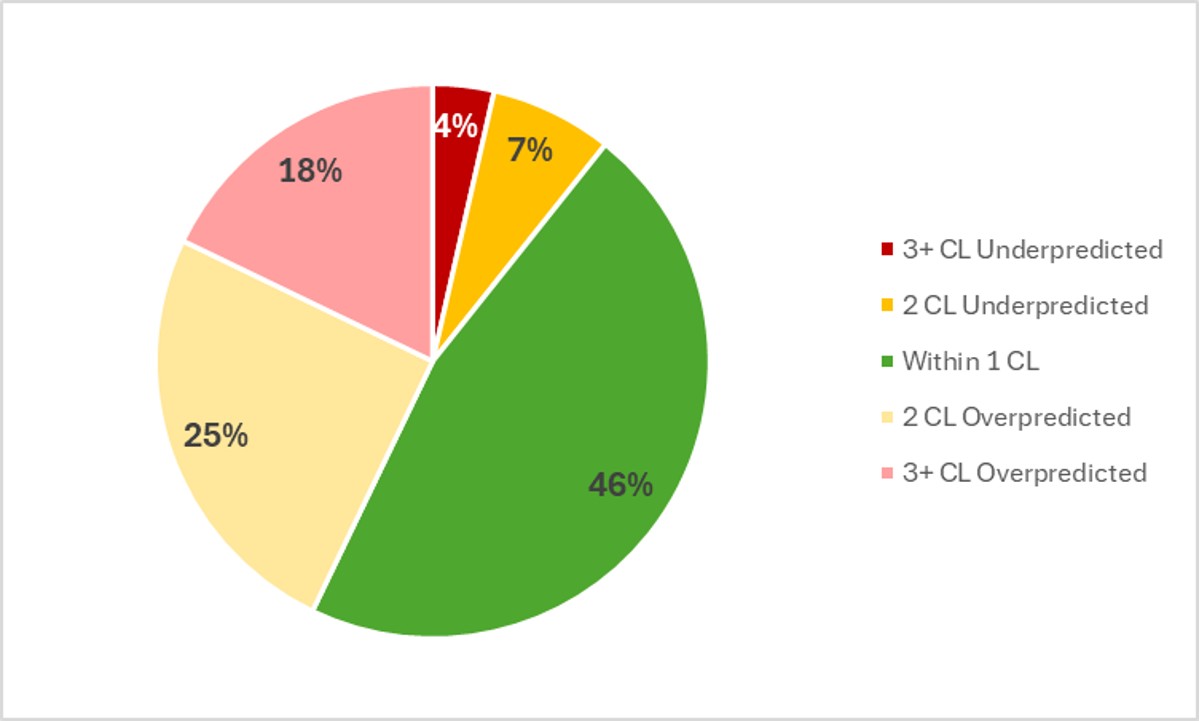
In the past week, Touring Plans predictions were either spot-on or within 1 crowd level 46% of the time, which is slightly worse than last week. And then 78% of the time Touring Plans predictions were within 2 crowd levels, so that means we get a C+ for our predictions in the past week, which is better than last week. The biggest miss of the week was an overprediction of 4 crowd levels, which happened at EPCOT on the 21st. EPCOT was predicted to be a 5 and ended up being a 1 on the 21st – along with every other park. But we also had a rare 3-crowd-level underprediction this week. That happened at Hollywood Studios on the 23rd. It’s important to call out because that’s the between-party day. In previous years, between-party days didn’t see big crowd increases at Hollywood Studios. But they are this year.
Attraction Downtime November 18 – 26
If we average all of the capacity lost due to unexpected downtime over the past week, it comes out to 3.4% of attractions unexpectedly being down. That’s below our historical average, which magically tends to happen when Disney expects larger crowds. In the past week, EPCOT was the park with the most overall downtime, averaging 4.3% of its capacity lost to downtime throughout that period. No major issues at any park for the past week, which is nice!
The worst day for attraction downtime in the past week was on November 24th. On that day, 4% of all capacity at WDW was lost due to unexpected downtime. That’s one of our lowest “worst days” we’ve ever seen in the history of this article. And the worst park-day was at EPCOT on November 23rd. On that day, 9% of EPCOT’s attraction capacity was lost due to unexpected downtime. Thank goodness we broke the streak of Animal Kingdom “winning” and having downtime up in the 20% range. EPCOT was open for 12 hours on the 23rd, so 9% downtime is the equivalent of the entire park shutting down for just over an hour that day – almost 65 minutes, to be exact. Not great, but certainly nowhere near our worst days of the year.
Attraction Downtime Worst Offender
In the past week, The Many Adventures of Winnie the Pooh was the WDW attraction with the worst overall unplanned downtime. I’m pretty sure this is the first time Winnie has ever had the highest downtime in a week! But it was unexpectedly down for 14% of the past week. Once again, that’s a pretty low “winning” number, so we don’t have much to complain about. The worst day at Winnie the Pooh over the last week was on November 21st, when it was down for 45% of the day.
Rope Drop Downtime
Here are problematic offenders from the past week, with the percentage of downtime during the first hour of the day in parentheses:
- Magic Kingdom: Haunted Mansion (27%), Space Mountain (15%), The Many Adventures of Winnie the Pooh (12%), Magic Carpets (11%)
- EPCOT: Cosmic Rewind (24%), Spaceship Earth (21%), Living with the Land (14%), The Seas with Nemo (12%), Remy’s Ratatouille Adventure (10%)
- Hollywood Studios: Rock’n’Roller Coaster (34%), Rise of the Resistance (24%), Tower of Terror (10%)
- Animal Kingdom: Dinosaur (11%)
We’re in a weird upside down sort of week this week, regarding rope drop downtime. Overall, it’s not as bad as last week. But the attractions showing up on the list are different than normal! First, I have to give a shoutout to Tiana’s Bayou Adventure and Test Track for not being on the naughty list this week. I can’t remember the last time that happened, so it’s been a while. But our recently-reliable Cosmic Rewind had a bad rope drop week!
Wait Times November 18 – 24
Attractions with the Highest Average Posted Wait at Each Park
- EPCOT: Test Track, average posted wait of 69 minutes (was 74 minutes last week)
- Hollywood Studios: Slinky Dog Dash, average posted wait of 57 minutes (was 55 minutes last week)
- Magic Kingdom: TRON, average posted wait time of 56 minutes (was 54 minutes last week)
- Animal Kingdom: Flight of Passage, average posted wait time of 55 minutes (was 56 minutes last week)
Overall, our average waits at headliners were roughly equivalent to what we saw last week. But those overall numbers really do hide a bit of the true story, which was the first four days of the past week were totally empty (relatively speaking), and then things picked up headed into Thanksgiving week. As an example, here’s what the numbers would look like if we split them up into a tale of two half-weeks:
- Test Track: 57 minutes | 83 minutes
- Slinky Dog Dash: 51 minutes | 63 minutes
- TRON: 42 minutes | 72 minutes
- Flight of Passage: 36 minutes | 78 minutes
Parks with the Highest and Lowest Average Wait
- Highest: Hollywood Studios, average park-wide posted wait of 32 minutes (was 33 minutes last week)
- Lowest: Magic Kingdom, average park-wide posted wait of 20.5 minutes (was 22 minutes last week)
Once again, not any major shifts at the park level compared to last week. But let’s split it up by empty half-week and Thanksgiving half-week:
- Animal Kingdom: 19 minutes | 36 minutes
- EPCOT: 25 minutes | 35 minutes
- Hollywood Studios: 28 minutes | 36 minutes
- Magic Kingdom: 16.5 minutes | 25 minutes
Those are very different experiences depending on if you were visiting the week before Thanksgiving or the weekend before/week of Thanksgiving, especially at Animal Kingdom and Magic Kingdom.
Most Inflated Posted Wait Times
We all know that Disney inflates their posted wait times on purpose. They have many reasons for doing this. Some are totally understandable, and some are potentially more problematic. We can figure out how much posted wait times are being inflated by comparing submitted actual wait times from the Lines App and the posted wait time when the person timing their wait entered the line.
Over the past week, actual wait times in the Lines App averaged 70% of what was posted. That’s pretty close to our historical average in the era of Lightning Lanes. Overall, if the posted wait time at a popular attraction was 60 minutes, you could’ve expected to wait about 42 minutes instead.
But the worst inflation offender for the past two weeks was Under the Sea. At this one attraction, submitted actual wait times were only 25% of posted wait times in the past week. That means that if Under the Sea had a 20 minute posted wait, you probably would have actually only waited 5 minutes instead. A quarter of what was posted! Remember to always check the Lines app for predicted actual waits instead of making decisions based on what is posted.

This Week’s Wait Time Rock Star
Between November 18th and 24th, we had just over 1100 timed actual waits submitted through the Lines app. The one person who recorded the most actual waits during that time was QueenofHearts, with 42 overall timed waits – 22 Lightning Lane waits, 14 standby waits, and 6 single rider waits. Thanks for all of that timing, QueenofHearts! It unfortunately does not compete with the the 97 timed waits in a single week from our current timing champion, preef.
Looking Ahead: November 25 – Dec 1
I write this article on Tuesday evenings so that you all have the very freshest of data on Wednesdays. That means the 25th will already be in the past by the time you’ve read this, so you’re time travelling!
Party dates to consider: Jollywood Nights will be at Hollywood Studios on November 29th and December 1st. Based on recent trends, that should mean that the 30th is more crowded at Hollywood Studios than we might expect. Even more importantly, Mickey’s Very Merry Christmas Party will mean Magic Kingdom closes early to guests on the 25th, 26th, 28th, and 30th (plus December 2nd). This should mean that the 27th is pretty crowded compared to surrounding days.
Otherwise, crowd levels should stay slightly elevated until Thanksgiving, and then drop back down. This almost always happens as soon as Thanksgiving actually rolls around. Historically, the weekend after Thanksgiving through mid-December has pretty low crowds.
The weather for this week looks mostly glorious – generally, highs in the mid-70s or low 80s with plenty of sun. But my one call-out is Friday, the 28th. It’s going to be in the 40s that morning, and the high is “only” 65. Usually when we see temperatures dip that low, some attractions have problems with unexpected downtime. So bundle up and pack your patience that day if you’re in the parks.
This is one of those fun times where I’ll be in the park in the next week! I’ll be in Orlando November 30 – December 2 running a very fun super-secret experiment with a dear friend (more on that in the next edition), and attending Mickey’s Very Merry Christmas Party (for the first time ever) AND Jollywood Nights (for the third year in a row). If you see me, please say hello!
Were you in the parks this past week? Or are you headed to Orlando soon? Let me know in the comments below!
You May Also Like...
-

After a quick little three month break ... we're back! I apologize for the hiatus, but we're just in time to…
-

Veterans Day week at Walt Disney World came with exactly the kind of whiplash we should expect by now: a busy…