Disney Data Dump October 1 2025
After a few weeks of slight wait time increases compared to our early September lows, things settled back down a little this past week. Don’t get too comfortable, though! Fall is officially here, which means breaks, long weekends, and the annual return of bigger crowds. Saturdays in particular are starting to stand out as busier than the rest of the week, a trend I’ll be watching closely as October kicks off. Let’s dive into the data together!
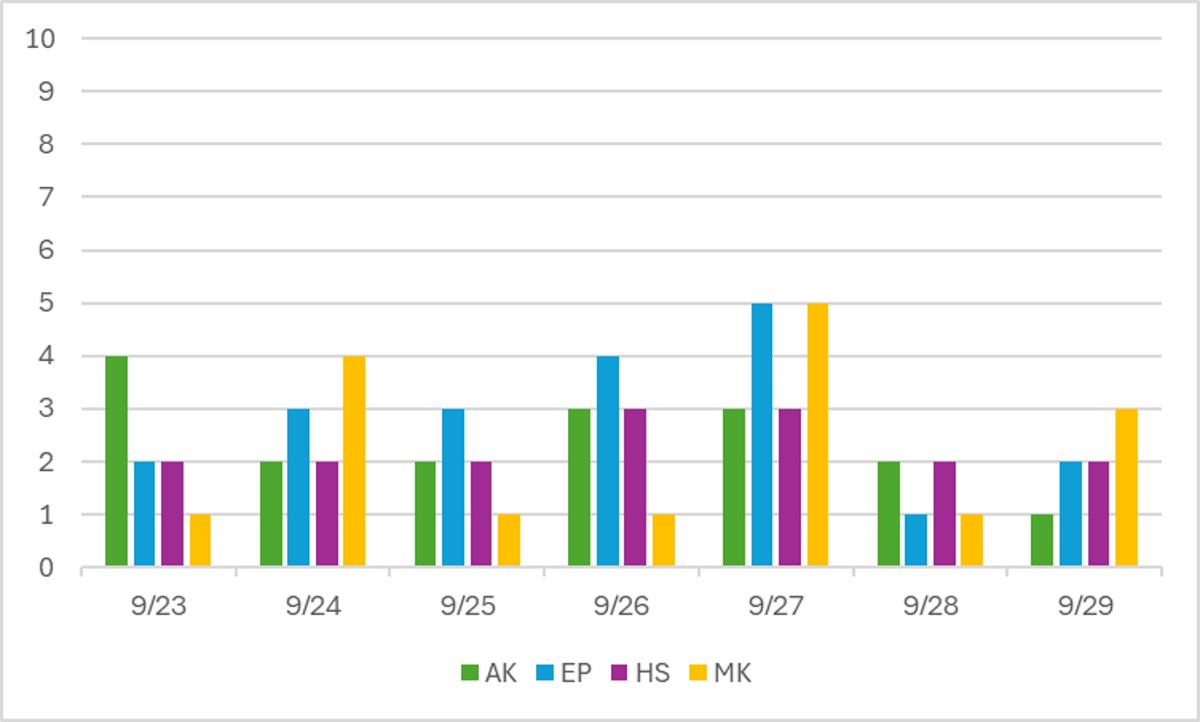
Observed Crowd Levels September 23 – 29
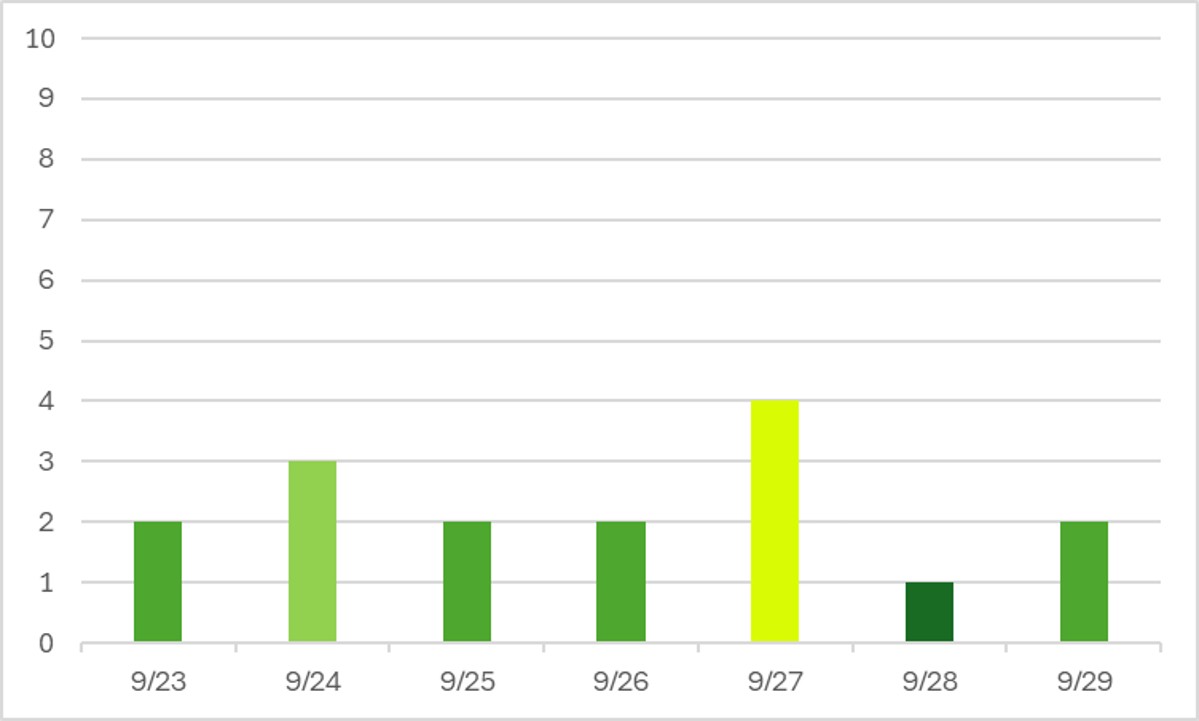
Alright, so our spikes from last week have calmed back down. But don’t get used to it. It’s officially fall, y’all. And with that comes fall breaks. Even 3- or 4-day weekends bring more families down to Orlando to enjoy the parks in the “cooler” temps. Still nothing crazy, but maybe some more 3-5 crowd levels, especially on weekends. Saturdays have easily been the most crowded day of the week for the past few weeks, and I expect that trend to continue.
Let’s play our weekly game of “when were the Magic Kingdom parties?” … I’ll wait.
If you guessed the 23rd, 25th, 26th, and 28th, you were correct! We’re in that time of year where a party day vs a non-party day at Magic Kingdom makes a 3- or 4-crowd level difference, which has a big impact on wait times. We also see EPCOT emptying out during the week, but filling up on weekends thanks to Food & Wine festival. Help yourself out and plan your EPCOT visit for a weekday if possible this fall.
Performance of Crowd Level Predictions
Each week, I give you a very transparent look into how the TouringPlans crowd level predictions performed. Each day at each park is one data point, so each week we have 28 different crowd level predictions to evaluate. Any time a prediction is within one or two crowd levels, things won’t really “feel” much different than what was predicted. Being off by 3 or more crowd levels is where you might feel that difference in wait times throughout the day.
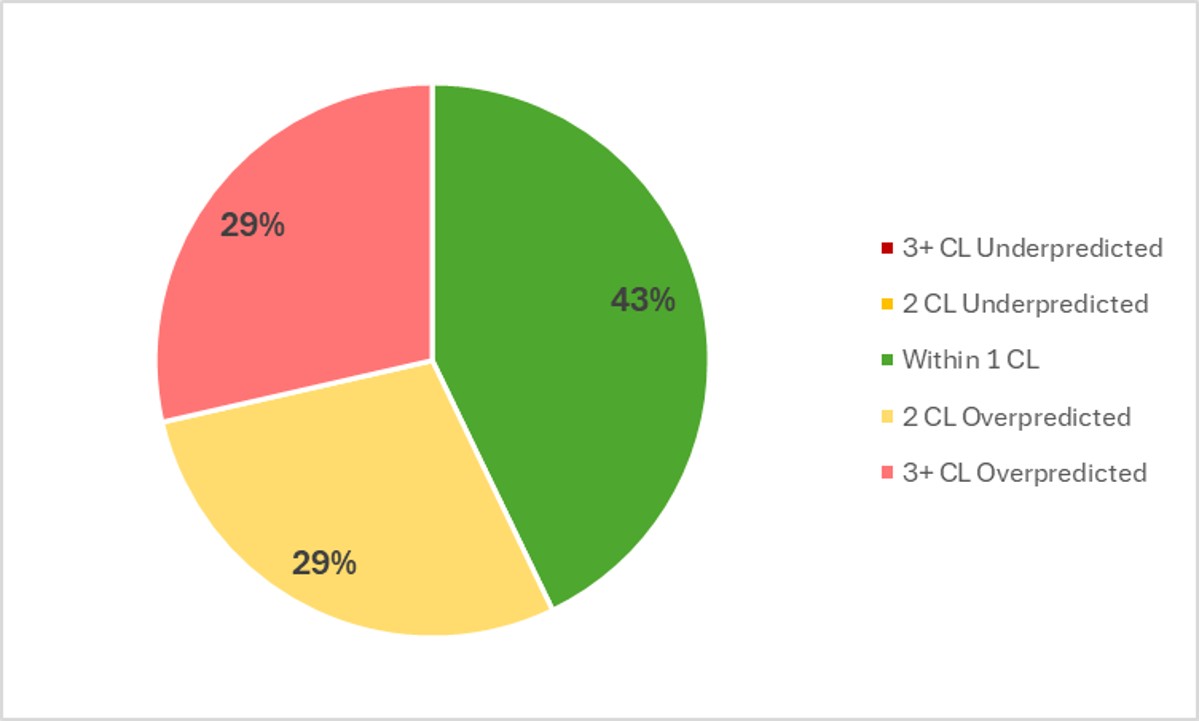
In the past week, Touring Plans predictions were either spot-on or within 1 crowd level 43% of the time, which is slightly lower than the past couple of weeks. 71% of the time Touring Plans predictions were within 2 crowd levels, so that means we get a C- for our predictions in the past week. On average, the crowd level at any park any day of the week was 1.8 crowd levels below prediction. That’s twice the error rate from last week, and it’s close to a noticeable difference every day in every park. The biggest miss of the week was an overprediction by 5 crowd levels, at EPCOT on the 28th. The prediction for EPCOT was a crowd level 6, but the park only got to a crowd level 1. Every park emptied out on Sunday, but EPCOT was especially easy to tour.
Attraction Downtime September 23 – 29
If we average all of the capacity lost due to unexpected downtime over the past week, it comes out to 4.7% of attractions unexpectedly being down. That’s almost right at our historical average. It’ll be interesting to see where that number heads in the next week with plenty of rain related to tropical weather in the Atlantic. In the past week, Animal Kingdom was the park with the most overall downtime, averaging 5.7% of its capacity lost to downtime throughout the week.
The worst day for attraction downtime in the past week was on September 23rd. On that day, 7% of all capacity at WDW was lost due to unexpected downtime. The worst park-day of the week was actually on September 24th at Animal Kingdom. On that day, 13% of its attraction capacity was lost due to unexpected downtime. Animal Kingdom was open for 10 hours on the 24th, so 13% downtime is the equivalent of the entire park shutting down for 78 minutes – well over an hour.
Attraction Downtime Worst Offender
In the past week, Test Track was the WDW attraction with the worst overall downtime. It was unexpectedly down for 20% of the past week. This is a small increase compared to our 14% average over the past 3 weeks. Boo. Dislike having this newly reopened headliner almost always at the top of this list. The worst day at Test Track was on September 23rd, when it was down for 36% of the day. But there were a couple of other days where it had 20+% downtime too.
Rope Drop Downtime
Here are problematic offenders from the past week, with the percentage of downtime during the first hour of the day in parentheses:
- Magic Kingdom: Tiana’s Bayou Adventure (40%), Space Mountain (15%), Haunted Mansion (12%)
- EPCOT: Test Track (33%), Gran Fiesta Tour (20%), Journey Into Imagination (16%), Frozen Ever After (12%), Remy’s Ratatouille Adventure (11%)
- Hollywood Studios: Millennium Falcon (24%), Rise of the Resistance (23%), Rock’n’Roller Coaster (15%)
- Animal Kingdom: No rope drop downtime issues!
EPCOT. Why you do this to us? Magic Kingdom finally almost cleared its rope drop issues list, and EPCOT said “Hold my [Food &] Wine.” Almost every headliner shows up on this list for EPCOT, other than Cosmic Rewind.
Hollywood Studios isn’t much better this week. It’s good to not see Slinky, Runaway Railway, or Tower of Terror. But it was a rough week for Star Wars rope droppers.
Gold star again this week for Animal Kingdom. Love a reliable park in the morning.
Wait Times September 23 – 29
Attractions with the Highest Average Posted Wait at Each Park
- EPCOT: Test Track, average posted wait of 78 minutes (was 78 minutes last week too)
- Hollywood Studios: Slinky Dog Dash, average posted wait of 57 minutes (was 54 minutes last week)
- Magic Kingdom: TRON, average posted wait time of 55 minutes (was 60 minutes last week)
- Animal Kingdom: Flight of Passage, average posted wait time of 48 minutes (was 57 minutes last week)
I guess everyone abandoned Animal Kingdom this past week. Do y’all need me to do more posts about why Animal Kingdom is the best?! Actually, it’s ok, we’ll keep it to ourselves and enjoy the low waits and empty animal trails. Other than the big drop in posted waits at Flight of Passage, wait times at all headliners stayed pretty flat or decreased by just a little. EPCOT continues to have a lot of high waits – three of the top five average posted waits this week at Test Track, Cosmic Rewind (#2, at 69 minutes), and Remy (#5, at 48 minutes).
Parks with the Highest and Lowest Average Wait
These parks likely won’t change week-to-week unless something crazy happens, but these data points will give us a high-level view of how wait times are trending from week to week.
- Highest: EPCOT, average park-wide posted wait of 31 minutes (was 34 minutes last week)
- Lowest: Magic Kingdom, average park-wide posted wait of 19 minutes (was 20 minutes last week)
Those big headliner waits are enough to give EPCOT the “win” for top overall average waits of the week. All other parks were under the half-hour mark. Because Lightning Lane Multi-Pass is also difficult to use at EPCOT (thanks to early sell-outs and long walks between headliners), this easily makes EPCOT the most tricky park to tour right now.
Most Inflated Posted Wait Times
We all know that Disney inflates their posted wait times on purpose. They have many reasons for doing this. Some are totally understandable, and some are potentially more problematic. We can figure out how much posted wait times are being inflated by comparing submitted actual wait times from the Lines App and the posted wait time when the person timing their wait entered the line.
Over the past week, actual wait times in the Lines App averaged 66% of what was posted. That’s a little lower than our historical average. That means posted waits slightly more inflated than normal, so actual waits were even lower than the crowd levels make it seem. Overall, if the posted wait time at a popular attraction was 60 minutes, you could’ve expected to wait less than 40 minutes instead.
But the worst inflation offender for the past week was Under the Sea. At this one attraction, submitted actual wait times were only 33% of posted wait times in the past week. That means that if Under the Sea had a 15 minute posted wait, you probably would have actually only waited about 5 minutes instead. A third of what was posted! Remember to always check the Lines app for predicted actual waits instead of making decisions based on what is posted.

This Week’s Wait Time Rock Star
Between September 23rd and 29th, we had just over 1000 timed actual waits submitted through the Lines app. The one person who recorded the most actual waits during that time was OwenMyke, with 38 overall timed waits – and they were all standby waits. Thanks for all of that timing, Owen Myke! It unfortunately does not compete with the the 97 timed waits in a single week from our current timing champion, preef.
Looking Ahead: September 30 – October 6
I write this article on Tuesday evenings so that you all have the very freshest of data on Wednesdays. That means the 30th will already be in the past by the time you’ve read this, so congratulations on conquering time travel!
Once again, the biggest driver of crowd patterns this week is going to be Mickey’s Not So Scary Halloween Party. Party dates are September 30th and October 2nd, 3rd, and 5th (as well as the 7th, which falls outside of this look-forward, but will impact crowds on the 6th). That means October 1st and 4th are each surrounded by three party days. I’m going to go ahead and call out October 4th as an avoid-Magic-Kingdom-at-all-costs day. Saturdays have been the most crowded days of the week for a while now, and it’s a non-party day surrounded by three party days. Everyone and their friends and their enemies are all going to be headed to Magic Kingdom that day. Disney knows it, and they’ve got a very rare schedule of 8 am opening to 11 pm closing for that day.
Our other sign of Disney predicting crowds is Animal Kingdom staying open until the late late hour of 7 pm this coming weekend. Those later afternoon and early evening hours at Animal Kingdom are some of my favorite times in any park, because almost everyone has finished up their AK day and hops away to another park. Zig when they zag, stay for the evening, and enjoy your time.
Weather this week isn’t looking super spectacular. There look to be plenty of scattered showers and storms every day. But you know what they say – a rainy day at Disney is better than any day at home. If you prepare. Pack dry socks and shoes along with you and change after the storms pass by. Do outdoor attractions in the morning before they might shut down.
Were you in the parks this past week? Or are you headed to Orlando soon? Let me know in the comments below!
You May Also Like...
-

Welcome to June, and to the first full week of Cool Kid Summer at Walt Disney World! With new deals in…
-

For the first time ever, this week’s Data Dump comes to you from the back porch of Jambo House, with giraffes…