
Disney Data Dump October 22 2025
If you were in Magic Kingdom on October 15th, congratulations (?) … you survived the most crowded day of the year. Fall break season hit its final crescendo, and it hit hard. That single Wednesday brought a crowd level 9 in a sea of 2s and 3s, proving just how powerful the combination of long weekends and non-party days can be. Thankfully, the week ended on a much calmer note, with lighter crowds hinting that the worst of fall break may finally be behind us. At least until Jersey Week. Let’s dive into the data together!
Observed Crowd Levels October 14 – 20
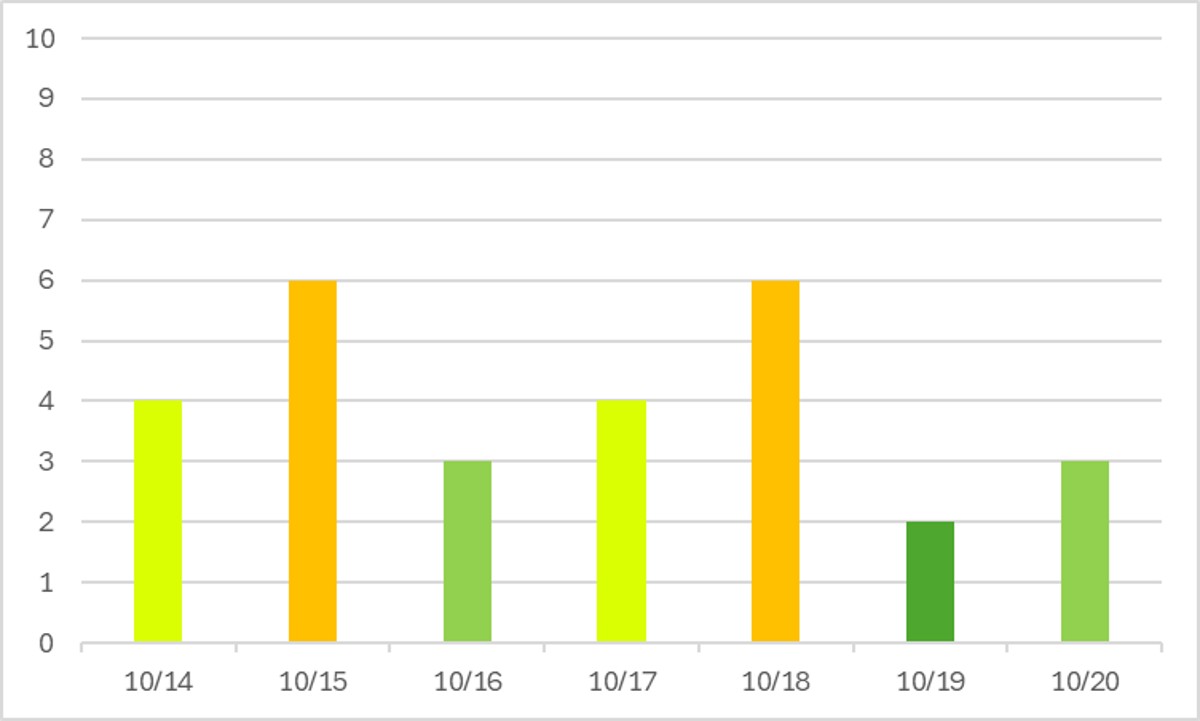
It’s fall and we’ve still got orange bars showing up thanks to fall breaks and the resulting “crowds” (clearly when we’re topping out at crowd level 6, it’s not ALL that crowded. But it’s much different than the numbers we were seeing this summer and through September.
We’re back for our weekly game of “when were the Magic Kingdom parties?” The answers are once again obvious this week.
If you guessed the 14th, 16th, 17th and 19th, you were correct! Look at Magic Kingdom on the 14th, 15th, and 16th. On party days Magic Kingdom was only a crowd level 2. But on the 15th? A crowd level 9! This was the most crowded day of the year at Magic Kingdom. The difference between a crowd level 2 and 9 is close to 6 hours of additional waiting for just 12 popular attractions. It’s crazy different.
But on the 19th and 20th things start to calm down everywhere. The 20th wasn’t even a party day, and it was still just a crowd level 4. This seems to indicate that fall break season is over, and we might have just a bit of breathing room before some more crowds descend.
Performance of Crowd Level Predictions
Each week, I give you a very transparent look into how the TouringPlans crowd level predictions performed. Each day at each park is one data point, so each week we have 28 different crowd level predictions to evaluate. Any time a prediction is within one or two crowd levels, things won’t really “feel” much different than what was predicted. Being off by 3 or more crowd levels is where you might feel that difference in wait times throughout the day.
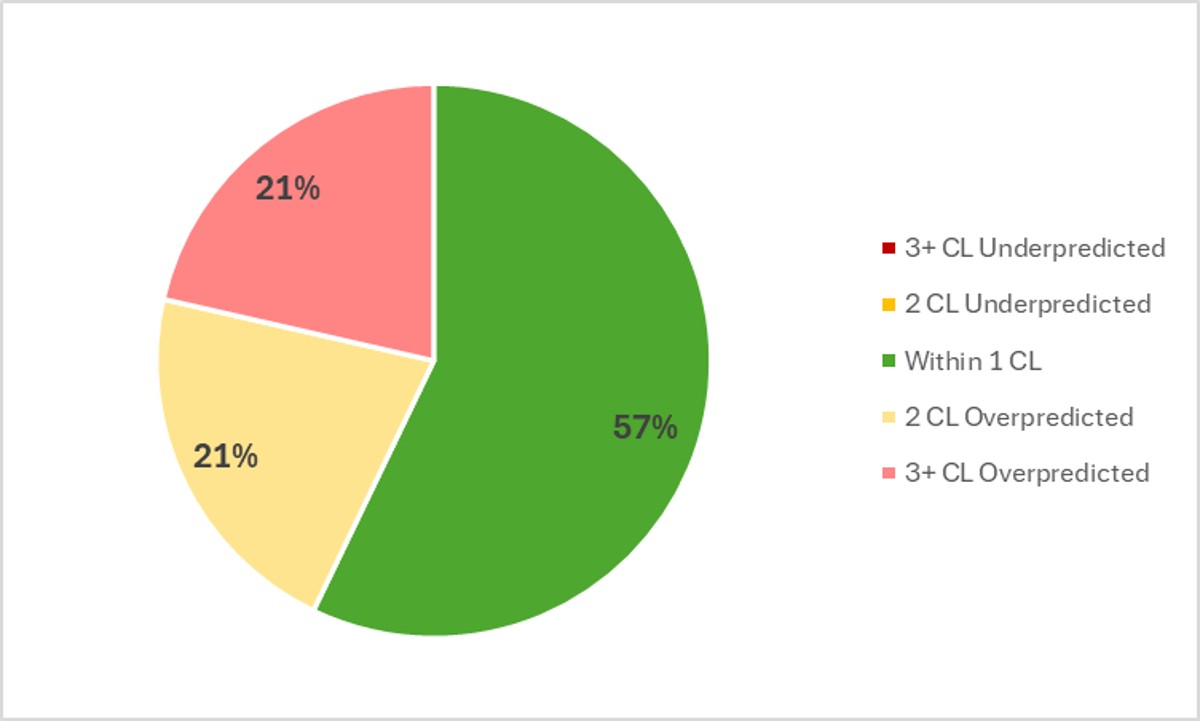
In the past week, Touring Plans predictions were either spot-on or within 1 crowd level 57% of the time, which is slightly better than the past few weeks. 79% of the time Touring Plans predictions were within 2 crowd levels, so that means we get a C+ for our predictions in the past week. That’s clearly not as good as the A- from last week, but still better than average for this year. All of the biggest misses of the week were overpredictions of 3 crowd levels, and it happened 6 times – on the 18th at Magic Kingdom, on the 19th at Animal Kingdom and Hollywood Studios, and on the 20th at Animal Kingdom, Hollywood Studios AND EPCOT.
Attraction Downtime October 14 – 20
If we average all of the capacity lost due to unexpected downtime over the past week, it comes out to 3% of attractions unexpectedly being down. That’s one of the lowest results we’ve ever seen! In the past week, Hollywood Studios was the park with the most overall downtime, averaging 3.9% of its capacity lost to downtime throughout the week. Once again, that’s one of the very lowest “winning” numbers that we’ve ever seen for a park with the most downtime for the week. It was a good week for avoiding unexpected ride closures.
The worst day for attraction downtime in the past week was on October 15th. On that day, 4% of all capacity at WDW was lost due to unexpected downtime. But the worst park-day of the week was at Hollywood Studios on October 14th. On that days, 6% of its attraction capacity was lost due to unexpected downtime. I know for a fact that’s the lowest number we’ve ever seen for this category in the history of the Disney Data Dump. Hollywood Studios was open for 12 hours on the 14th, so 6% downtime is the equivalent of the entire park shutting down for over 43 minutes that day. Not too shabby.
Attraction Downtime Worst Offender
In the past week, Tiana’s Bayou Adventure was the WDW attraction with the worst overall downtime. It was unexpectedly down for 21% of the past week. But you know what I’m even more excited about? The fact that Test Track only had 3% downtime this week. That’s by far the lowest downtime that we’ve seen for our most unreliable attraction. But Tiana’s is pretty regularly in the 10-20% range. The worst day at Tiana this week was easily on October 15th, when it was down for 72% of the day. That certainly didn’t help distribute crowds on Magic Kingdom’s crowd level 9 day!

Rope Drop Downtime
Here are problematic offenders from the past week, with the percentage of downtime during the first hour of the day in parentheses:
- Magic Kingdom: Tiana’s Bayou Adventure (21%), Under the Sea (21%), Haunted Mansion (15%)
- EPCOT: Remy’s Ratatouille Adventure (24%), Mission: Space (11%)
- Hollywood Studios: Rise of the Resistance (41%), Runaway Railway (15%), Millennium Falcon (13%)
- Animal Kingdom: No rope drop downtime issues!
Ohhhhhhh Rise of the Resistance. What are you doing to us? 41% rope drop downtime is huge. And pretty rare for recent history.
The other note here is that Remy has been showing up rather frequently, usually in the 20-25% downtime range. That’s not a good trend for International Gateway rope droppers!
Otherwise, it was not a terrible rope drop week anyway. Gold star goes to Animal Kingdom!
Wait Times October 14 – 20
Attractions with the Highest Average Posted Wait at Each Park
- EPCOT: Cosmic Rewind, average posted wait of 77 minutes (was 93 minutes last week)
- Hollywood Studios: Slinky Dog Dash, average posted wait of 69 minutes (was 79 minutes last week)
- Magic Kingdom: TRON, average posted wait time of 66 minutes (was 71 minutes last week)
- Animal Kingdom: Flight of Passage, average posted wait time of 62 minutes (was 75 minutes last week)
So we saw some easing off of the really peak wait times of last week – but there are still a bunch of headliners that saw their average posted waits stay over an hour this week. These numbers were higher earlier in the week, and have been trending down in the last day or two.
Parks with the Highest and Lowest Average Wait
These parks likely won’t change week-to-week unless something crazy happens, but these data points will give us a high-level view of how wait times are trending from week to week.
- Highest: Hollywood Studios, average park-wide posted wait of 37 minutes (was 41 minutes last week)
- Lowest: Magic Kingdom, average park-wide posted wait of 22.5 minutes (was 25 minutes last week)
Hollywood Studios thankfully dipped back down below 40 minutes for its overall average posted wait this week. But Animal Kingdom, EPCOT and Hollywood Studios all had pretty similar average wait times. Magic Kingdom also decreased just slightly even with its most crowded day of the year happening this week.
Most Inflated Posted Wait Times
We all know that Disney inflates their posted wait times on purpose. They have many reasons for doing this. Some are totally understandable, and some are potentially more problematic. We can figure out how much posted wait times are being inflated by comparing submitted actual wait times from the Lines App and the posted wait time when the person timing their wait entered the line.
Over the past week, actual wait times in the Lines App averaged 72% of what was posted. That’s still higher than our historical average, but quite a bit lower than last week. Overall, if the posted wait time at a popular attraction was 60 minutes, you could’ve expected to wait about 43 minutes instead.
But the worst inflation offender for the past week was Spaceship Earth (which just reopened early after its refurbishment!). At this one attraction, submitted actual wait times were only 27% of posted wait times in the past week. That means that if Spaceship Earth had a 20 minute posted wait, you probably would have actually only waited about 5 minutes instead. Just about a quarter of what was posted! Remember to always check the Lines app for predicted actual waits instead of making decisions based on what is posted.

This Week’s Wait Time Rock Star
Between October 14th and 20th, we had just under 1200 timed actual waits submitted through the Lines app. The one person who recorded the most actual waits during that time was sjp.17, with 21 overall timed waits, and they were all standby waits! Hard mode! Thanks for all of that timing, sjp.17! It unfortunately does not compete with the the 97 timed waits in a single week from our current timing champion, preef.
Looking Ahead: October 21 – 27
I write this article on Tuesday evenings so that you all have the very freshest of data on Wednesdays. That means the 21st will already be in the past by the time you’ve read this, so you’re back to the future!
We all know what the biggest driver of crowd patterns this week is going to be, right? Yes, Becky, we read this every week. Good, I’ve trained you well. It’s Mickey’s Not So Scary Halloween Party. Party dates are October 23rd, 24th and 26th. But I’ve actually got a sneaky crowd driver impact this week too. Magic Kingdom is also closing early on the 21st, but not for a Halloween Party – it’s being rented out for a private event. I can’t even fathom how much that would cost, right in the middle of party season when the park is already closing early far too frequently (in my humble opinion). So you can expect the biggest Magic Kingdom crowds of the week on the 25th. Disney also expects crowds to be high on the 25th because they’ve extended Magic Kingdom and Animal Kingdom hours. That’s the only day that’s happening this week.
It’s looking like another gorgeous weather week in Orlando! Highs in the low- to mid-80s and plenty of sun. Enjoy your time in the not-rainy, not-surface-of-the-sun parks if you’re there this week!
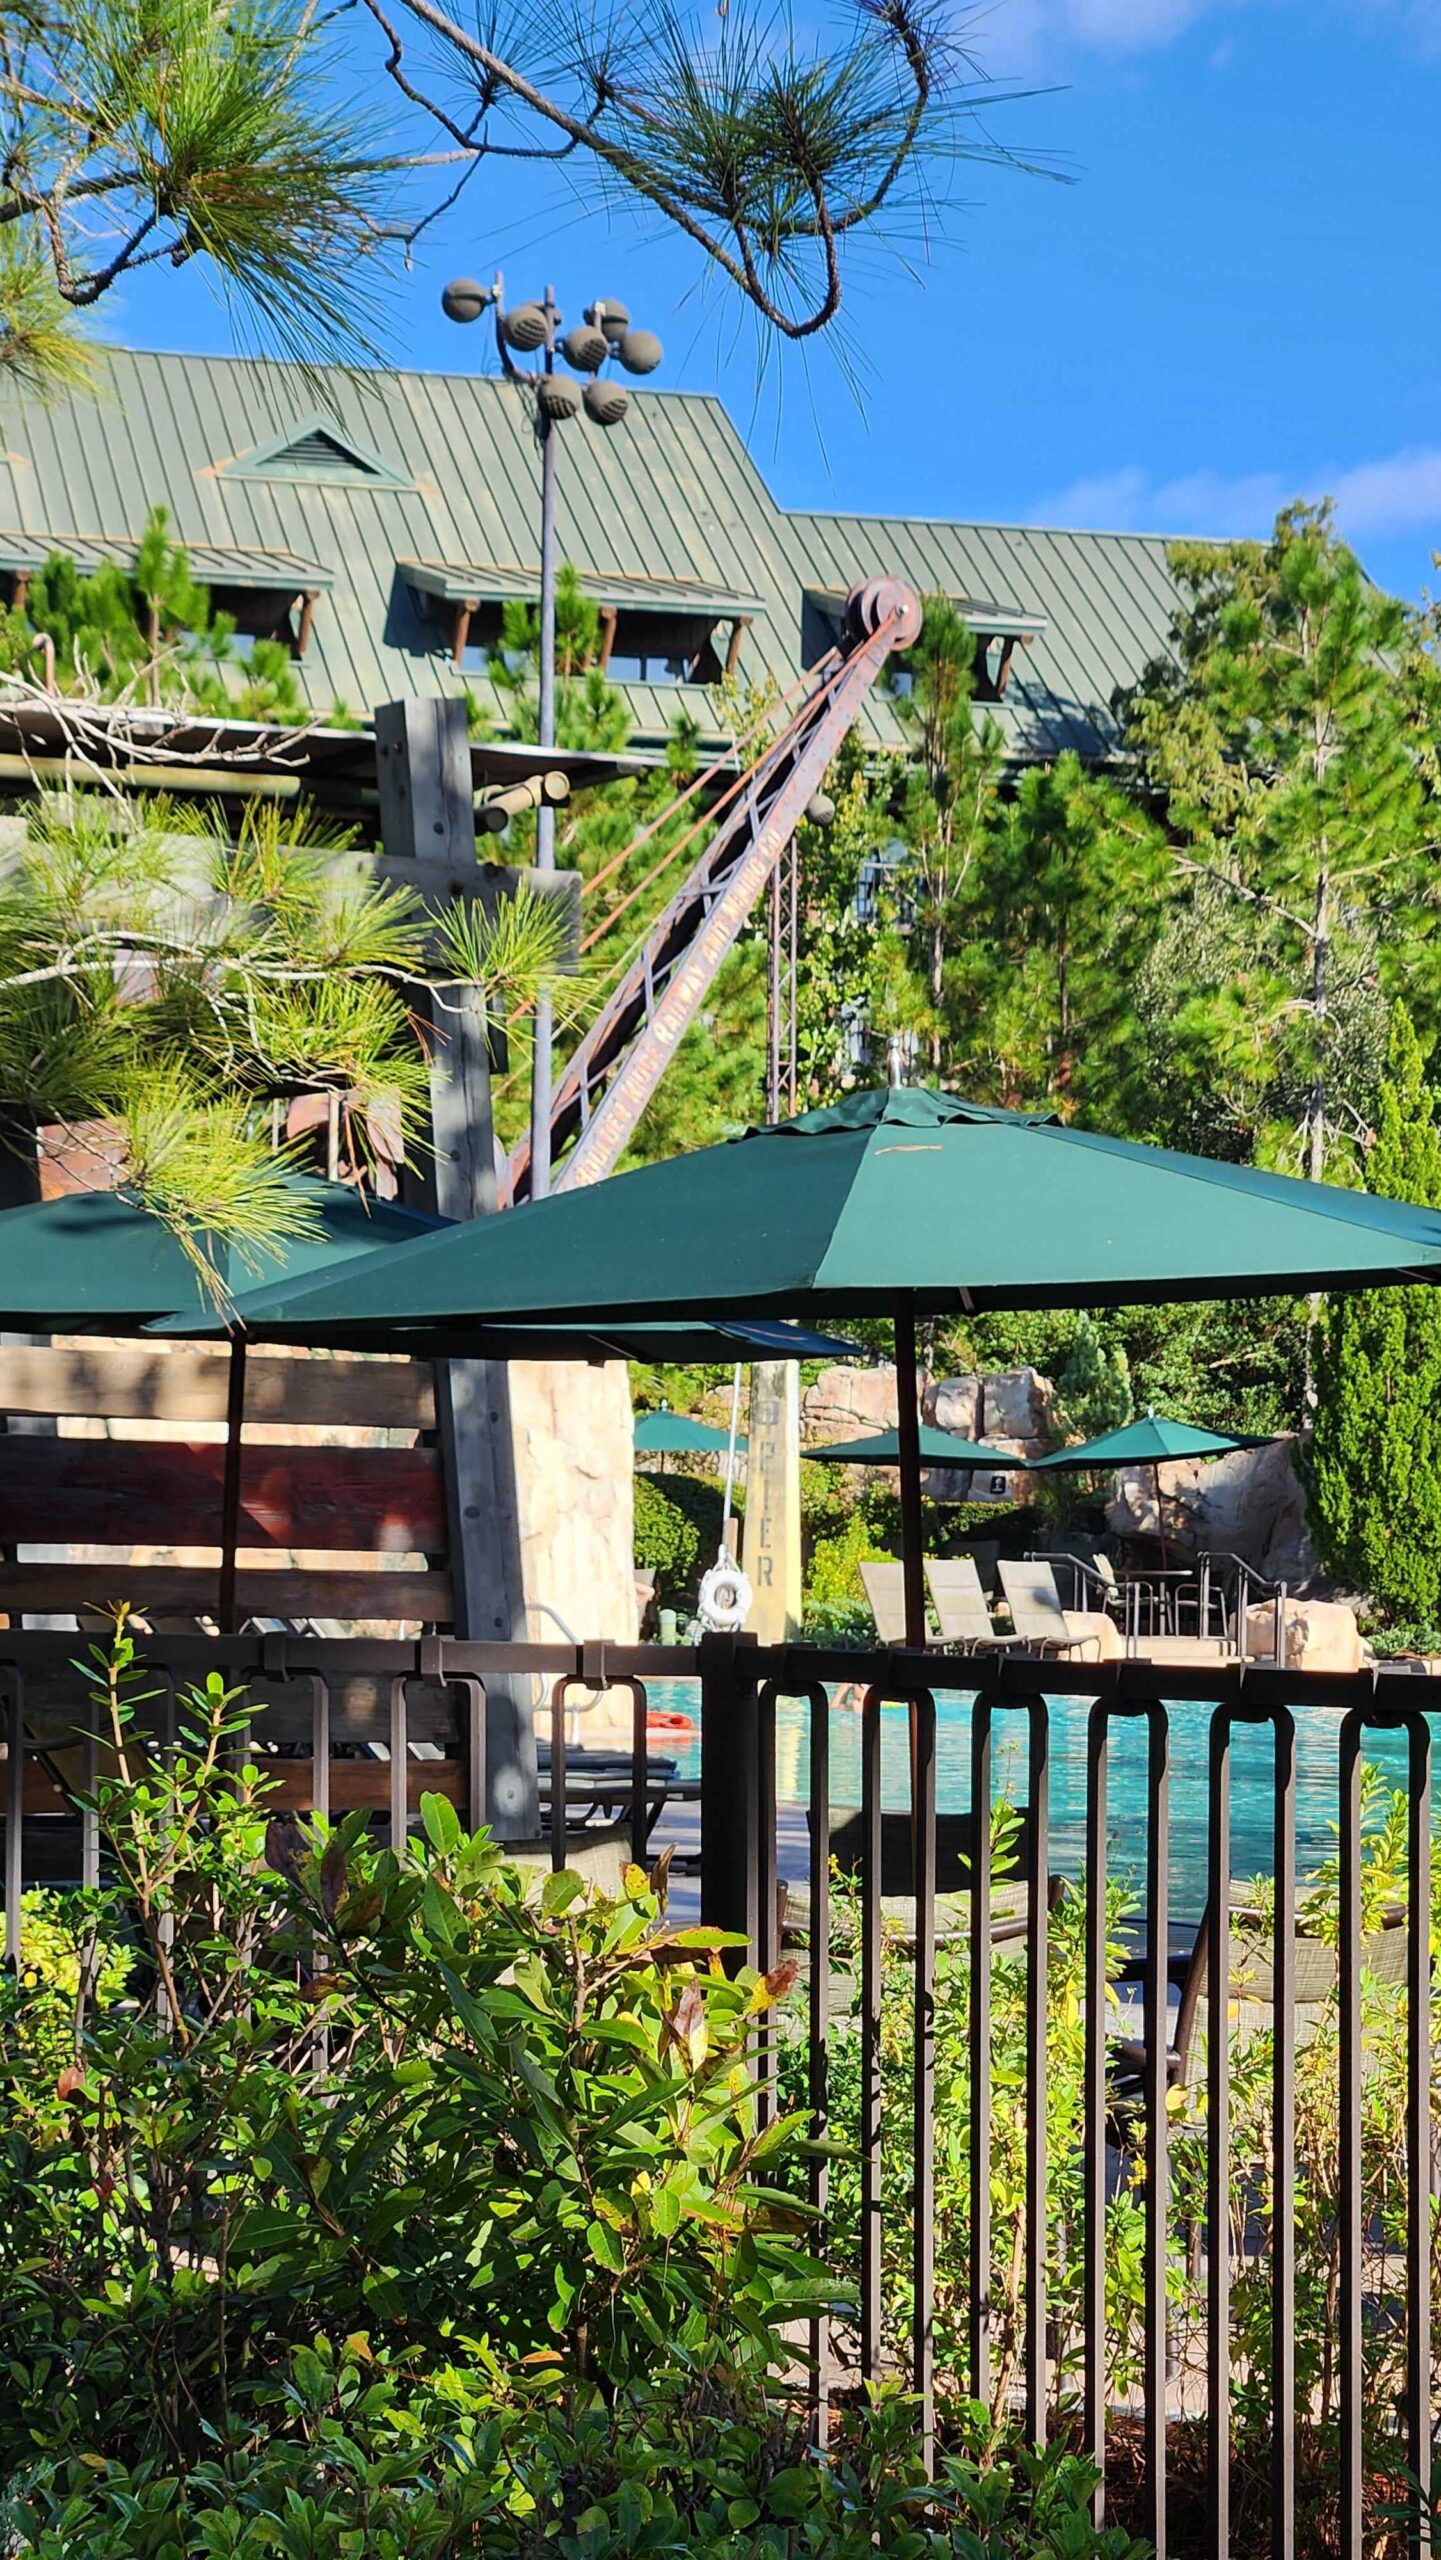
My husband and I just got back from a no-kids weekend at the Wilderness Lodge, and it was our first club level stay! What a glorious weekend to relax at the Lodge and enjoy plenty of great weather, great service, great food, and unbeatable views. The cover photo for this week’s post is the view from our room (7056 if you’re doing a club level stay and you’re interesting in requesting it). Would I do another club level stay? Not in the near future. And probably only for adults-only short trips where we don’t plan on going to the parks. You’ve got to be in the lounge and doing a lot of eating and drinking there to make it even close to “worth” the money. But it was a nice rare splurge.
The highlight of the weekend was an Art and Architecture tour with Ranger Alan at the Lodge. Alan gives this tour on Saturdays and Sundays (another cast member leads the tour during the week). And my one-hour tour turned into a _fascinating_ 2+ hour tour and conversation with this treasure of a human being. One of my favorite tidbits – the rig and a couple of water tanks in the Boulder Ridge Villas pool are actually relocated from the old Backlot Tour at Hollywood Studios! That tour was one of my favorite Disney attractions, and so to know that I can still visit parts of the set is pretty special.
Were you in the parks this past week? Or are you headed to Orlando soon? Let me know in the comments below!
You May Also Like...
-

Well, that escalated quickly. After weeks of slow climbs and small spikes, this weekend’s crowds at Walt Disney World came in…
-

It was the best of times, it was the worst of times … or at least some of the most crowded…
You call October 15th “that single Monday.” My calendar shows it was a Wednesday. And the fact it was a Wednesday weakens your argument that it was so crowded that day due to the combination of the “long weekend” and a non-party day.
Well, that’s just a symptom of writing my intro at 4 am before a travel day today 🙂 Thank you for the catch. But the long weekend and non-party day argument still stands. Long weekends in the fall encourage week-long family vacations. And since the 13th was a holiday, lots of schools had long weekends which resulted in a travel surge.