
Disney Data Dump October 29 2025
After a couple of weeks of orange bars and fall breaks, it’s like someone hit the pause button at Walt Disney World this week. Or reset? The crowds are gone, the weather’s fantastic, and the parks are breathing again … at least for a moment. This late-October lull is the sweet spot between fall break and Jersey Week, when those in the know can enjoy low waits and mild temperatures before the holiday hustle begins. Let’s see what this week looked like and what it means for the rest of October and early November.
Observed Crowd Levels October 21 – 27
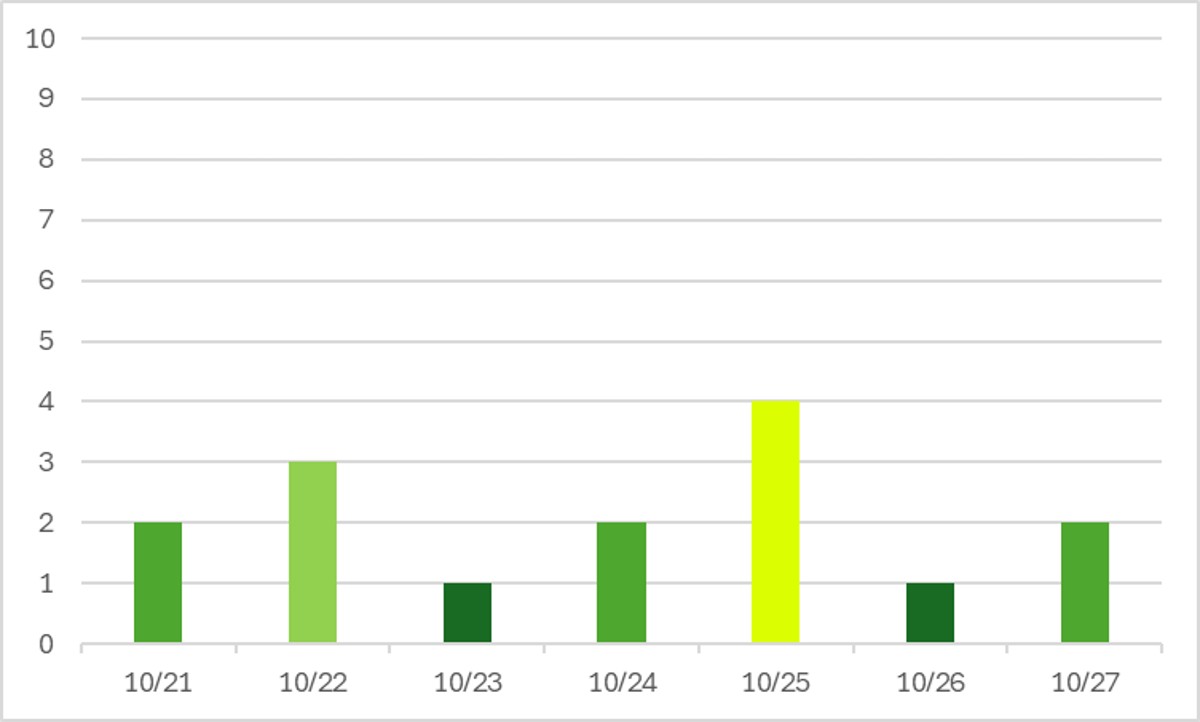
Aaaaaaaand we’re back to all green! Fall break season is on break (see what I did there?) between the October long weekends we usually see in the Midwest and Jersey Week in early November. If you’re not tied to school schedules, or you don’t mind taking your kids out of school, this late October season is a good balance of moderate temperatures and moderate (or moderate-to-low) crowds.
Welcome back to this week’s edition of “when were the Magic Kingdom parties?” With lower overall crowds, answers become less obvious.
This week the answers are the 23rd, 24th, and 26th. But the 21st is sneaky because the park closed early that day too. It was just for a private park buy-out instead of a Halloween party.
The 21st, 23rd, 26th and 27th show that crowds are back to being really low. The 27th was a non-party day at Magic Kingdom and it still didn’t get above a crowd level 2.
Performance of Crowd Level Predictions
Each week, I give you a very transparent look into how the TouringPlans crowd level predictions performed. Each day at each park is one data point, so each week we have 28 different crowd level predictions to evaluate. Any time a prediction is within one or two crowd levels, things won’t really “feel” much different than what was predicted. Being off by 3 or more crowd levels is where you might feel that difference in wait times throughout the day.
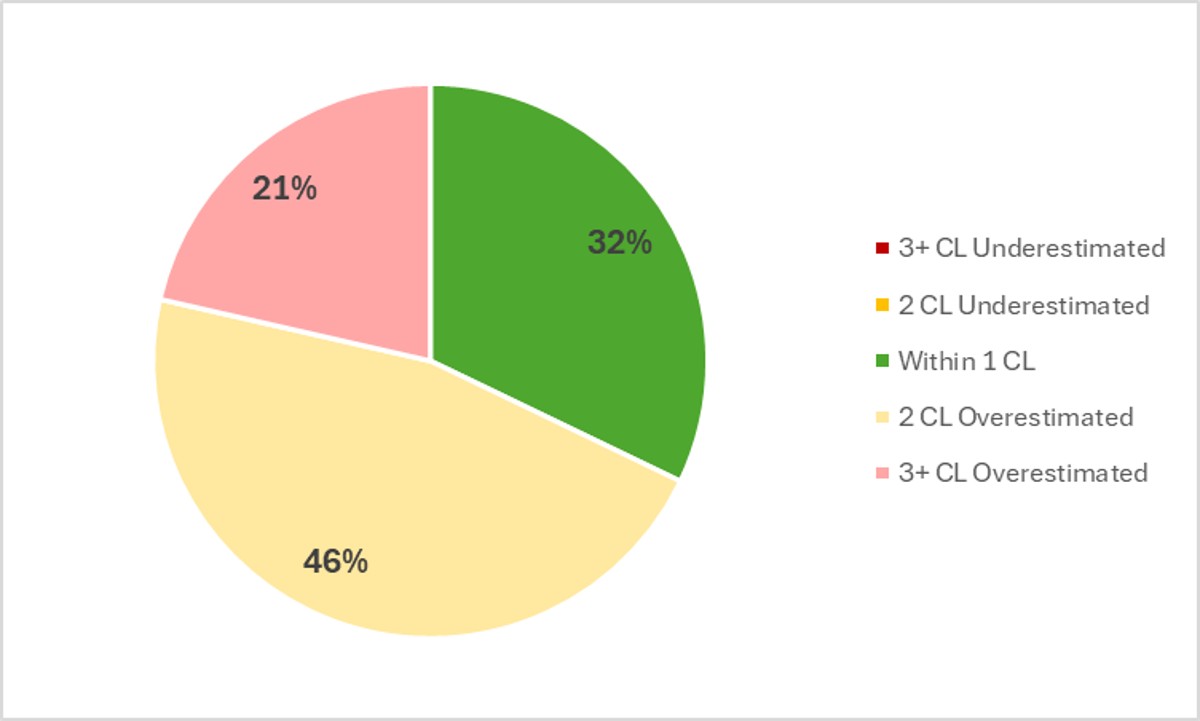
In the past week, Touring Plans predictions were either spot-on or within 1 crowd level 32% of the time, which is back to the lows we saw through this spring and summer. 79% of the time Touring Plans predictions were within 2 crowd levels, so that means we get a C+ for our predictions in the past week. That’s the same result as last week. And like our results from earlier this year, all misses were overpredictions. On average, any park you visited this week would’ve been 1.9 crowd levels below what was predicted. The biggest miss of the week was an overprediction of 5 crowd levels, which happened at Magic Kingdom on the 27th. It was a non-party day, and Touring Plans predicted a crowd level 7, but it only ended up being a crowd level 2.
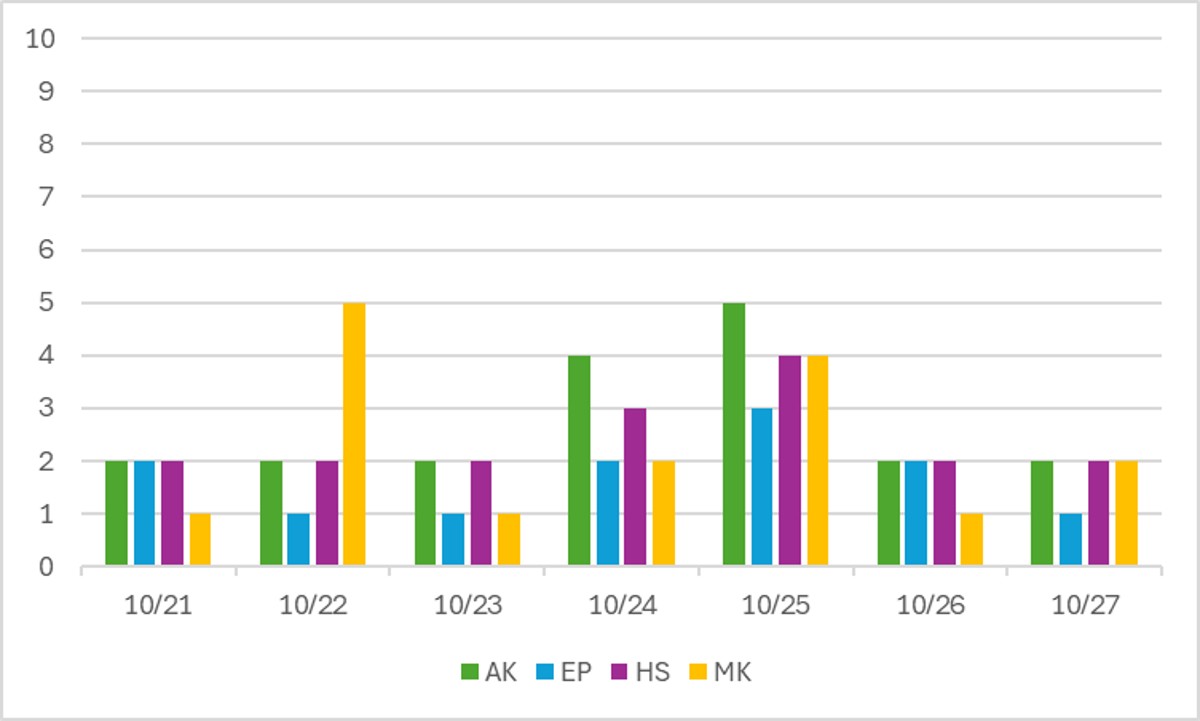
Attraction Downtime October 21 – 27
If we average all of the capacity lost due to unexpected downtime over the past week, it comes out to 5.3% of attractions unexpectedly being down. That’s back up to a little over average, and a significant increase compared to the past couple of weeks. In the past week, Magic Kingdom was the park with the most overall downtime, averaging 5.7% of its capacity lost to downtime throughout the week. Not a terrible “winning” number – all parks were pretty tightly clustered around that.
The worst day for attraction downtime in the past week was on October 26th. On that day, 7% of all capacity at WDW was lost due to unexpected downtime. And the worst park-day of the week was a tie! It happened at both Hollywood Studios and EPCOT on October 26th. On that day, 11% of both parks’ attraction capacity was lost due to unexpected downtime. Hollywood Studios was open for 12 hours on the 26th, so 11% downtime is the equivalent of the entire park shutting down for almost 80 minutes that day. EPCOT was only open for 11 hours on the 26th thanks to the runDisney weekend, so 11% downtime there is like the entire park shutting down for over 72 minutes.
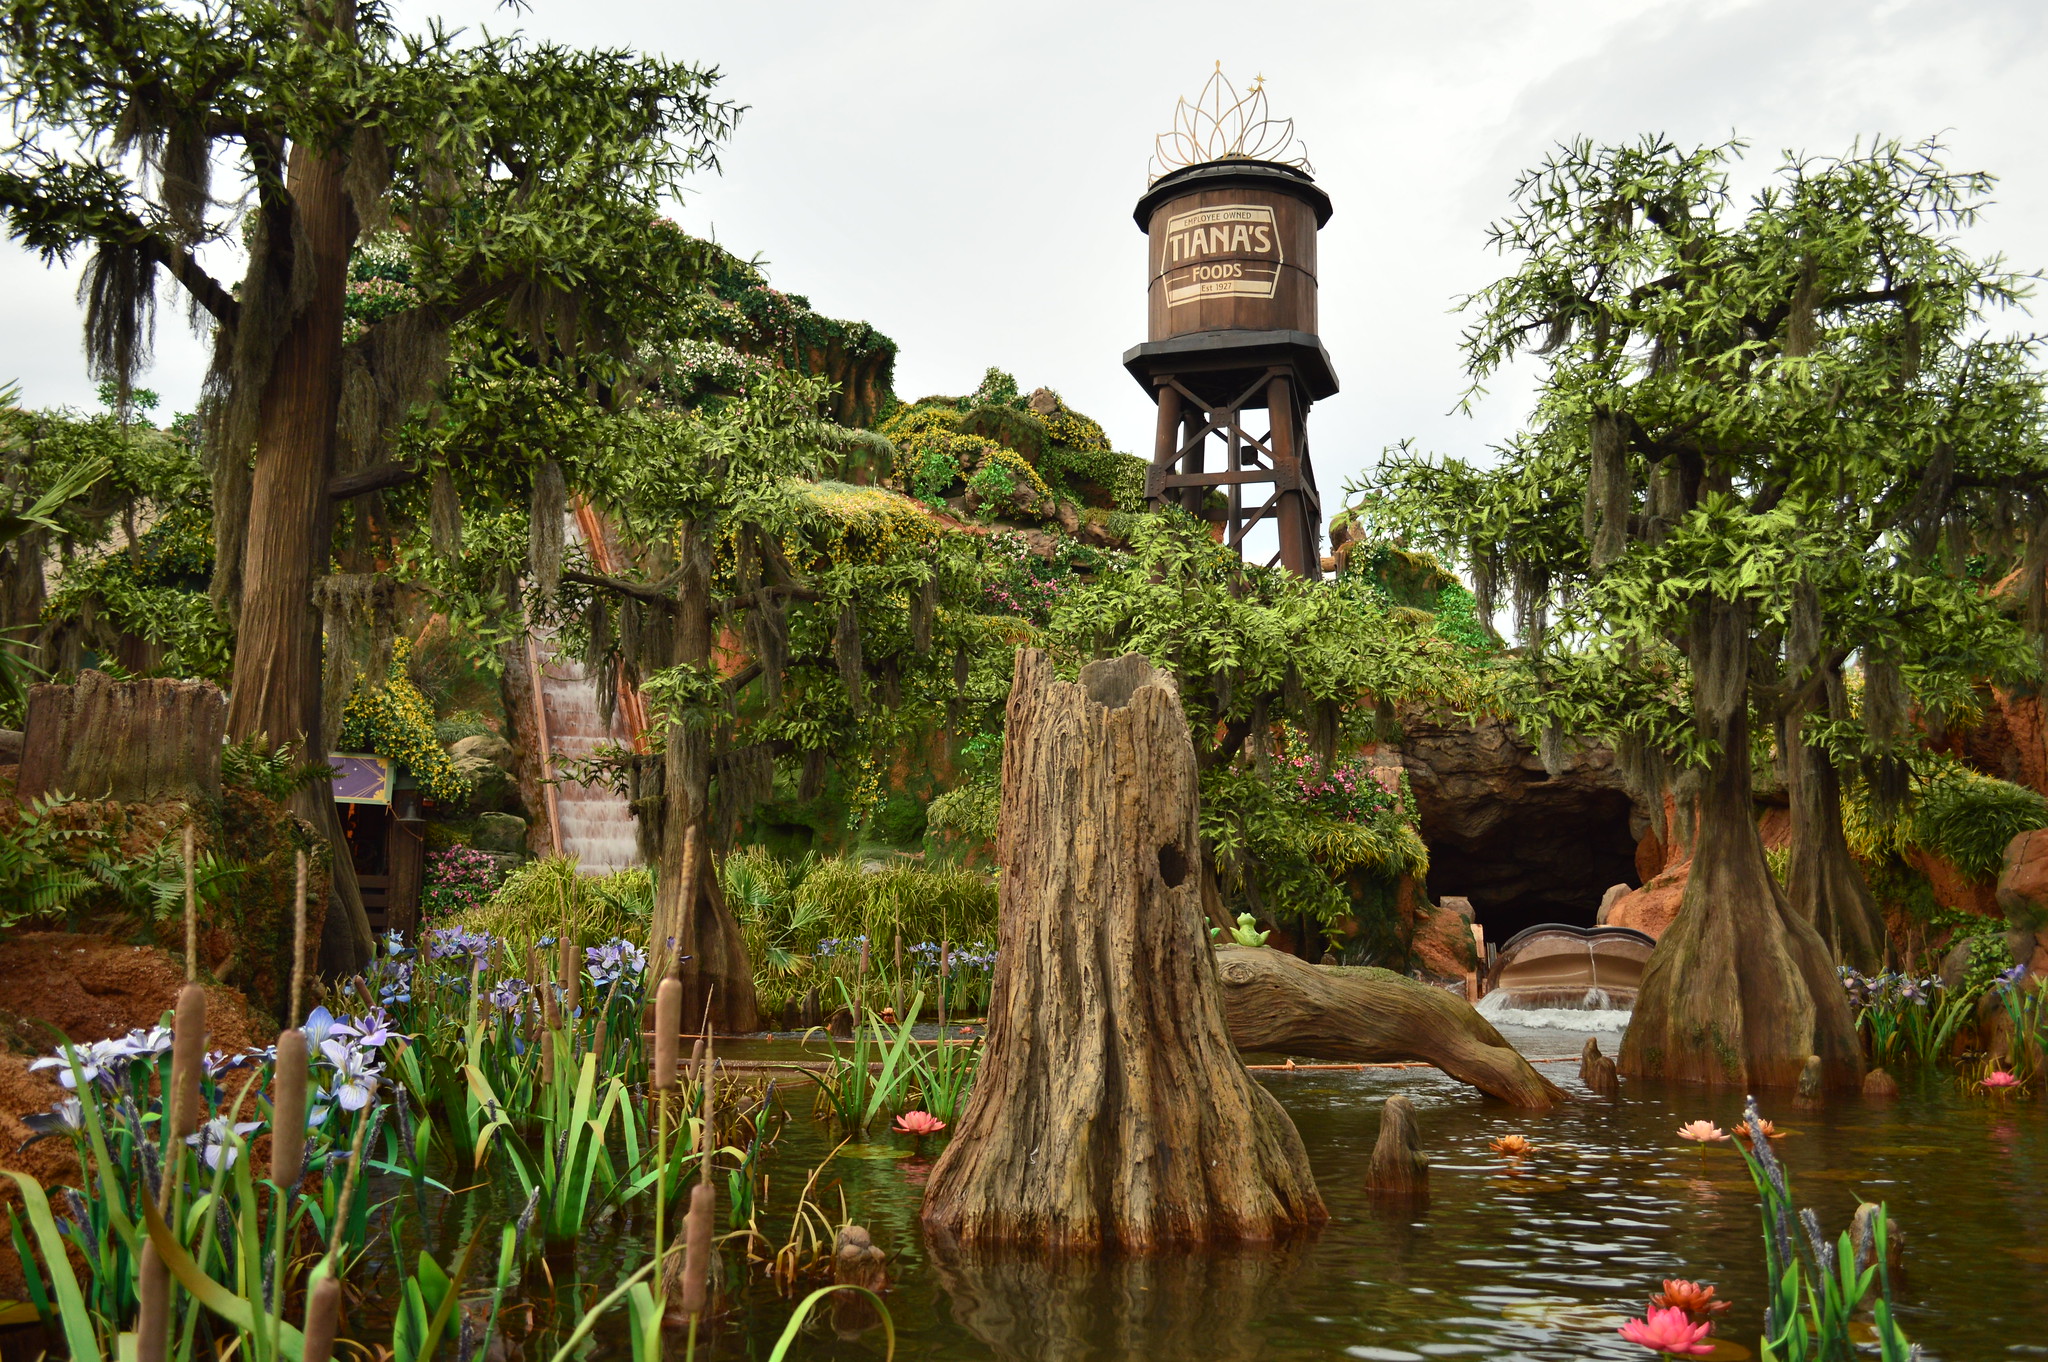
Attraction Downtime Worst Offender
In the past week, Tiana’s Bayou Adventure was the WDW attraction with the worst overall downtime. It was unexpectedly down for 19.7% of the past week. Why am I getting so specific? First, because that’s a pretty low “winning” number. But second, because second place went to Spaceship Earth, which had 19.6% downtime. So statistically it was almost a tie. What’s concerning to me is that Spaceship Earth JUST came back from a big refurbishment. If it’s not reliable now, when will it be?! Anyway, the worst day at Tiana this week was easily on October 23rd, when it was down all the live-long day. A big bummer for anyone in the park that day who was excited to ride.
Rope Drop Downtime
Here are problematic offenders from the past week, with the percentage of downtime during the first hour of the day in parentheses:
- Magic Kingdom: Under the Sea (30%), Barnstormer (29%), Space Mountain (15%), Tiana’s Bayou Adventure (15%), The Many Adventures of Winnie the Pooh (13%), Astro Orbiter (12%), Haunted Mansion (11%)
- EPCOT: Spaceship Earth (50%), Remy’s Ratatouille Adventure (19%), Journey Into Imagination (13%)
- Hollywood Studios: Slinky Dog Dash (22%), Rise of the Resistance (14%)
- Animal Kingdom: No rope drop downtime issues!
And here we see the main driver behind Spaceship Earth’s downtime this week. It’s just back from refurbishment, and it’s struggling to wake up every morning. I don’t like this. Clearly the refurbishment was more on aesthetics than ride system. But it didn’t have problems this big pre-refurb.
The other new trend to pay attention to, which I called out last week, is that Remy continues to show up in the 20-25% downtime range. This used to be reliably the very best way to take advantage of rope drop from the International Gateway. But a regular 20-25% downtime makes it too iffy.
Magic Kingdom was just a mess this week for rope drop. Lots of problems at lots of attractions, some of which very very rarely show up here.
And Hollywood Studios doesn’t look quite as bad as normal, but the two entries on the list are the two biggest rope drop targets in the park, which makes a good rope drop strategy here really difficult.
Gold star goes to Animal Kingdom once again!
Wait Times October 21 – 27
Attractions with the Highest Average Posted Wait at Each Park
- EPCOT: Cosmic Rewind, average posted wait of 65 minutes (was 77 minutes last week and 93 minutes two weeks ago)
- Hollywood Studios: Slinky Dog Dash, average posted wait of 57 minutes (was 69 minutes last week and 79 minutes two weeks ago)
- Magic Kingdom: TRON, average posted wait time of 52 minutes (was 66 minutes last week and 71 minutes two weeks ago)
- Animal Kingdom: Flight of Passage, average posted wait time of 48 minutes (was 62 minutes last week 75 minutes two weeks ago)
I kept two weeks of past results here because I think they’re informative! Not only was this week much less crowded than last week, but last week was also much less crowded than two weeks ago. This is a big big difference from the beginning of the month. Only two attraction had average posted waits above an hour – Cosmic Rewind and Test Track.
Parks with the Highest and Lowest Average Wait
These parks likely won’t change week-to-week unless something crazy happens, but these data points will give us a high-level view of how wait times are trending from week to week.
- Highest: Hollywood Studios, average park-wide posted wait of 29 minutes (was 37 last week and 41 minutes two weeks ago)
- Lowest: Magic Kingdom, average park-wide posted wait of 17.5 minutes (was 22.5 last week and 25 minutes two weeks ago)
Same story here. This past week we’re back at what I consider to be the real mark of “low crowds” – every single park had average posted waits under half an hour. That wasn’t true last week, and it was REALLY not true two weeks ago.
Most Inflated Posted Wait Times
We all know that Disney inflates their posted wait times on purpose. They have many reasons for doing this. Some are totally understandable, and some are potentially more problematic. We can figure out how much posted wait times are being inflated by comparing submitted actual wait times from the Lines App and the posted wait time when the person timing their wait entered the line.
Over the past week, actual wait times in the Lines App averaged 71% of what was posted. That’s still higher than our historical average, but trending back toward normal over the past two weeks. Overall, if the posted wait time at a popular attraction was 60 minutes, you could’ve expected to wait less than 43 minutes instead.
But the worst inflation offender for the past week was Spaceship Earth (for the second week in a row!). At this one attraction, submitted actual wait times were only 29% of posted wait times in the past week. That means that if Spaceship Earth had a 20 minute posted wait, you probably would have actually only waited less than 6 minutes instead. Less than a third of what was posted! Remember to always check the Lines app for predicted actual waits instead of making decisions based on what is posted.

This Week’s Wait Time Rock Star
Between October 21st and 27th, we had just over 1200 timed actual waits submitted through the Lines app. The one person who recorded the most actual waits during that time was QueenOfHearts, with 54 overall timed waits – 33 Lightning Lane waits, 17 standby waits, and 4 single rider waits. Thanks for all of that timing, QueenOfHearts! It unfortunately does not compete with the the 97 timed waits in a single week from our current timing champion, preef.
Looking Ahead: October 28 – November 10
I write this article on Tuesday evenings so that you all have the very freshest of data on Wednesdays. That means the 28th will already be in the past by the time you’ve read this, so the future is now! And next week I’ll be travelling for work, so we’re looking ahead at the next two weeks today.
Over the next two weeks, we have the big switchover from Halloween to Christmas in the parks. The last Halloween parties are on the 28th, 30th, and 31st. As a result, you can expect the 29th to be relatively crowded compared to the surrounding days. And the first Christmas parties are on November 7th and 10th. (And 11th, which will impact crowds).
But don’t think you get a break from crowds if you attend between party seasons. Oh no, friends. That is Jersey Week! That one week of the year where families from the Midwest plan a Disney vacation because they think it’ll be after fall break season is over, not knowing that everyone from the east coast has travelled down to Orlando. Jersey week should elevate crowds from November 3rd through 10th this year (especially with Veterans Day quick on the heels of that week).
Extra super bonus crowd information: A calendar anomaly has pretty much confirmed that the televised Christmas parade (and other entertainment) will be taped in the Magic Kingdom on November 8th and 9th. This was already going to be a crowded weekend. But it will turn Main Street into a huge tangle for most of the day and night. A very cool thing to experience if you’d like to, but there will be absolutely massive crowds of people trying to do the same thing. You’ve been warned.
In the immediate future, a cold front is visiting Orlando! You can thank this cold front for keeping Hurricane Melissa away from Florida. It’ll also mean a few days of highs in the low 70s. Actual chilly fall weather for Halloween! After that, things should rebound into the upper 70s and low 80s, with lots of sun. Obviously I can’t foretell weather for a whole two weeks, but hopefully it’ll keep being pleasant.
Before I head out on a work trip next week, my family and I are sailing on the Wish this weekend! It’s our first trip on the Wish, and if you’d like to follow along, you can check out my Instagram – @raisingminniemes.
Were you in the parks this past week? Or are you headed to Orlando soon? Let me know in the comments below!
You May Also Like...
-

Well, that escalated quickly. After weeks of slow climbs and small spikes, this weekend’s crowds at Walt Disney World came in…
-

It was the best of times, it was the worst of times … or at least some of the most crowded…
poor Mermaid at MK, wonder what’s going on with that ride.
Any theories on why Animal Kingdom was the busiest of all the parks (level 5) on Saturday 10/25? I was so surprised to see it busier than a non-party MK day and HS!
Any theories on why Animal Kingdom was the busiest of all the parks on Saturday 10/25? It was so surprising to me to see it busier than MK and HS! Our family is planning our Animal Kingdom day on 11/1 and that stat is making me second guess our weekend plans. Was it just an anomaly?