
Disney Data Dump October 8 2025
It was the best of times, it was the worst of times … or at least some of the most crowded of times and the least crowded of times. The past week at Walt Disney World gave us a tale of two seasons packed into seven days. Early-week calm felt like the rest of September, and then the weekend surge screamed “fall break is here.” The shift was sudden, dramatic, and maybe a little bit confusing if you haven’t been following along here regularly. But the data tells the story better than I ever could, so let’s explore the numbers together!
Observed Crowd Levels September 30 – October 6
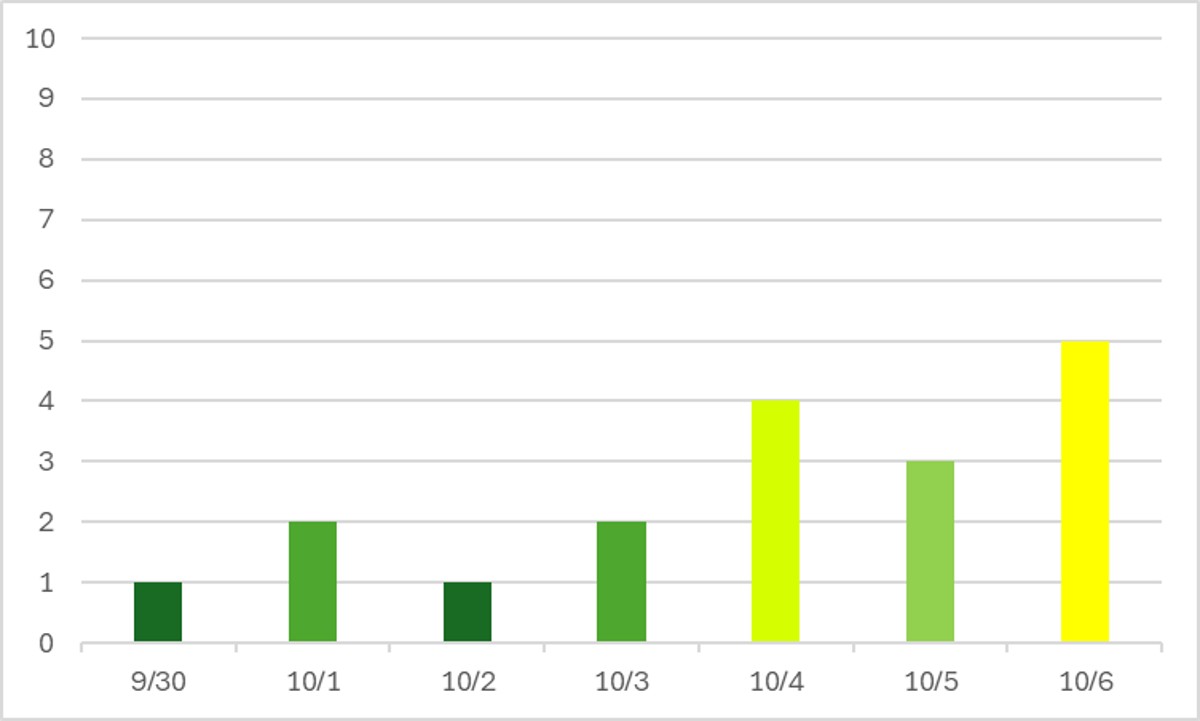
Our slow-but-steady increasing crowds for the month of September dove back off a cliff to end the month! It looks like fall break crowds waited until the first weekend in October to start showing up. How do we know this is an actual trend? Because it breaks the weekly pattern. Ever since the end of summer, Saturdays have been the most crowded day of the week. And now we’ve got a Monday that is more crowded than anything else instead. That points to families showing up in ways that they haven’t since … Spring Break season, probably.
It’s time for everyone’s favorite weekly game of “when were the Magic Kingdom parties?”
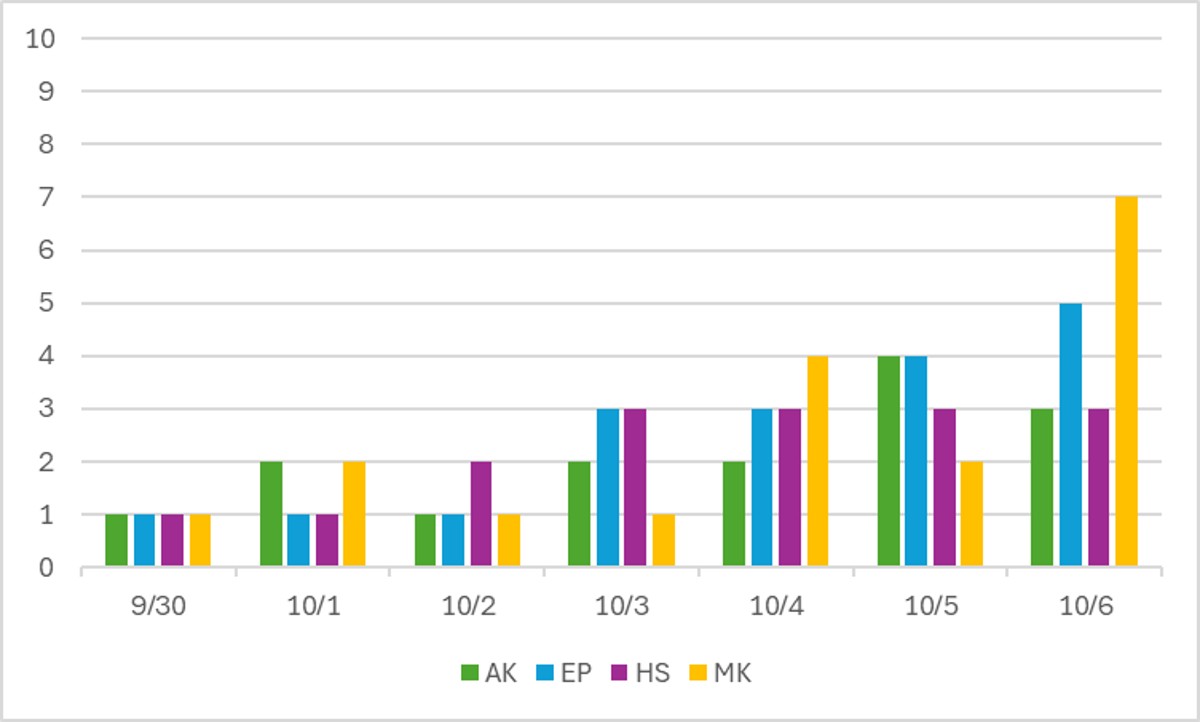
If you guessed the 30th, 2nd, 3rd, and 5th, you were correct! The difference between October 5th (party day) and October 6th (non-party day surrounded by two party days) was FIVE crowd levels. That’s a huge difference in what the park feels like and how efficiently you’re able to tour. But it’s not just Magic Kingdom with high crowds – all parks were starting to fill up more beginning on the 3rd and 4th.
Performance of Crowd Level Predictions
Each week, I give you a very transparent look into how the TouringPlans crowd level predictions performed. Each day at each park is one data point, so each week we have 28 different crowd level predictions to evaluate. Any time a prediction is within one or two crowd levels, things won’t really “feel” much different than what was predicted. Being off by 3 or more crowd levels is where you might feel that difference in wait times throughout the day.
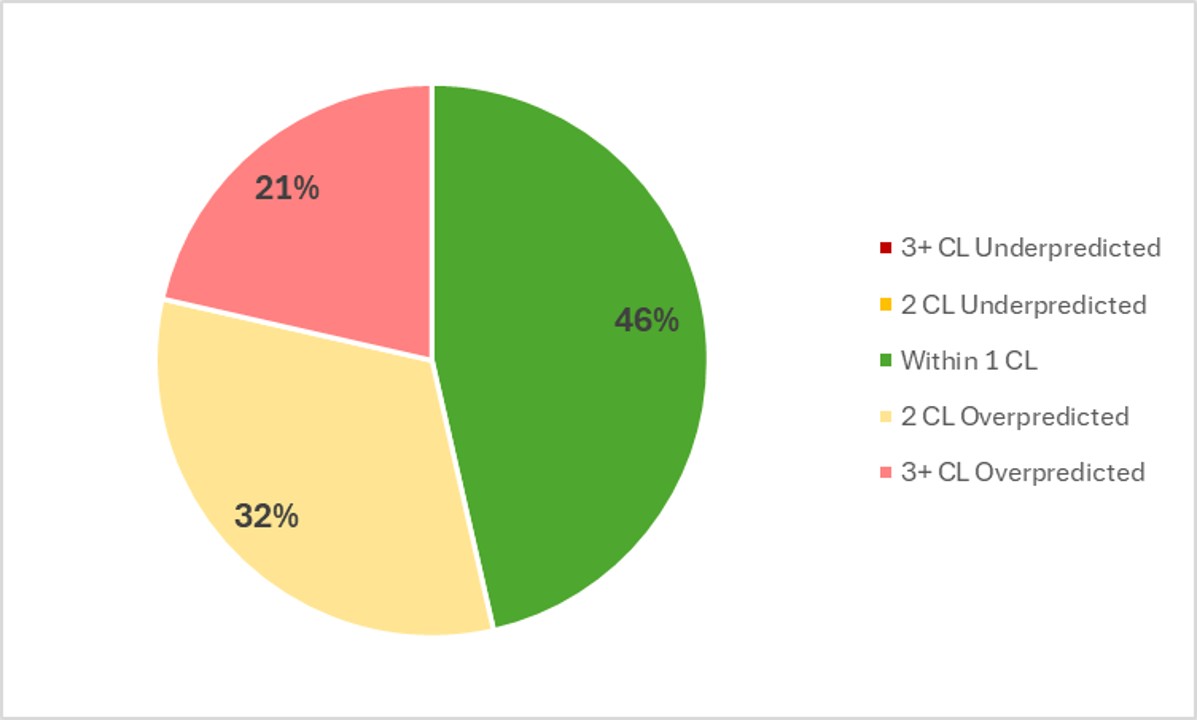
In the past week, Touring Plans predictions were either spot-on or within 1 crowd level 46% of the time, which is rough equal to last week. 79% of the time Touring Plans predictions were within 2 crowd levels, so that means we get a C+ for our predictions in the past week. On average, the crowd level at any park any day of the week was 1.8 crowd levels below prediction. That’s exactly the same error rate from last week, and it’s close to a noticeable difference every day in every park. The biggest miss of the week was an overprediction by 5 crowd levels, which happened twice – at Magic Kingdom on the 1st and at Animal Kingdom on the 3rd. On both days, the prediction a crowd level 7, but the park only got to a crowd level 2.
Attraction Downtime September 30 – October 6
If we average all of the capacity lost due to unexpected downtime over the past week, it comes out to 4% of attractions unexpectedly being down. That’s almost right at our historical average. I’m actually pretty pleased with that result, during a relatively rainy week. In the past week, EPCOT was the park with the most overall downtime, averaging 5.2% of its capacity lost to downtime throughout the week.
The worst day for attraction downtime in the past week was on October 5th. On that day, 6% of all capacity at WDW was lost due to unexpected downtime. The worst park-day of the week wasn’t on our worst day, nor was it at our worst park. That might be the first time that’s every happened! Instead, Hollywood Studios “won” on both October 3rd and 4th. On those days, 9% of its attraction capacity was lost due to unexpected downtime. Hollywood Studios was open for 12 hours on the 3rd and 4th, so 9% downtime is the equivalent of the entire park shutting down for just about 65 minutes each day.
Attraction Downtime Worst Offender
In the past week, Test Track was once again the WDW attraction with the worst overall downtime. It was unexpectedly down for 26% of the past week. This is another increase compared to what we saw there last week. Not a good trend. And it officially means that Test Track has topped the downtime list for more than half of the weeks since it reopened after refurbishment. The worst day at Test Track was on October 4th, when it was down for 46% of the day. But it was down for 36% of the day on the 5th too.

Rope Drop Downtime
Here are problematic offenders from the past week, with the percentage of downtime during the first hour of the day in parentheses:
- Magic Kingdom: Tiana’s Bayou Adventure (34%), Under the Sea (25%), Seven Dwarfs Mine Train (13%), The Many Adventures of Winnie the Pooh (11%)
- EPCOT: Test Track (18%), Remy’s Ratatouille Adventure (16%)
- Hollywood Studios: Slinky Dog Dash (32%), Rise of the Resistance (29%), Rock’n’Roller Coaster (16%), Runaway Railway (13%)
- Animal Kingdom: Expedition Everest (11%)
Last week I congratulated Hollywood Studios on not having Slinky or Runaway Railway on the rope drop downtime list. So this week – just to spite me, I’m sure – they’re of course on the naughty list. Along with Rise of the Resistance and Rock’n’Roller Coaster! Crazy. I apologize on Disney’s behalf if you tried to rope drop the Studios this week.
EPCOT and Magic Kingdom weren’t _so_ bad this week, unless you were hoping to get soaked on Tiana’s Bayou Adventure first thing in the morning.
But no gold star for Animal Kingdom this week either. Missed it by that much.
Wait Times September 30 – October 6
Attractions with the Highest Average Posted Wait at Each Park
- EPCOT: Test Track, average posted wait of 68 minutes (was 78 minutes last week)
- Hollywood Studios: Slinky Dog Dash, average posted wait of 56 minutes (was 57 minutes last week)
- Magic Kingdom: TRON, average posted wait time of 53 minutes (was 55 minutes last week)
- Animal Kingdom: Flight of Passage, average posted wait time of 50 minutes (was 48 minutes last week)
These numbers are slightly deceptive, because the past seven days were really two very different “weeks”. We have September 30th through October 3rd, where crowds were really low, and then October 4th through 6th where they came ROARING back at a level we haven’t seen since March. If we split up our data that way, our averages look like:
- Test Track: 61 minutes | 78 minutes
- Slinky Dog Dash: 50 minutes | 62 minutes
- TRON: 42 minutes | 68 minutes
- Flight of Passage: 31 minutes | 74 minutes
Look at that difference at Flight of Passage! Wild and crazy different experiences at Animal Kingdom depending on when you visited in the last 7 ays.
Parks with the Highest and Lowest Average Wait
These parks likely won’t change week-to-week unless something crazy happens, but these data points will give us a high-level view of how wait times are trending from week to week.
- Highest: EPCOT, average park-wide posted wait of 28.5 minutes (was 31 minutes last week)
- Lowest: Magic Kingdom, average park-wide posted wait of 18 minutes (was 19 minutes last week)
Once again, these overall average numbers hide a tale of two different “weeks” hiding in our one week. If we split it out the same way as above:
- EPCOT: 25.5 minutes | 32 minutes (and Animal Kingdom and Hollywood Studios were both 32 minutes as well)
- Magic Kingdom: 14.5 minutes | 23 minutes
Most Inflated Posted Wait Times
We all know that Disney inflates their posted wait times on purpose. They have many reasons for doing this. Some are totally understandable, and some are potentially more problematic. We can figure out how much posted wait times are being inflated by comparing submitted actual wait times from the Lines App and the posted wait time when the person timing their wait entered the line.
Over the past week, actual wait times in the Lines App averaged 70% of what was posted. That’s a little higher than our historical average, which means posted waits were slightly less inflated than normal. Overall, if the posted wait time at a popular attraction was 60 minutes, you could’ve expected to wait less about 42 minutes instead.
But the worst inflation offender for the past week was Star Tours. At this one attraction, submitted actual wait times were only 39% of posted wait times in the past week. That means that if Star Tours had a 15 minute posted wait, you probably would have actually only waited less than 6 minutes instead. Much less than half of what was posted! Remember to always check the Lines app for predicted actual waits instead of making decisions based on what is posted.

This Week’s Wait Time Rock Star
Between September 30th and October 6th, we had just over 1200 timed actual waits submitted through the Lines app. The one person who recorded the most actual waits during that time was Dashopping, with 34 overall timed waits: 12 Lightning Lane waits, 17 standby waits, and 5 single rider waits. Thanks for all of that timing, Dashopping! It unfortunately does not compete with the the 97 timed waits in a single week from our current timing champion, preef.
Looking Ahead: October 7 – 13
I write this article on Tuesday evenings so that you all have the very freshest of data on Wednesdays. That means the 7th will already be in the past by the time you’ve read this, so go ahead and celebrate your ability to time travel!
Yet again, the biggest driver of crowd patterns this week is going to be Mickey’s Not So Scary Halloween Party. Party dates are October 7th, 9th, 10th, and 13th (as well as the 14th, which falls outside of this look-forward, but will impact crowds this week). That means October 8th is surrounded by three party days. I’m going to go ahead and call out October 8th as an avoid-Magic-Kingdom-at-all-costs day. We already saw BIG crowds on the 6th, and that only had two party days around it, not three like the 8th.
This upcoming weekend is a long weekend for many school districts across the country. That should equal more Disney trips than usual. Disney is anticipating this, with extended park hours at Magic Kingdom and Animal Kingdom compared to usual. It’s also a rare weekend where Magic Kingdom isn’t closing early for a party on Saturday or Sunday. That points to Disney wanting to absorb as many people as possible in its most popular park.
Welcome to fall in Florida, where high temperatures only hit the 80s instead of the 90s! A few days will have some spots of rain, but otherwise it looks like a gorgeous week to be in Walt Disney World.
Were you in the parks this past week? Or are you headed to Orlando soon? Let me know in the comments below!
You May Also Like...
-

After a few weeks of slight wait time increases compared to our early September lows, things settled back down a little…
-

Welcome to June, and to the first full week of Cool Kid Summer at Walt Disney World! With new deals in…
Heading to the parks tonight! Wish us luck!