
Summer Crowd and Wait Time Trends at Disney World
It’s been a challenging summer for Walt Disney World. If you go by America’s economic indicators, attendance should be strong: gas is cheap and getting cheaper, unemployment is below 5%, and stock markets are flirting with record highs.
But Disney is also facing some formidable challenges in getting people into its parks. From the self-inflicted, sharp increase in admission earlier this year – the largest increase in at least 20 years – and a move to “seasonal” one-day ticket pricing that falls squarely on parents with school-age children, to June’s murder of Christina Grimmie, the Pulse Nightclub massacre, and fatal alligator attack at the Grand Floridian.
Based on our analysis of posted and actual wait times for rides at Walt Disney World, we think attendance is lower to this point in summer for Epcot, Disney’s Hollywood Studios, and the Animal Kingdom, and higher at the Magic Kingdom, versus the same period in 2015. Overall, we think attendance is flat to slightly lower throughout Walt Disney World.
Here’s a breakdown by park. The date ranges are June 1 through July 24 for all graphs. We focus on standby waits, posted waits, and people in line between 10 a.m. and 5 p.m., since this is the peak time for crowds.
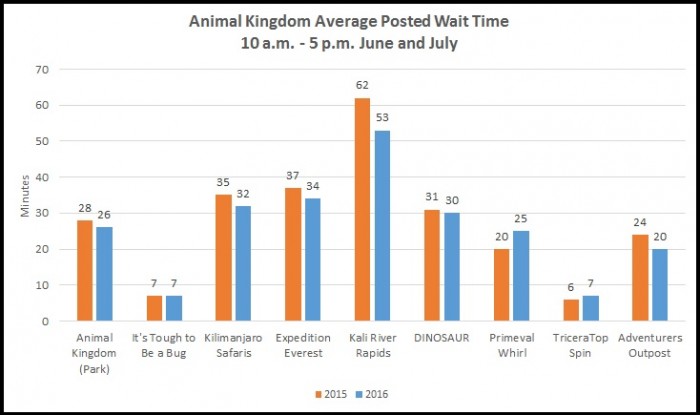
Disney’s Animal Kingdom Wait Times
Every major attraction at the Animal Kingdom has seen its wait time drop in 2016. The average posted wait is down 2 minutes since summer 2015. In terms of people in line, it’s roughly a 7% decline, from 693 people in line per attraction in 2015, down to 646 people in 2016.
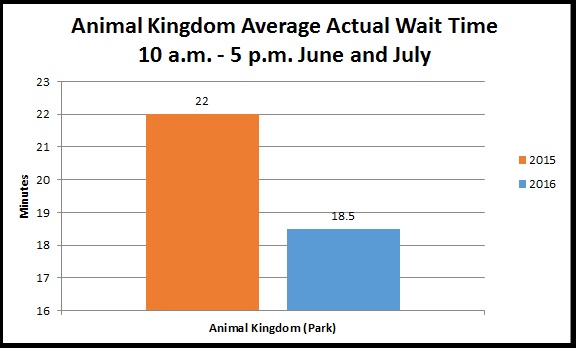
But the Animal Kingdom attendance drop may be more than that. We also track your actual wait in line at the Animal Kingdom rides, and those point to lower crowds, too:
Your actual wait in line at the Animal Kingdom was around 79% of the posted wait time in Summer 2015 – about 22 minutes. It was around 71% of the posted wait in 2016 – about 18.5 minutes. While we’ve always known about Disney’s standard practice of posting artificially high wait times, it looks like they’re even more inflated in 2016 versus 2015. That would mask part of any attendance drop, too.
Taking actual waits and individual ride capacities into account, there were 547 people in the average Animal Kingdom line in 2015. There are around 458 people in line this summer, about 15% lower.
That said, the chart doesn’t capture the number of people in the park for the nighttime Kilimanjaro Safari ride, nor the Jungle Book: Alive with Magic Show. I’d be mildly surprised if many guests were coming to the Animal Kingdom just for those. For one thing, the Jungle Book show is the lowest-rated attraction in the Animal Kingdom, so word of mouth isn’t driving people into the park. And while the nighttime safari is interesting, it’s not a replacement for the daytime experience. We think most people are adding in a second ride when they’re already in the park.
Chart notes: Number of posted wait time samples = 102,091; number of actual wait times = 898
Disney’s Hollywood Studios Wait Times
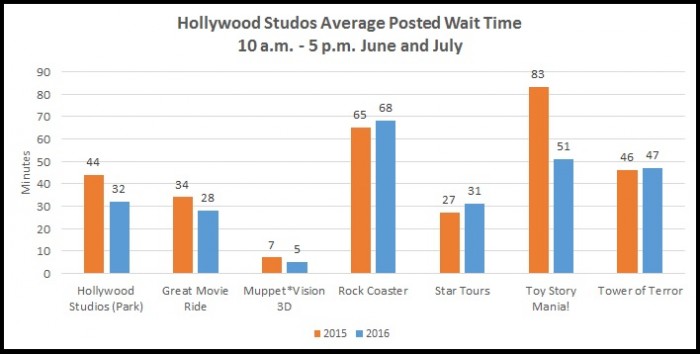
Here are the numbers for Disney’s Hollywood Studios:
The average posted wait at DHS is down 12 minutes in 2016 as compared to 2015. Most of that comes from the addition of a third ride track at Toy Story Mania. A 50% increase in capacity has dropped posted wait times by almost 40%. Posted wait times are also down slightly at Great Movie Ride and Muppet*Vision 3D. Posted wait times are up slightly at Rock ‘n’ Roller Coaster, Star Tours, and Tower of Terror.
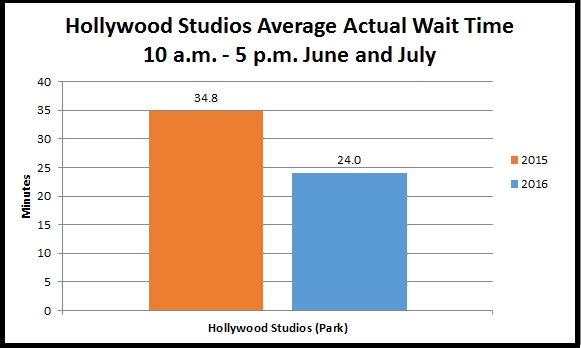
How do actual wait times compare to posted wait times at Hollywood Studios? They’re more inflated in 2016 than in 2015. In 2015, your actual wait was around 79% of the posted wait. This year, your actual wait is around 75% of the posted wait. That means you’re waiting less in line in 2016 versus 2015, for the same posted wait time. Like Animal Kingdom, this would also mask a little bit of an attendance drop:
Taking ride capacity and actual wait times into account, it looks like the number of people in line at Hollywood Studios is down 1% so far this summer. You’d think that if people are waiting less in line at Toy Story, they’re in line somewhere else. And surely, some of them are at the Star Wars Launch Bay or peering intently over construction walls around the park. If Disney said that attendance was even with 2015, I might could believe it. If Disney said attendance was up at DHS, I’d say I missed the news about Florida legalizing recreational marijuana.
Chart notes: Number of posted wait time samples = 109,104; number of actual wait times = 1,236
Epcot Wait Times
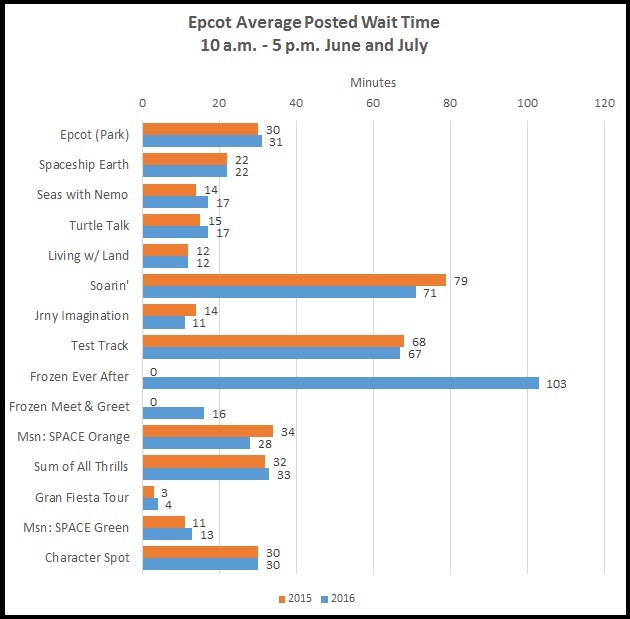
Epcot wait times are up about 1 minute versus 2015, largely the result of new attractions: Soarin’ Around the World, Frozen Ever After, and the Anna and Elsa Royal Sommerhus meet-and-greet. We’ll display the Epcot and Magic Kingdom charts vertically to fit in all of the attractions:
Epcot’s ratio of actual wait times to posted wait times has been about 68% in both 2015 and 2016 (with some variability between attractions and years). That means your actual wait in line will be about one-third lower than the posted: you’ll really wait about 40 minutes to ride Test Track if the posted wait is 60 minutes.
Like Toy Story Mania, Soarin’ got a 50% boost in capacity in 2016. And Soarin’s wait times were inflated two different times in June: once when fans got a last look at the old ride film; and again when the new ride film debuted. Even with the 50% boost in capacity, Soarin’s wait times are only down about 10% between 10 a.m. and 5 p.m. (and just under 20% for the entire day), indicating that there’s still strong demand for the ride.
It’s also worth noting that Frozen Ever After’s wait times were intentionally inflated when the ride opened in June (180 to 300 minute estimates were routine), to discourage standby guests from getting in line. This allowed Disney to use more of the ride’s capacity for Fastpass+ reservations. The ride is also suffering a chronic series of breakdowns during the day, which also serve to inflate wait times. If we used Frozen’s wait times in our calculations, it would make Epcot’s attendance numbers seem up 7% year over year.
But we don’t think Frozen Ever After’s wait times are reliable enough to use. Ignoring FEA, and taking ride capacity in to account, we think there are about 3% fewer people in line at Epcot this summer.
Chart notes: Number of posted wait time samples = 144,031; number of actual wait times = 1,640
Magic Kingdom Wait Times
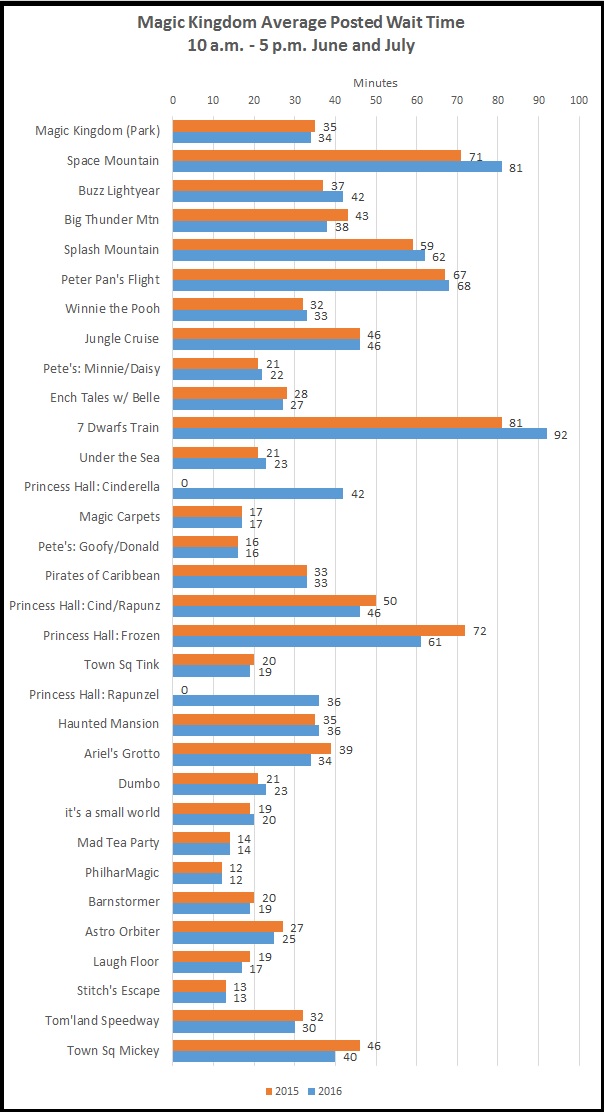
Average posted wait times are down about 1 minute across the Magic Kingdom this summer, with some attractions up and others down:
Your actual wait in line at the Magic Kingdom has held steady from 2015 to 2016. Last year your actual wait was 70% of the posted time, and this year it’s 69% (again, with variability between attractions and years). So if the posted wait at Space Mountain is 50 minutes when you get in line, you’ll probably wait about 35 minutes before riding.
An interesting thing to note in the Magic Kingdom is the continued strong popularity of the Seven Dwarfs Mine Train. Wait times are up to 92 minutes this year, from an already high 81 minutes in 2015. One theory for this is that families with grade school children are opting for 7DMT over Big Thunder Mountain Railroad, whose wait times have decreased about 12% this year.
Taking ride capacity and actual wait times into account there seem to be 4% more people in line at the Magic Kingdom this year than last.
Chart notes: Number of posted wait time samples = 449,803; number of actual wait times = 4,910
Walt Disney World Wait Times
We get an increase of around 0.60% in attendance when we combine the numbers for all four parks, because the Magic Kingdom is the most popular park. Having said that, there’s enough room for error in all of this that I wouldn’t be surprised if Disney said attendance was anywhere from +2 to -4%. Why the bigger range on the negative side? Our anecdotal reports of WDW hotel occupancy over the July 4th weekend pointed to a 10% drop in year-over-year occupancy numbers, following a basically flat early summer.
What to Expect For the Rest of 2016
We’ve recently updated our Disney World Crowd Calendar predictions for the remainder of 2016. Those include wait time estimate increases for many days, which is the opposite of the trend we’ve seen this summer. But there are good reasons for expecting that trend to change:
- It’s unlikely that Orlando will see a week of violence and tragedy like the one of June 10 – 17, 2016, after which many families undestandably canceled their trips.
- Disney has contingency, targeted marketing campaigns to offer hotel and dining discounts to stave off a longer-running trend. Some of these campaigns have already run, resulting in higher bookings for some fall dates.
Also – and this is a bit technical – the crowd calendar numbers are based on posted wait times, not actual wait times (because posted wait times are easy for people to see and verify). So even if the actual waits in line are flat or declining relative to posted waits, an increase in posted waits drives up the crowd calendar numbers.



Do you have an analysis of Disneyland crowd levels this summer?
I’m curious what you guys think the impacts of the Zika cases in Miami will be on attendance.
I’m a TA and just this afternoon I had a client (who’s a doctor) call to cancel her trip due to Zika concerns.
Hi Steve. I’d like to follow up on the questions (in two articles) about current touring plans not updating wait times even when our crowd level numbers went up.
My husband and I have read your answer to the question several times and still don’t understand at all: “The optimizer had access to the new attraction prediction prior to the crowd levels updated. We will update an attraction’s prediction and not update the Crowd Calendar if there are no significant changes to the Crowd Level.”
So what does that mean exactly? Does that mean that the increase in crowd level is NOT resulting in increased wait times for our touring plans? Or that it’s not updated yet but will? Or that we need to start a new touring plan to get the current times?
(Our plan for MK on 8/16 went up but none of the other plans had any changes to wait times. I have “evaluating” not “optimizing” because everything was pretty set and I just wanted an update. But should we click “Optimize”?) Just want to make sure that we don’t have a plan that will cause us to be late for ADR or FP+.
Thanks so much for clarifying!
The attraction wait times that you are seeing when you evaluate your Touringplans, are the wait times that the crowd levels are based on. The attraction wait times are updated on the website before the crowd levels are updated.
Attraction wait times are updated more frequently that crowd levels. The best example of this is the day of predictions. Attraction wait times are adjusted for the remainder of the day based on the observed data. We do not change the day of crowd level.
Len:
Interesting article, but I still maintain that drawing conclusions on Epcot attendance based solely on ride waits is highly misleading. It ignores the huge crowds who come for, and only for, Flower-Garden and Food&Wine (which together take up just 3 days short of 5 months this year).
I’ve thought about this a lot. I think the only solution, given that Disney doesn’t post wait times for the food booths during these festivals, is to make use of the user-submitted wait times feature in Lines to collect some data on actual wait times at the food booths. With that data, especially after a few years, you would have a much better picture of the Epcot crowds during these festivals, and thus overall, since the festivals take up such a large fraction of the year.
Thoughts?
Going to be there next week. I certainly hope so!
Also, some big attractions are going down for August and beyond refurbs. Dinosaur, Big Thunder, Muppets
The castle projection show is being shut down for most of August too.
Good point, Dave. Thanks!
@Len Great article. Question for you on the software: After the crowd calendar updates were pushed, I noticed a sharp uptick in crowd levels for my August 2016 trip. However, when I optimized my pre-existing touring plans, the wait times didn’t change at all. That doesn’t seem right, especially if wait times are expected to be higher than they were when I created the plan. Do I have to re-create the plans to see the change in wait times?
The optimizer had access to the new attraction prediction prior to the crowd levels updated. We will update an attraction’s prediction and not update the Crowd Calendar if there are no significant changes to the Crowd Calendar.
Very interesting. Can you elaborate how ride capacity was factored? Specifically interested in how increases in waits attributed to reduced capacity as a result of staffing reductions is accounted for given that it is a product of cost reductions by Disney, not increased attendance.
Sure, Terry. The easiest way to check a ride’s capacity is to count how many people are in the standby line, and compare that to the posted wait.
Suppose there were 1000 people in line for Pirates, and the posted wait is 45 minutes. Then we can find the ride’s current capacity, X, by solving 1000/X = 45/60.
Same thing when there are 750 people in line for Pirates and the posted wait is also 45.
I received an email for Crowd Tracker updates telling me that for my trip, August 15-22, crowd levels will increase 1-2 points for each park. Can you tell me what this means in relation to this article with slightly lowered wait times?
Thanks!
Oh, I misread the end of the article, you’re predicting wait time increases.
Thanks for reading the post, Angela!