
2025 Crowd Calendar Retrospective: TouringPlans vs Disney
Welcome to 2026! A totally new year, where we’re going to do many of the same things … like having fun with Disney Data. Including today! The basic idea of today’s analysis is this: Disney gives us a peek into what they expect crowds to be like by adjusting their ticket prices. Higher ticket prices = higher expected crowds, and lower ticket prices = lower expected crowds. So now that 2025 is over, we can go back and compare actual results with what Disney “predicted” and with what Touring Plans predicted.
All of the Asterisks and Fine Print
As a data geek, I’ll willing admit that there is a lot of hand-waving here, behind what appears to be some fancy math. And I wouldn’t be doing my job if I wasn’t transparent about the hand-waving so that we can have fun with the results – without arguing over their statistical validity, etc.
- First, Disney changes its ticket prices in order to manipulate crowds. Technically, if ticket prices go way up, and crowds are lower, they have in some ways accomplished their mission. One of their goals is to have steady, even crowds throughout the entire year, so perhaps a more fair fight would be comparing our predictions to all the 5s, 6s, and 7s that Disney “hopes for”.
- Touring Plans predicts and records actual crowd levels based solely on wait times. Disney could have high ticket prices for, say, opening day of the Food & Wine Festival, because they expect large crowds. Those large crowds could descend upon EPCOT as expected. But if they’re all just eating and drinking and roaming and not getting into attraction lines, the actual crowd level we record won’t be all that high.
- Disney gets to control operations. This means that, if they need to (or want to), they can increase or decrease capacity, which in turn affects wait times, and therefore crowd levels. So this makes things slightly less “fair” because Touring Plans can’t do the same thing.
- Disney’s goal is to make money (not magic? shocking). They are incentivized to make ticket prices as high as possible without negatively impacting demand/attendance. So it’s not surprising if they “predict” a lot of high crowd levels based on ticket price. They want high ticket prices.
Data Preparation
Before I can compare results, I need to do some data wrangling. Comparing Touring Plans predictions to actual crowd levels is easy. They’re both on a scale of 1 to 10. We define how both are calculated. The Disney piece is more difficult. They had 14 different 1-day ticket prices for 2025 – just for Magic Kingdom – and they weren’t distributed quite like the bell curve that Touring Plans aims for. If we look at all of the combinations of MK/HS/EP/AK ticket prices things get even crazier. So for today we’re going to use the MK price as our analog for “Disney ticket prices”. Trust that I did all of the math in the background to ensure I wasn’t throwing away extra detail that we needed. I compared all of the different combinations and none of them differed significantly from this one – they’re just harder to visualize and explain.
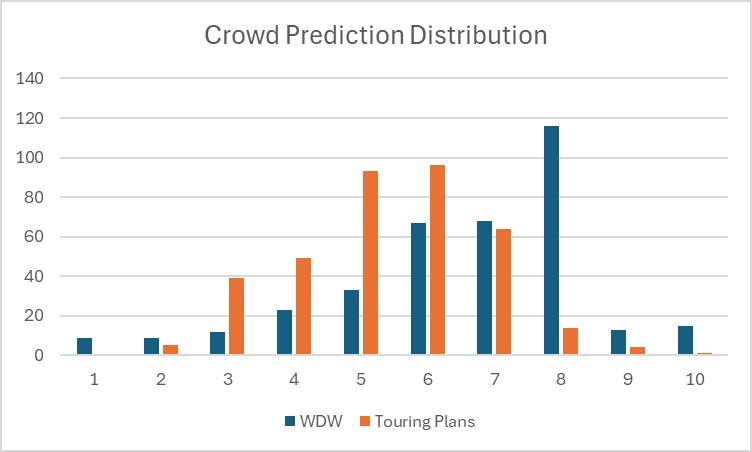
Using math, I can bucket the 14 different price points to mirror the Touring Plans distribution as closely as possible. As you can see above, the results aren’t perfect. They’re actually much more different than what we saw last year. Last year, WDW was roughly the same shape as TP, but shifted toward higher crowd days. This year, Disney had a LARGE number of days priced at $199, which was the third-highest price option for the year. There’s no way to break up those days, and they are high priced. It’s almost as if that’s Disney’s default (or what we could call a crowd level 5 or 6) and mostly any lower price means potentially low crowds. This is weird behavior that we haven’t seen in previous years.
How Accurate Were the Predictions?
Before we get to the big fancy summary, let’s look at some physically bigger, fancier calendar-style heat maps. These calendars show the difference between the actual crowd level and the predicted crowd level. That means overpredictions are negative numbers (and will show up as purple) and underpredictions are positive numbers (and will show up as orange). Days that are off by only one level are considered to be “good enough” and aren’t colored in these charts.
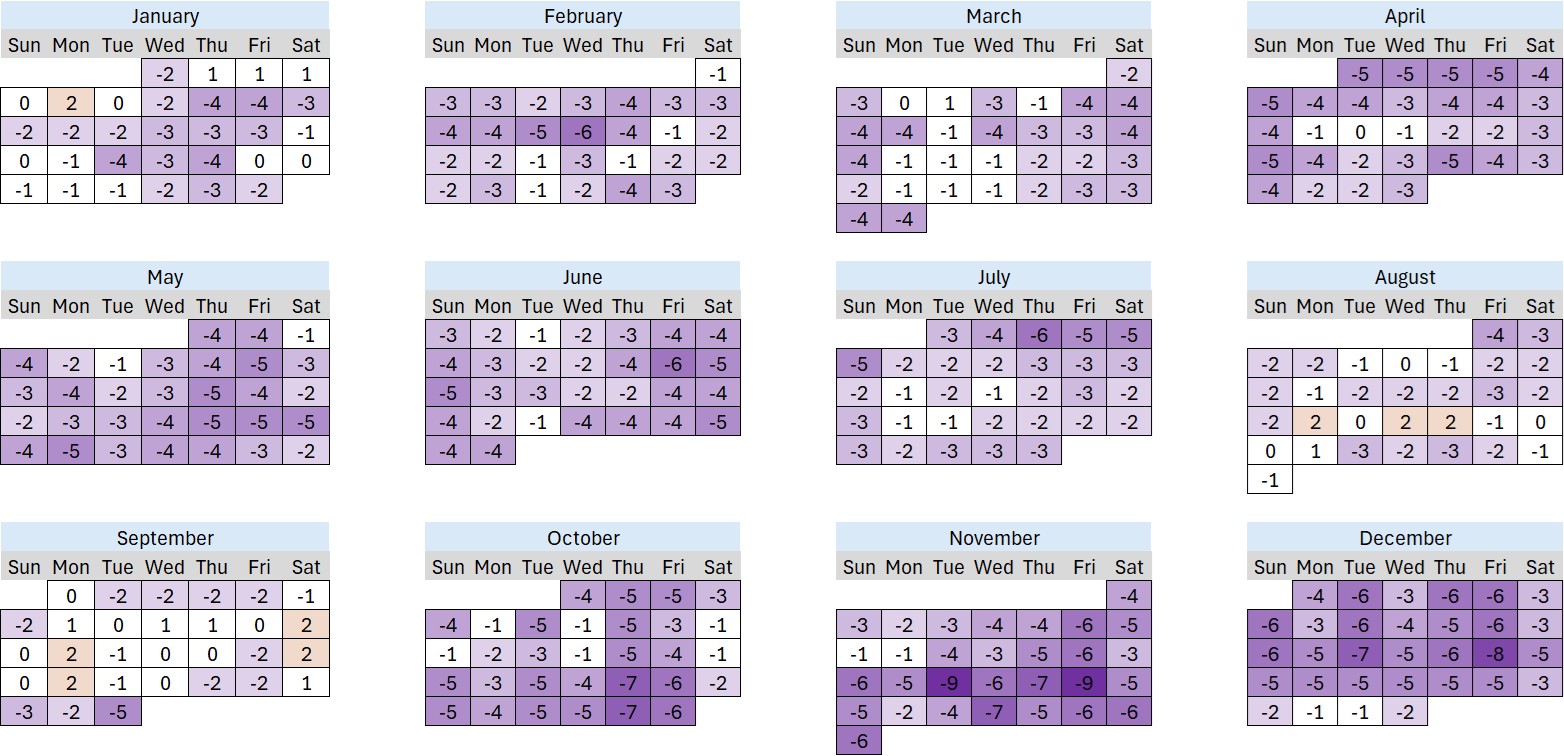
One thing is wildly clear here. Crowds were much lower throughout 2025 than what we would have predicted in previous years. Generally speaking, visitors and wait times were much lower than previous years. 2024 had historically low crowds, and 2025 was even slower.
The Disney calendar shows that ticket prices almost always wildly overpredicted crowds. This was especially bad in the second half of November – the were two days where tickets were the highest possible price … and the parks ended up being a crowd level 1. In fact, most of November and December are pretty high-priced, but the crowds didn’t live up to the prices until after Christmas. Disney price “predictions” did best on weekdays in March and throughout the month of September. Otherwise, yikes.
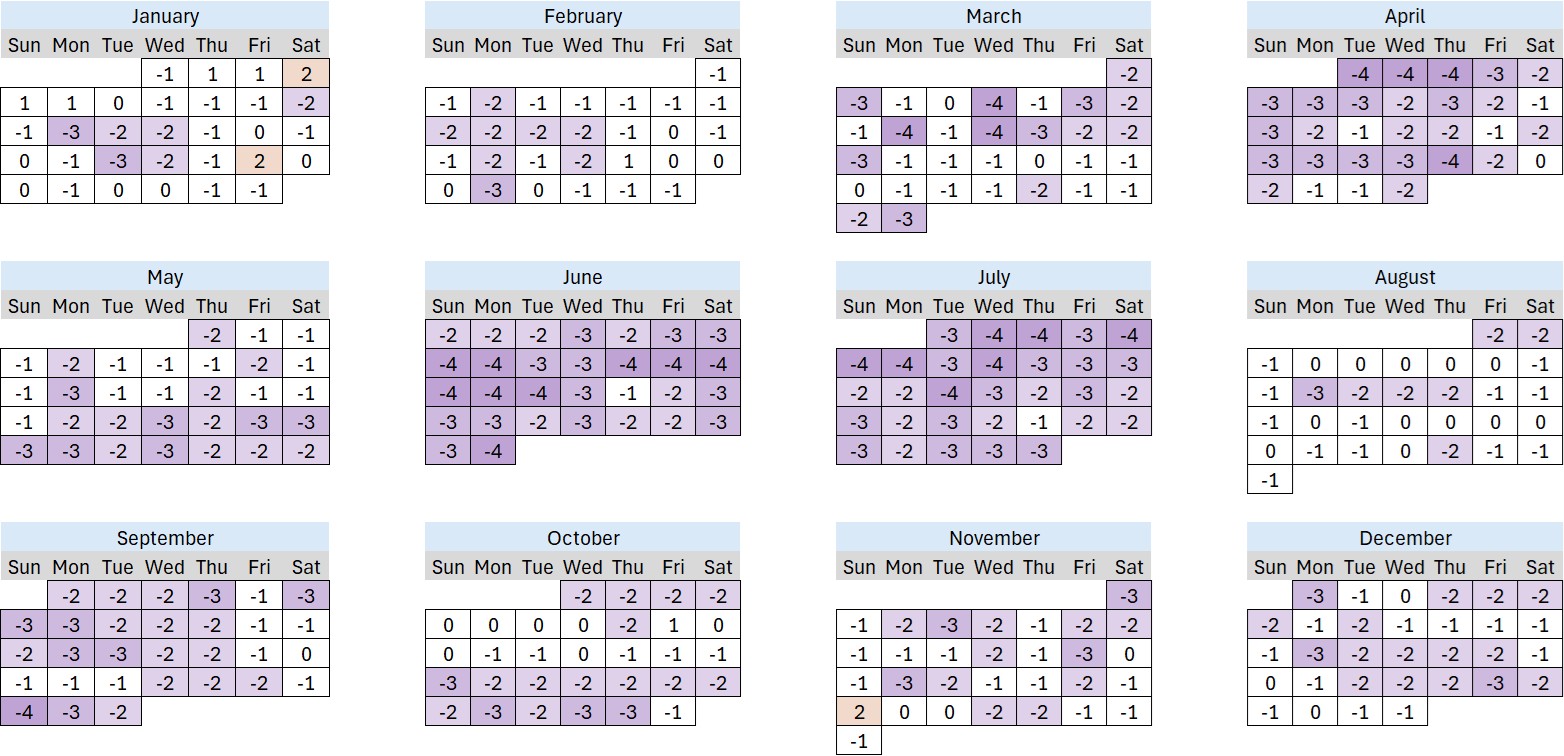
The Touring Plans predictions tell a similar story but on a much smaller scale. January and February were roughly similar to what was predicted, and then after that was when crowds started falling off a cliff. The summer was much less crowded than what we’ve seen previously. An end-of-July crowd calendar update helped adjust things so that August was close to predictions, but then the fall got less crowded than expected again. Still, misses weren’t as big as the WDW price predictions.
How Do the Predictions Compare to Each Other?
These next graphs should look eerily familiar to anyone following along with the Disney Data Dump:
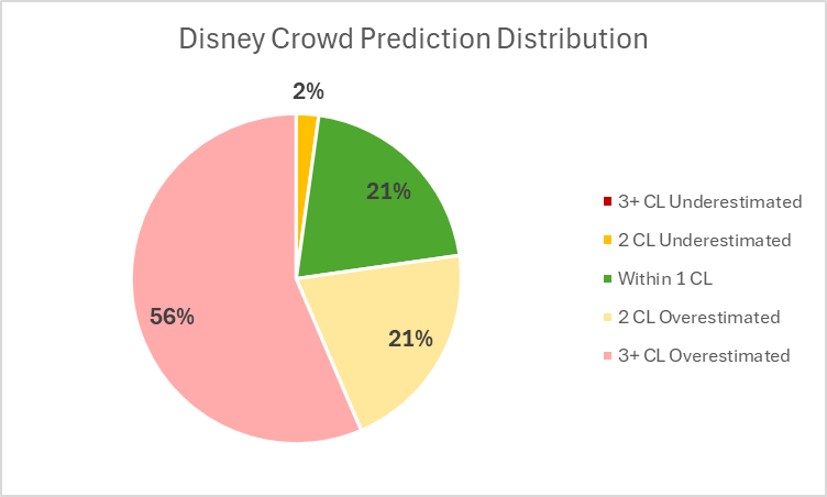
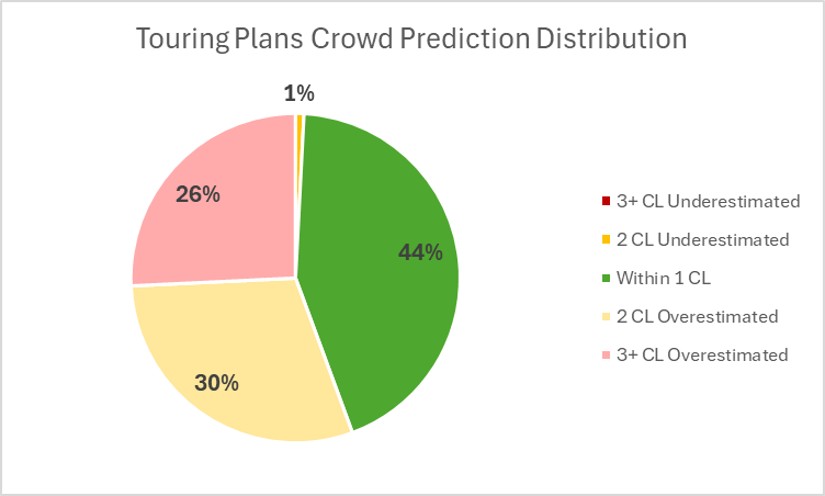
The results here speak for themselves. But you know me … I’m going to speak for them too 🙂
Last year, Disney’s green wedge was 44% and Touring Plans’ was 56%. (The previous year was 51% and 71%). Both green wedges are smaller this year, so that’s now officially a trend. Last year, Disney’s “predictions” were off by 3 or more crowd levels 30% of the time, and Touring Plans was off by the same about 14% of the time. This year, that increased to 56% of the time for Disney and 26% of the time for Touring Plans. Once again, many more big misses – and they were all underpredictions.
Disney’s results are much more skewed this year than they have been in the past. Two years ago there was an almost equal distribution of over- and under-predictions based on ticket price. That means pricing was generally a fair, if not accurate, predictor of crowds. Last year, almost twice as many days were over-predicted than were under-predicted based on ticket price. That meant that Disney figured out they could raise prices overall without scaring people away. In fact, they figured that out SO much that this year there were 38 TIMES more overpredictions than underpredictions. Disney was charging way more than what the crowd levels were.
What are your thoughts about these results? Is ticket price a serviceable corollary for what Disney thinks crowds will be like? Let us know in the comments!
You May Also Like...
-

Welcome to 2025! A totally new year, where we’re going to do many of the same things … like having fun…
-

We’re almost to the end of January, and that means that we need to wrap up all of our crowd calendar…
Always enjoy your thoughtful breakdowns of the data and what it tells us, Becky! Well done.
Question: Have you looked to see if Disney’s Lightning Lane pricing is a better or worse predictor than their MK Ticket Pricing? Seems to me it may well be.
Hello Becky
Excellent piece – thank you. It is very hard to see trends with one year only but I do suspect external factors went crushing data models (economy, post COVID pentup demand…).
I used to work in insurance where big numbers and patterns are key. It does remind me of early years of natural catastrophies impacting negatively claims and eventually premiums and the whole business.
Hopefully it is not that problematic with WDW!