Disney Data Dump April 15 2026
If you were in the parks over the past 7 days, it might have felt like two completely different trips stitched together. The first half of the week held onto peak Spring Break energy, with high wait times and crowded spaces. And then, almost overnight, everything changed. Crowds didn’t gradually ease. They dropped. Fast. By the weekend, we were looking at some of the lowest wait times we’ve seen in months.
That kind of swing is rare, but it tells us a lot about how this year is going to go. Sometimes, families will travel. Especially during those “everyone is out of school” seasons like Presidents Day weekend and Spring Break. But when those windows close, the parks totally empty out. There’s just not enough demand to prop things up in slower seasons.
Let’s dig into what happened this week, and what it means now that we’re finally on the other side of Spring Break.
Observed Crowd Levels April 7 – 13
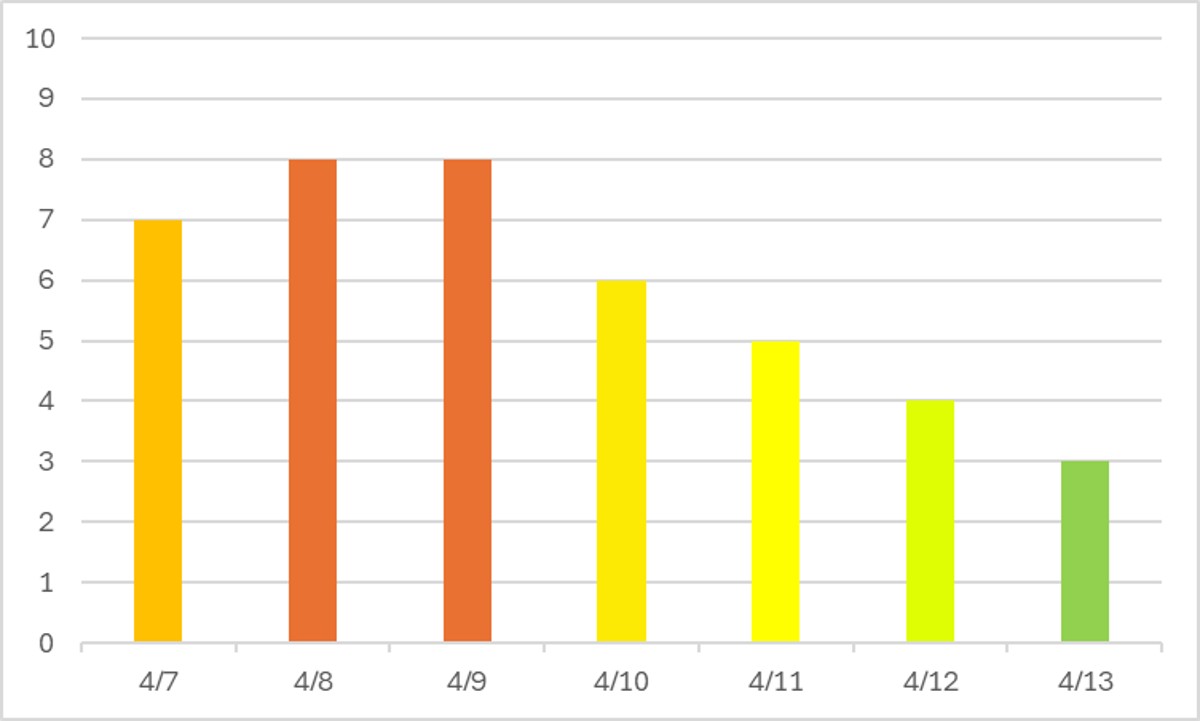
Last week, I called out that we’d likely see some of the most crowded days of the Spring Break season, followed by the start of a slow decline that should last until summer. Well, I got the “most crowded” part right. And then crowds dropped off a cliff rather than slowly declining. Now we should just see continued low crowds through the rest of spring.
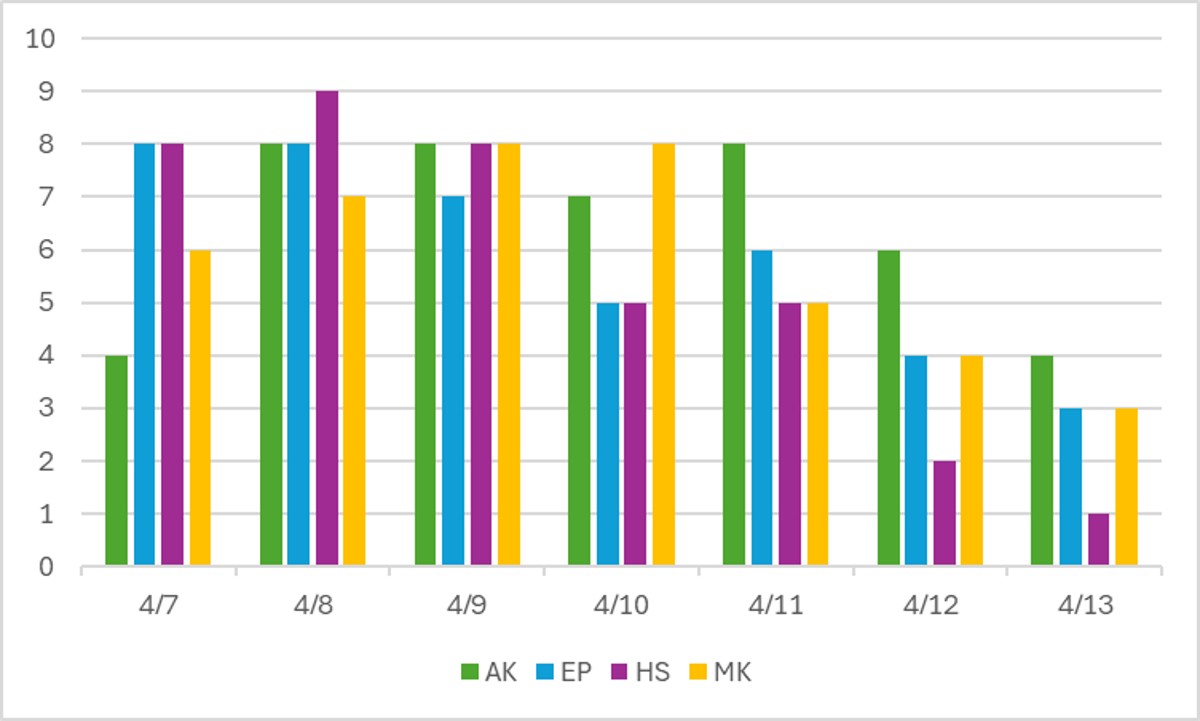
The crowd drop-off is even more stunning when we look park by park. Hollywood Studios peaked at a remarkable 9 on April 8th (the closure of Muppet*Vision, Rock’n’Roller Coaster, and the Animation Courtyard area mean much lower capacity than normal, which makes this park struggle to handle crowds), and then dropped all the way down to an equally remarkable crowd level 1 on the 13th. Animal Kingdom is still staying more crowded than the other parks thanks to its also-low capacity right now. Expect this to get even worse once Bluey and Bingo move in, in a little over a month.
Performance of Crowd Level Predictions
Each week, I give you a very transparent look into how the TouringPlans crowd level predictions performed. Each day at each park is one data point, so each week we have 28 different crowd level predictions to evaluate. Any time a prediction is within one or two crowd levels, things won’t really “feel” much different than what was predicted. Being off by 3 or more crowd levels is where you might feel that difference in wait times throughout the day.
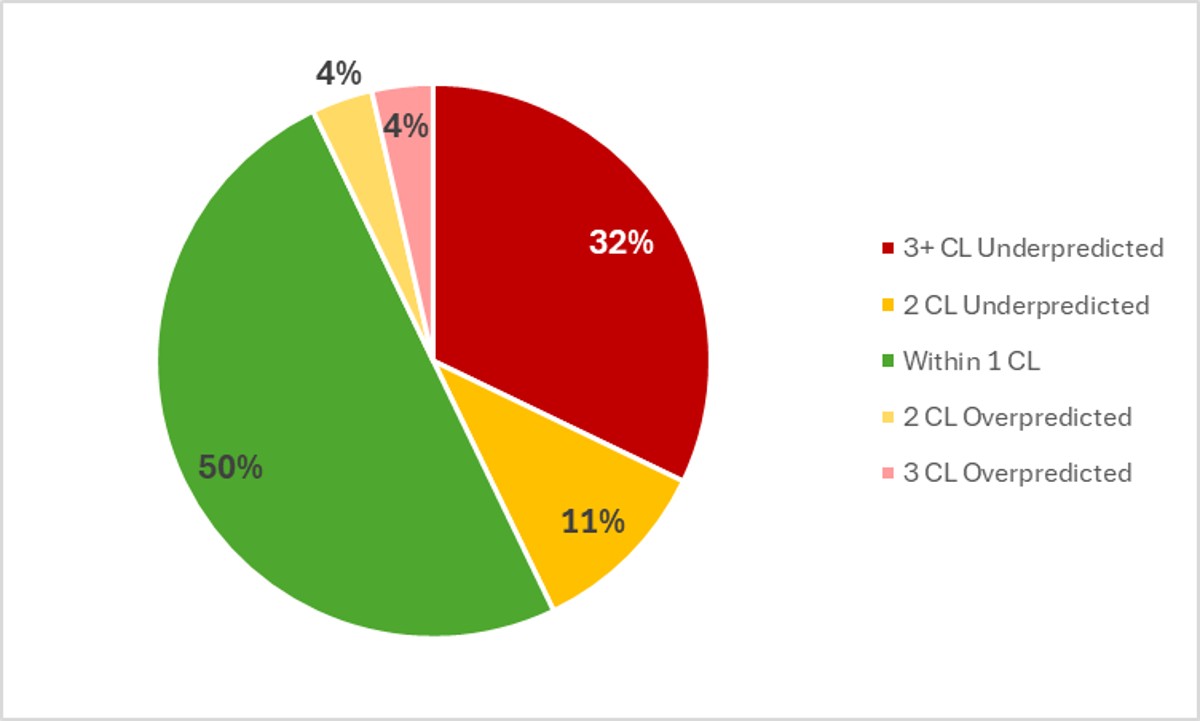
In the past week, Touring Plans predictions were either spot-on or within 1 crowd level 50% of the time, which is significantly lower than our average so far this year. And then 65% of the time Touring Plans predictions were within 2 crowd levels, so that’s a D for the predictions over the past week. What may have been disappointing to those in the parks over the past week is that a large number of misses were significant under-predictions. That means the parks were more crowded than predicted. Just like last week, all of those big underpredictions were at Hollywood Studios and Animal Kingdom. Those are the two parks with the shortest slate of attractions right now thanks to construction, so they don’t handle crowds well. The biggest miss of the week was an under-prediction by 6 crowd levels, which happened at Hollywood Studios on the 8th. There was also a miss of 5 crowd levels at Hollywood Studios on the 9th. Those are some of the biggest misses of the year.
Attraction Downtime April 7 – 13
If we average all of the capacity lost due to unexpected downtime over the past week, it comes out to 4.1% of attractions unexpectedly being down. That’s a little lower than our result from last week, but still slightly higher than what we expect during crowded seasons. Usually Disney works pretty hard to keep as much online as possible when crowds are high. In the past week, Animal Kingdom was once again the park with the most overall downtime, averaging 5.7% of its capacity lost to downtime. Thankfully, that number is quite a bit lower than the other recent “wins” at this park.
The worst day for attraction downtime in the past week was on April 7th. On that day, 6% of all capacity at WDW was lost due to unexpected downtime. And the worst park-day of the was the nice, predictable combination of the worst overall day and worst park of the past week – at Animal Kingdom on April 7th, when 8% of that park’s capacity was lost due to unexpected downtime. Animal Kingdom was open for 11 hours on the 7th, so 8% downtime is the equivalent of the entire park shutting down for just under 53 minutes. Thankfully, this is one of the least-problematic highest downtime days we’ve had in the past few months.
Attraction Downtime Worst Offender
In the past week, Kali River Rapids was yet again the WDW attraction with the worst overall downtime. It was unexpectedly down for 20% of the past week. That’s ever-so-slightly lower than its average over the past couple of months, where we’re closer to 25%. The worst day at Kali River Rapids over the last week was on April 7th, when it was down for 25% of the day. But it’s almost always up above 15% downtime.

Rope Drop Downtime
Here are problematic offenders from the past week, with the percentage of downtime during the first hour of the day in parentheses:
- Magic Kingdom: Hall of Presidents (60%), Country Bear Musical Jamboree (46%), Monsters Inc Laugh Floor (33%), Enchanted Tiki Room (31%), it’s a small world (30%), Under the Sea (21%), The Many Adventures of Winnie the Pooh (18%), The Barnstormer (12%)
- EPCOT: Frozen Ever After (14%), Test Track (13%), Remy’s Ratatouille Adventure (11%)
- Hollywood Studios: Rise of the Resistance (26%), Tower of Terror (11%)
- Animal Kingdom: No rope drop downtime issues!
Oh Magic Kingdom. Once we filter out shows that really shouldn’t be rope drop draws anyway, the list narrows down significantly to just it’s a small world, Under the Sea, Winnie the Pooh, and Barnstormer. But those are all great Fantasyland favorites for families with young kids, so it still makes rope drop tricky.
Hollywood Studios is back on track (at least temporarily) with Rise having fewer and fewer rope drop issues (we’ve trended down from over 40% to over 30% to closer to 25%), and Tower of Terror the only other attraction with significant rope drop downtime this week.
EPCOT remains tricky if you’re rope dropping from International Gateway. Those downtime numbers for Frozen and Remy aren’t huge, but they’re enough to throw a wrench in your plans and potentially force you to make the walk over to the front half of the park and be behind most of the Main Entrance rope droppers.
Wait Times April 7 – 13
Attractions with the Highest Average Posted Wait at Each Park
- EPCOT: Cosmic Rewind, average posted wait of 91 minutes (was 99 minutes at Test Track last week)
- Hollywood Studios: Slinky Dog Dash, average posted wait of 88 minutes (was 96 minutes last week)
- Magic Kingdom: TRON, average posted wait time of 79 minutes (was 82 minutes last week)
- Animal Kingdom: Flight of Passage, average posted wait time of 78 minutes (was 88 minutes last week)
Overall, the decreasing crowds throughout the past 4-ish days helped to decrease our overall averages compared to last week. I think it’s more informative to look at 4/7-9 (Tuesday through Thursday during peak Spring Break crowds) and 4/10-13 (AP blockouts are over and Spring Breakers head home) separately:
April 7-9
- Hollywood Studios: Slinky Dog Dash, average posted wait of 112 minutes
- EPCOT: Test Track, average posted wait of 98 minutes
- Magic Kingdom: TRON, average posted wait time of 89 minutes
- Animal Kingdom: Flight of Passage, average posted wait time of 82 minutes
April 10-13
- EPCOT: Cosmic Rewind, average posted wait of 87 minutes
- Animal Kingdom: Flight of Passage, average posted wait time of 75 minutes
- Magic Kingdom: TRON, average posted wait time of 72 minutes
- Hollywood Studios: Slinky Dog Dash, average posted wait of 71 minutes
Parks with the Highest and Lowest Average Wait
- Highest: Hollywood Studios, average park-wide posted wait of 43.5 minutes (was 49 minutes last week)
- Lowest: Magic Kingdom, average park-wide posted wait of 26 minutes (was 26.5 minutes last week)
Once again, this was a tale of two very different weeks presented in one 7-day retrospective. April 7th-9th saw 54-minute average waits at Hollywood Studios and 30-minute average waits at Magic Kingdom (it’s rare for that park to go over half an hour for its average). And then April 10th-13th, Animal Kingdom was the park with the highest after (40 minutes), while Hollywood Studios dropped to a 35-minute average and Magic Kingdom only had a 24-minute average.
Most Inflated Posted Wait Times
We all know that Disney inflates their posted wait times on purpose. They have many reasons for doing this. Some are totally understandable, and some are potentially more problematic. We can figure out how much posted wait times are being inflated by comparing submitted actual wait times from the Lines App and the posted wait time when the person timing their wait entered the line.
Over the past week, actual wait times in the Lines App averaged 70% of what was posted. That’s a little below our historical average in the era of Lightning Lanes, which means posted wait times were slightly more inflated than normal. Overall, if the posted wait time at a popular attraction was 60 minutes, you could’ve expected to wait just 42 minutes instead.
But the worst inflation offender for the past week was Mission: Space Orange. At this one attraction, submitted actual wait times were only 43% of posted wait times in the past week. That means that if Mission: Space had a 45 minute posted wait, you probably would have actually only waited less than 20 minutes instead. Less than half of what was posted! Remember to always check the Lines app for predicted actual waits instead of making decisions based on what is posted.
One note for this particular attraction – Disney usually works to keep the posted wait at Orange higher than Green, as a not-so-subtle encouragement for people to take the less intense route. So inflation on the Orange side is a very regular occurrence.

This Week’s Wait Time Rock Star
Between April 7th and 13th, we had just under 1200 timed actual waits submitted through the Lines app. The one person who recorded the most actual waits during that time was wozDisney, with 28 overall timed waits – 18 Lightning Lane waits, 8 standby waits, and 2 single rider waits. Thanks for all of that timing, wozDisney! It unfortunately does not compete with the the 97 timed waits in a single week from our current timing champion, preef.
Looking Ahead: April 14 – 20
I write this article on Tuesday evenings so that you all have the very freshest of data on Wednesdays. That means the 20th will already be in the past by the time you’ve read this, so we’ve done some sort of time travel!
We’ve made it. We can breathe. Spring Break is [mostly] over. The only big event in the upcoming week is the runDisney Springtime Surprise weekend, so don’t be … surprised by that. This should mean somewhat crowded resorts starting Thursday, with race events Friday, Saturday, and Sunday. None of them are a full marathon, so there shouldn’t be much park-touring impact, other than at EPCOT on Sunday, when it opens an hour later than usual.
Otherwise, expect low-ish crowds throughout the week. Crowds dropped off VERY quickly once the most popular Spring Break week wrapped up, and there’s no reason to believe that anything should make them spike back up again.
The weather outlook is pretty great for the upcoming week – plenty of sunshine, and highs in the 80s or 90s. runDisney mornings might be a little chilly in the corrals, but things will warm up quickly once the sun is up. Pack that sun protection!
Were you in the parks this past week? Or are you headed to Orlando soon? Let me know in the comments below!
You May Also Like...
-

What we saw this past week is a really good reminder that Spring Break season isn’t one clean spike. It’s a…
-

If you were hoping for an April Fools’ joke where I tell you Spring Break crowds suddenly disappeared… I regret to…
I find it interesting that you say that Animal Kingdom’s problem right now is lack of capacity, but add that crowds will get worse when Bluey and Bingo move in. I think you’re right, although the arrival of Bluey and Bingo will actually increase capacity. Even if they will not be a ride, they will draw people away from other parts of the park when they go to visit them. The problem is that their arrival will draw more people to the park in the first place.
This is why I think Disney is going to get RocknRoller Coaster open sooner rather than later. HS desperately needs capacity back.