Disney Data Dump December 10 2025
Early December really said, “Here, have everything you love … but without the lines.” Holiday decorations? Everywhere. Special treats and entertainment? Absolutely. Warm-ish weather that lets you pretend you’re in a Christmas commercial? Check. And the best part – almost no crowds. This is one of those magical stretches where the parks sparkle, wait times vanish, and you start wondering why anyone willingly vacations at any other time of year.
Of course, our charts this week aren’t just a sea of green bars. There are some fun little trends to unpack. Let’s dive into the data together!
Observed Crowd Levels December 2 – 8
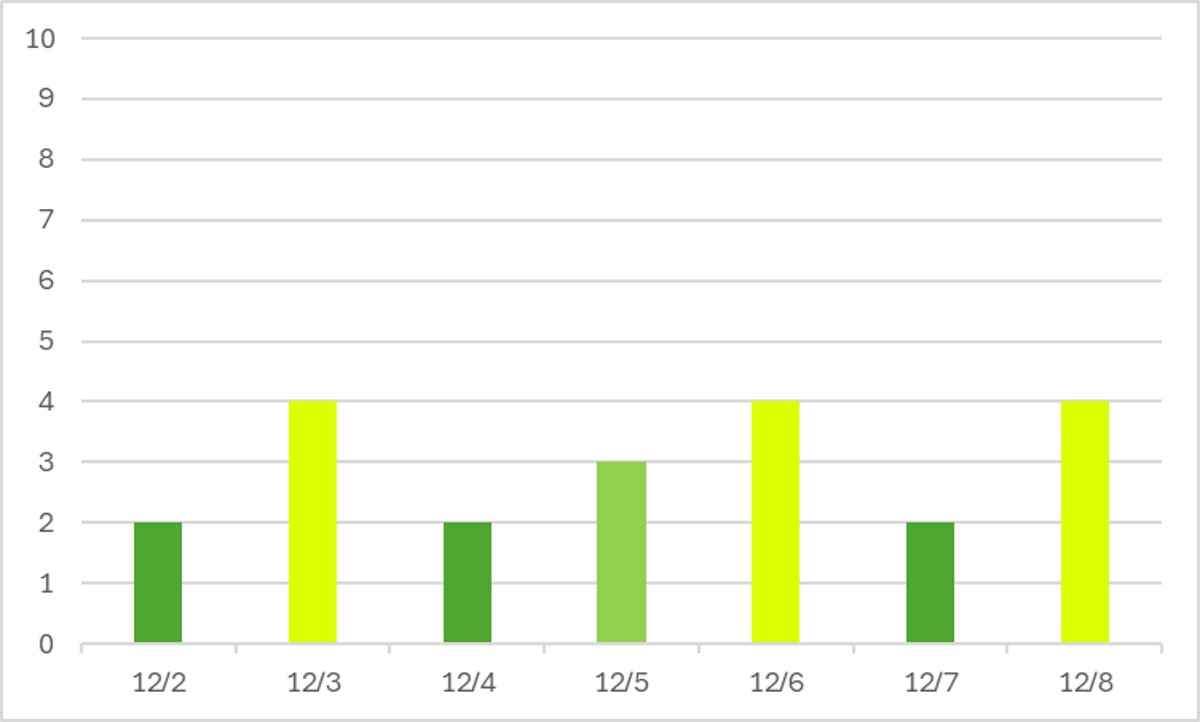
Hooray! What a glorious week to be at Walt Disney World! This early December time has all of the holiday events and decorations and food, with none of the crowds. Plus the weather is almost always reasonable (other than some rain). Love these results.
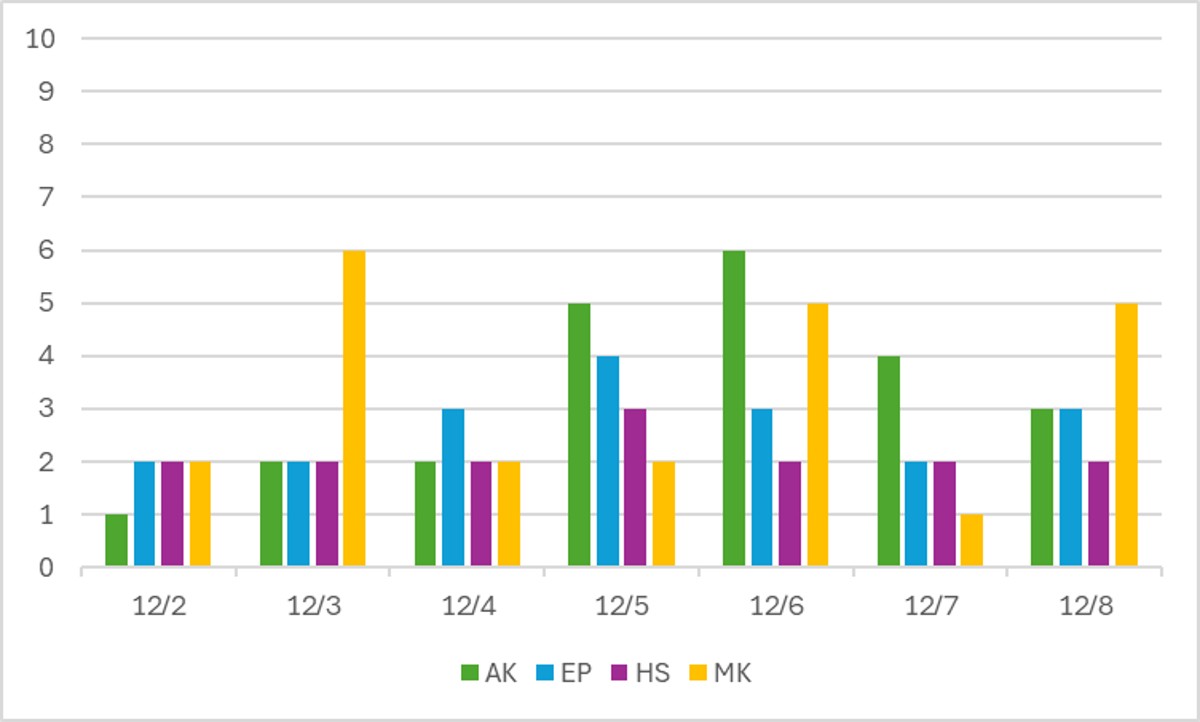
Time for our favorite weekly game – guess the party dates! This week it should be really obvious for those gold bars at Magic Kingdom. Parties were on the 2nd, 4th, 5th, and 7th. The average difference between a non-party day and party day was about 4 crowd levels. That’s a lot of waiting!
For our purple bars, the only Jollywood Nights date in the past 7 days was on the 6th. Thankfully, with just one party and low crowds, it didn’t really impact crowds too much.
Performance of Crowd Level Predictions
Each week, I give you a very transparent look into how the TouringPlans crowd level predictions performed. Each day at each park is one data point, so each week we have 28 different crowd level predictions to evaluate. Any time a prediction is within one or two crowd levels, things won’t really “feel” much different than what was predicted. Being off by 3 or more crowd levels is where you might feel that difference in wait times throughout the day.
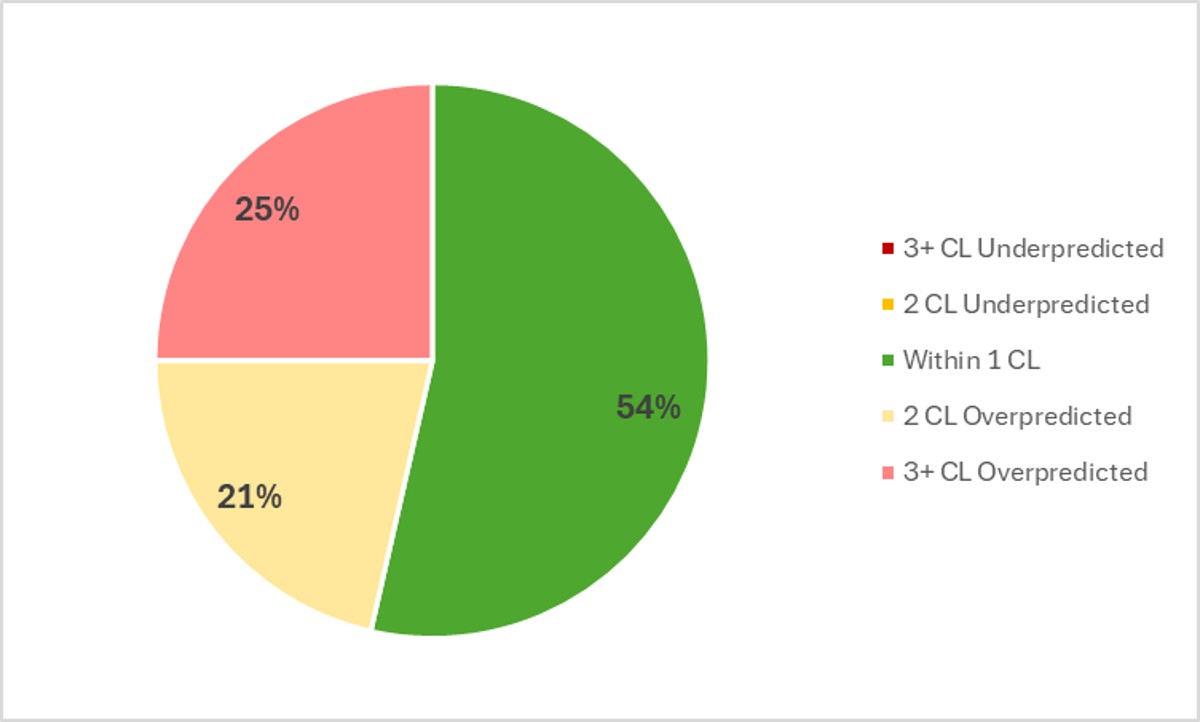
In the past week, Touring Plans predictions were either spot-on or within 1 crowd level 54% of the time, which is every so slightly better than the past couple of weeks. And then 75% of the time Touring Plans predictions were within 2 crowd levels, so that means we get a C for our predictions in the past week, which is also lower than last week. The biggest miss of the week was an overprediction by 4 crowd levels, which happened at EPCOT on December 7th. EPCOT was predicted to be a crowd level 6 that day, but only ended up being a 2.
Attraction Downtime December 2 – 8
If we average all of the capacity lost due to unexpected downtime over the past week, it comes out to 3.1% of attractions unexpectedly being down. That’s below our historical average, and even lower than last week. In the past week, EPCOT was the park with the most overall downtime, averaging 4% of its capacity lost to downtime throughout that period. Once again, no real major issues at any park. In fact, Animal Kingdom and Hollywood Studios both had downtime of less than 2%!
The worst day for attraction downtime in the past week was on December 2nd. On that day, 4% of all capacity at WDW was lost due to unexpected downtime. A really not-too-terrible worst day. And the worst park-day was at EPCOT on December 7th. On that day, 8% of EPCOT’s attraction capacity was lost due to unexpected downtime. EPCOT was open for 12.5 hours on the 7th, so 8% downtime is the equivalent of the entire park shutting down for exactly an hour.
Attraction Downtime Worst Offender
In the past week, The Many Adventures of Winnie the Pooh was again the WDW attraction with the worst overall unplanned downtime. Third week in a row! Someone go check on Pooh and friends! It was unexpectedly down for 17% of the past week. The next-closest attraction this week is worth calling out, because it was Test Track, with 15% overall downtime. The worst day at Winnie the Pooh over the last week was easily on December 2nd, when it was down for 55% of the day.
Rope Drop Downtime
Here are problematic offenders from the past week, with the percentage of downtime during the first hour of the day in parentheses:
- Magic Kingdom: The Many Adventures of Winnie the Pooh (32%), Tiana’s Bayou Adventure (29%), Astro Orbiter (17%), Under the Sea (16%), Pirates of the Caribbean (16%), The Haunted Mansion (10%)
- EPCOT: Spaceship Earth (23%), Test Track (16%), Journey Into Imagination (14%), The Seas with Nemo (12%), Frozen Ever After (11%)
- Hollywood Studios: Alien Swirling Saucers (13%), Rise of the Resistance (11%)
- Animal Kingdom: Kilimanjaro Safaris (22%)
No gold stars again this week, thanks to an exceedingly rare appearance by Kilimanjaro Safaris! Rope drop downtime here is a big deal because a lot of guests like to ride the Safari first thing in the day to try to catch active animals in the morning.
Kudos to Hollywood Studios this week for being very not-terrible. Huzzah!
Magic Kingdom and EPCOT are on the naughty list this week. Lots of early morning downtime that could impact your rope drop plans.
Wait Times December 2 – 8
Attractions with the Highest Average Posted Wait at Each Park
- EPCOT: Test Track, average posted wait of 65 minutes (was 76 minutes last week)
- Hollywood Studios: Slinky Dog Dash, average posted wait of 54 minutes (was 68 minutes last week)
- Animal Kingdom: Flight of Passage, average posted wait time of 49 minutes (was 68 minutes last week)
- Magic Kingdom: TRON, average posted wait time of 47 minutes (was 61 minutes last week)
Now if those wait time drops don’t convince you to book an early December trip to Walt Disney World next year, I don’t know what will! Only one attraction in all of Walt Disney World had an average posted wait time of more than an hour. Everything else was under an hour. A glorious time of year to visit if what you care about is low wait times. All of the holiday stuff is bonus 🙂
Parks with the Highest and Lowest Average Wait
- Highest: Hollywood Studios, average park-wide posted wait of 31.5 minutes (was 37 minutes last week)
- Lowest: Magic Kingdom, average park-wide posted wait of 19 minutes (was 20.5 minutes last week)
Magic Kingdom is in the time of year where it has four parties per week, which keeps wait times very low on those days. And in early December, the parks aren’t otherwise crowded enough to make the spikes on non-party days REALLY spiky. So overall averages stay low. And Hollywood Studios was the only park that had a park-wide average wait of over 30 minutes. That’s an uncrowded week!
Most Inflated Posted Wait Times
We all know that Disney inflates their posted wait times on purpose. They have many reasons for doing this. Some are totally understandable, and some are potentially more problematic. We can figure out how much posted wait times are being inflated by comparing submitted actual wait times from the Lines App and the posted wait time when the person timing their wait entered the line.
Over the past week, actual wait times in the Lines App averaged 67% of what was posted. That’s quite a bit below our LLMP historical average, which means that posted waits were MORE inflated than normal. So even those low posted waits don’t really reflect how uncrowded the parks really were. Overall, if the posted wait time at a popular attraction was 60 minutes, you could’ve expected to wait about 40 minutes instead.
But the worst inflation offender for the past week was Adventurer’s Outpost over at Animal Kingdom. At this one attraction, submitted actual wait times were only 46% of posted wait times in the past week. That means that if Mickey and Minnie had a 30 minute posted wait, you probably would have actually only waited 14 minutes instead. Less than half of what was posted. Remember to always check the Lines app for predicted actual waits instead of making decisions based on what is posted.

This Week’s Wait Time Rock Star
Between December 2nd and 8th, we had just over 1500 timed actual waits submitted through the Lines app. The one person who recorded the most actual waits during that time was gmcc, with 42 overall timed waits – 23 Lightning Lane waits, 15 standby waits, and 4 single rider waits. Thanks for all of that timing, gmcc! It unfortunately does not compete with the the 97 timed waits in a single week from our current timing champion, preef.
Looking Ahead: December 9 – 23
I write this article on Tuesday evenings so that you all have the very freshest of data on Wednesdays. That means the 9th will already be in the past by the time you’ve read this, so you’ve made it to the future! We’re also covering two weeks of data here because I’ve got surgery scheduled on the 15th, which means I won’t be able to catch us up next week.
Party dates to consider: Jollywood Nights will be at Hollywood Studios on December 10th, 13th, 17th, 20th, and 22nd. That means that as crowds pick up later in the month, the 21st may be an especially crowded day at Hollywood Studios. Even more importantly, Mickey’s Very Merry Christmas Party will mean Magic Kingdom closes early to guests on the 9th, 11th, 12th, 14th, 16th, 18th, 19th, and 21st. Look out for the 20th – it’ll be one of the most crowded days of the year at Magic Kingdom (before we get to the between-Christmas-and-NYE crush). The 17th might be unpleasant too.
It’s looking to be a cool couple of weeks in Orlando, with highs in the upper 60s or low 70s. This sometimes mean startup troubles for attractions in the chilly mornings. But it should definitely mean that you bring some jackets or sweatshirts with you on your vacation! Don’t get caught paying $80 for a hoodie just because you’re cold!
As far as crowd trends go, we should see at least one more week of decently low crowds as schools across the country wrap up their semesters. It’s a difficult time of year to take students out of school, so fewer families travel down to Orlando. But once those winter breaks come along, all bets are off. Wait times will start picking up – but things shouldn’t get too crazy until after Christmas. That’s when we always see the highest crowds every year.
Were you in the parks this past week? Or are you headed to Orlando soon? Let me know in the comments below!
You May Also Like...
-

It’s officially that fun little in-between season at Walt Disney World! The brief window after Thanksgiving crowds head home, but before…
-

Welcome to June, and to the first full week of Cool Kid Summer at Walt Disney World! With new deals in…
Trying to wrap my head around why Kilamanjaro Safaris would be down. Did the animals go on strike, lol? Or was there some kind of weather damage (like a big tree blocking the path somehow)? Do you happen to know?
I’d be interested to know, what the 4 bar levels difference in MK party and non-party dates translates to to actual number of rides. Does the non-party dates with the additional park hours, compensate for the increased crowds when it comes to the number of actual rides you can get in.
Good question – I’ve done the math somewhere (might have been in IG and not here), the difference between crowd level 2 and 6 is about 4 hours of waiting in line for headliners throughout the day.
Would love to see a Data Dump on prior holidays weeks (Christmas-New Year) to help compare just how different early December is to the end of December!
Godspeed on a quick recovery!!