Disney Data Dump February 18 2026
February is always a bit of a wild card at Walt Disney World. You can get stretches that feel almost suspiciously calm, where wait times are manageable and the parks feel easy to navigate. And then suddenly, without much warning (unless you read this blog …), everything changes. Holiday weekends, school breaks, and seasonal travel patterns all collide, and those comfortable touring conditions disappear basically overnight.
That’s exactly what happened this past week. The first few days looked like classic “good February” territory. But by the time the long weekend arrived, wait times had surged, crowd levels had jumped, and the parks started to feel very different depending on when and where you were touring. Let’s take a closer look at what happened, and what it means for the rest of the month.
Observed Crowd Levels February 10 – 16
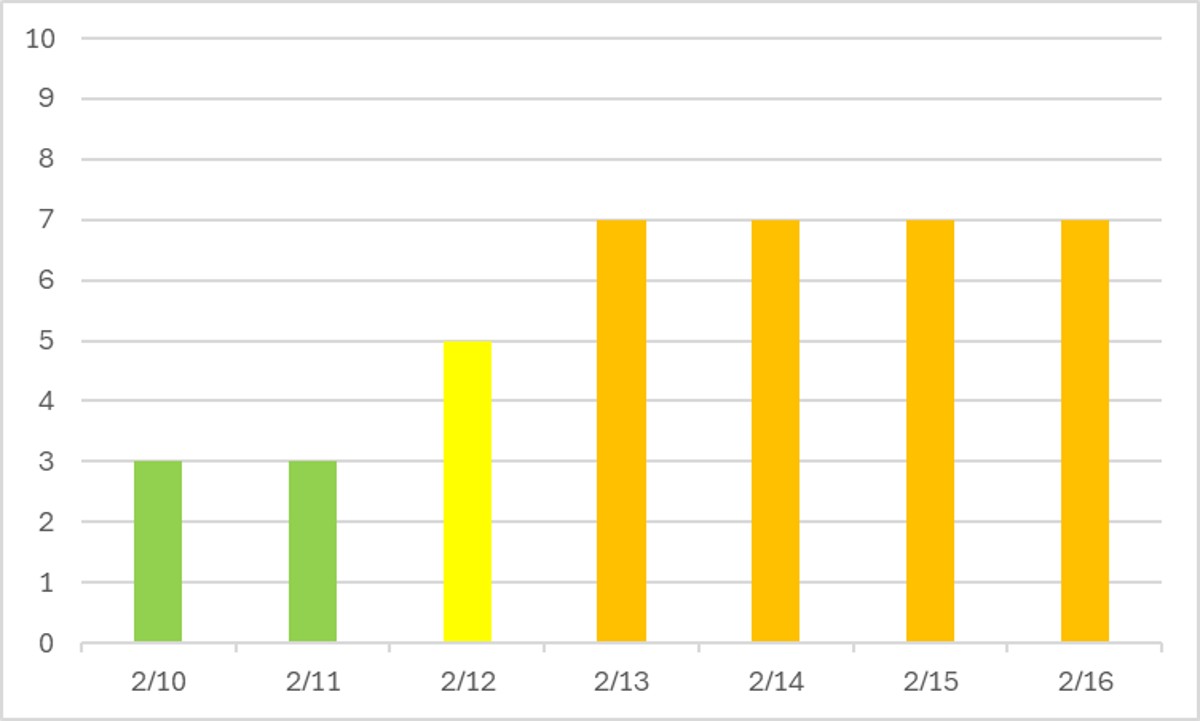
Oh hey, worst weekend of the winter! This graph gives us a great glimpse into February in general – pretty manageable crowds … until they’re not. Especially this year, with Valentine’s Day, President’s Day, Mardi Gras (on 2/17) and Ski Week all coinciding. These 7s are the biggest crowd levels we’ve seen since January 2nd and 3rd. And we probably won’t see the same sharp fall-off of crowds we saw after those dates. These crowds will linger this week.
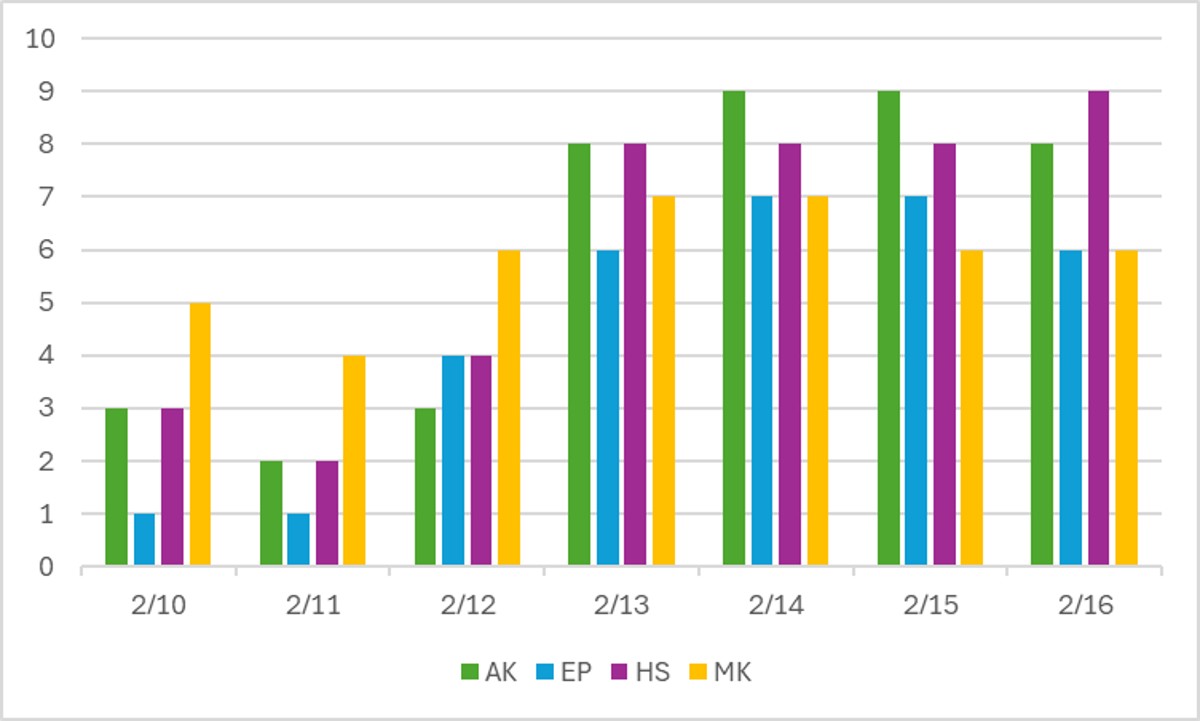
At the park level we have a few interesting trends too. Like I’ve been calling out for a while, “Diet Animal Kingdom” (what I’m calling AK with all of its extensive closures until at least the summer) can’t handle crowds. It’s still the least-popular park of the four, but there are so few attractions open that wait times spike very high more quickly than other parks during crowded seasons. That’s a big reason AK had the highest crowd levels on the 13th, 14th, and 15th. On the opposite end of that equation is Magic Kingdom. It has SO many attractions that it’s able to absorb crowds well – as evidenced by its lowest crowd levels Feb 14-16.
Performance of Crowd Level Predictions
Each week, I give you a very transparent look into how the TouringPlans crowd level predictions performed. Each day at each park is one data point, so each week we have 28 different crowd level predictions to evaluate. Any time a prediction is within one or two crowd levels, things won’t really “feel” much different than what was predicted. Being off by 3 or more crowd levels is where you might feel that difference in wait times throughout the day.
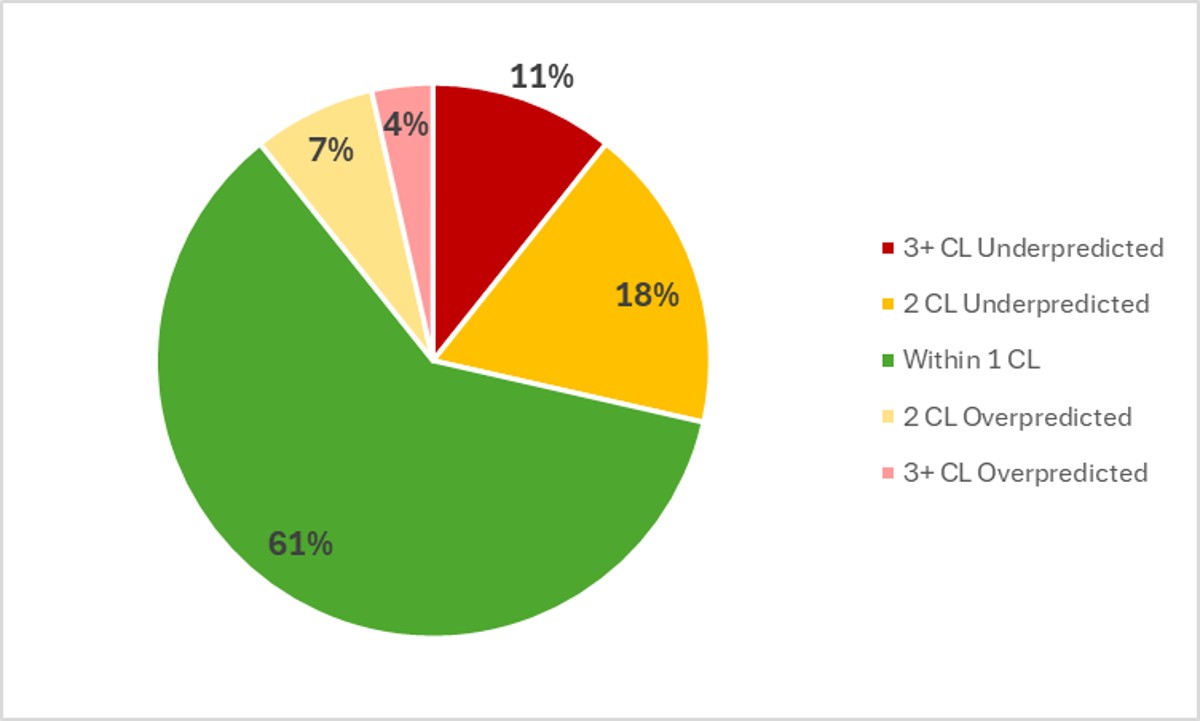
In the past week, Touring Plans predictions were either spot-on or within 1 crowd level 61% of the time, which is exactly the same as last week. And then 85% of the time Touring Plans predictions were within 2 crowd levels, so that means we get a B for our predictions in the past week, which is almost the same as last week. For the first time since … I can remember, we’re not particularly skewed toward overpredictions this week either! The biggest miss of the week was actually an underprediction of 4 crowd levels, which happened twice at Hollywood Studios – on the 14th, Studios was predicted to see a crowd level 4, but hit a crowd level 8. And on the 16th, Studios was predicted at crowd level 5, but hit a remarkable crowd level 9. Boo.
Attraction Downtime February 10 – 16
If we average all of the capacity lost due to unexpected downtime over the past week, it comes out to 5.1% of attractions unexpectedly being down. That’s still above our historical average, which tends to happen in the winter. In the past week, Magic Kingdom was the park with the most overall downtime, averaging 6% of its capacity lost to downtime throughout that period. EPCOT and Hollywood Studios were both at 4.9% downtime for the week.
The worst day for attraction downtime in the past week was on February 12th. On that day, 7% of all capacity at WDW was lost due to unexpected downtime. But the worst park-day of the week happened on February 13th at Hollywood Studios. On that day, 12% of attraction capacity at Hollywood Studios was lost due to unexpected downtime. Hollywood Studios was open for 12.5 hours on the 9th, so 12% downtime is the equivalent of the entire park shutting down for 90 minutes. That has a big impact on wait times throughout the day!
Attraction Downtime Worst Offender
For the second week in a row, Space Mountain was the WDW attraction with the worst overall unplanned downtime. It was unexpectedly down for 23% of the past week. (It missed 27% of the previous week). Those are both big downtime numbers for a big headliner. The worst day at Space Mountain over the last week was easily on February 16th, when it was down for 61% of the day. But it was down for 57% of the 10th as well. Just a bunch of spotty unreliability.
Rope Drop Downtime
Here are problematic offenders from the past week, with the percentage of downtime during the first hour of the day in parentheses:
- Magic Kingdom: Monsters Inc Laugh Floor (52%), Country Bear Jamboree (41%), Tiana’s Bayou Adventure (34%), TTA PeopleMover (21%), Space Mountain (20%), Carousel of Progress (20%), Magic Carpets (18%), Seven Dwarfs Mine Train (15%), The Many Adventures of Winnie the Pooh (14%)
- EPCOT: Frozen Ever After (37%), Journey Into Imagination (16%), Living with the Land (16%), Test Track (10%), Spaceship Earth (10%)
- Hollywood Studios: Slinky Dog Dash (25%), Rock’n’Roller Coaster (13%), Millennium Falcon (11%)
- Animal Kingdom: No rope drop downtime issues!
Gold star for Animal Kingdom this week! I can’t remember the last time that we’ve had a park-week with no rope drop downtime issues.
On the other hand … Magic Kingdom. This is the second week in a row with a large number of attractions with significant rope drop downtime issues. We’re back to a world where Peter Pan’s Flight is the best early entry rope drop option, statistically speaking. And Tron is a good option for regular rope drop.
Wait Times February 10 – 16
Attractions with the Highest Average Posted Wait at Each Park
- EPCOT: Cosmic Rewind, average posted wait of 93 minutes (was 83 minutes last week)
- Animal Kingdom: Flight of Passage, average posted wait time of 92 minutes (was 81 minutes last week)
- Hollywood Studios: Slinky Dog Dash, average posted wait of 83 minutes (was 64 minutes last week)
- Magic Kingdom: TRON, average posted wait time of 79 minutes (was 77 minutes last week)
These are some significant increases over last week. And almost all of them happened in the last half of the week. In fact, if we split the week in two (2/10-2/12 and 2/13-2/16), this is what the results look like:
- EPCOT: Cosmic Rewind – 65 minutes | 114 minutes
- Animal Kingdom: Flight of Passage – 66 minutes | 108 minutes
- Hollywood Studios: Slinky Dog Dash – 67 minutes | 99 minutes
- Magic Kingdom: TRON – 69 minutes | 86 minutes
February 10th through 12th was fine. Lovely, even. And then this long weekend has seen posted waits that are close to the worst of the year.
Parks with the Highest and Lowest Average Wait
- Highest: Hollywood Studios, average park-wide posted wait of 45 minutes (was 38 minutes last week)
- Lowest: Magic Kingdom, average park-wide posted wait of 26 minutes (was 23 minutes last week)
Once again, the weekly numbers look a little higher than moderate, but not terrible. But the real impact of long weekend crowds are hidden. If we split the week, we get:
- Highest: Hollywood Studios – 34 minutes | 54 minutes
- Lowest: Magic Kingdom – 24 minutes | 27.5 minutes
Both Animal Kingdom and Hollywood Studios had overall average posted waits of 54 minutes from February 13th through 16th. That means as you were wandering the park, the average of every single posted wait time you would pass was almost an hour. That’s a big deal, and makes it very difficult to tour efficiently.
Most Inflated Posted Wait Times
We all know that Disney inflates their posted wait times on purpose. They have many reasons for doing this. Some are totally understandable, and some are potentially more problematic. We can figure out how much posted wait times are being inflated by comparing submitted actual wait times from the Lines App and the posted wait time when the person timing their wait entered the line.
Over the past week, actual wait times in the Lines App averaged 73% of what was posted. That’s slightly above our historical average in the era of Lightning Lanes, which means that posted waits are not as inflated as normal! Overall, if the posted wait time at a popular attraction was 60 minutes, you could’ve expected to wait about 44 minutes instead.
But the worst inflation offender for the past two weeks was Na’vi River Journey. At this one attraction, submitted actual wait times were only 43% of posted wait times in the past week. That means that if Na’vi River Journey had a 60 minute posted wait, you probably would have actually only waited less than 26 minutes instead. Less than half of what was posted! Remember to always check the Lines app for predicted actual waits instead of making decisions based on what is posted.

This Week’s Wait Time Rock Star
Between February 10th and 16th, we had just under 1000 timed actual waits submitted through the Lines app. The one person who recorded the most actual waits during that time was jlm1689, with 19 overall timed waits – and they were all standby waits. Hard mode! Thanks for all of that timing, jlm1689! It unfortunately does not compete with the the 97 timed waits in a single week from our current timing champion, preef.
Looking Ahead: February 17 – 23
I write this article on Tuesday evenings so that you all have the very freshest of data on Wednesdays. That means the 17th will already be in the past by the time you’ve read this, so welcome to your future!
Mardi Gras is on the 17th, which extends the already-long weekend for many school districts in the Southeast. That means that on top of Ski Week breaks from the Northeast, even more families will be able to extend their WDW trips for the week. I think wait times will be slightly lower than the peaks of the long weekend, but they won’t suddenly disappear like they did after the New Years break earlier this year. Expect at least moderate crowds throughout the week and into early next week.
Weather for most of the week looks lovely, with sun and highs in the 80s. But a “cold front” moves through on Sunday (the 22nd), with highs for the few following days barely breaking into the 60s. If you’ll be in Orlando on the 23rd or 24th, be prepared with your jackets or sweatshirts. Don’t get caught having to pay for expensive layers at the gift shops!
Were you in the parks this past week? Or are you headed to Orlando soon? Let me know in the comments below!
You May Also Like...
-

And we're back!! If you're a weekly Disney Data Dump reader, I apologize for the interlude while we went through all…
-

Remember how last week I said crowds would probably stay in the 3-5 range? I take it back. I take it…
I am very interested to hear about the model change impacts and if it was « responsible » somehow in the over predictions.
It seems the busy week was even busier