Disney Data Dump February 25 2026
Last week I warned that this wasn’t just going to be a crowded long weekend – that the crowds would hang around for a while. And… here we are. No dramatic drop. No clean reset. Just steady, stubborn February busyness that refused to disappear once the holiday calendar flipped over.
This is a really good example of how winter crowd patterns behave differently than fall. Instead of sharp spikes and sharp declines, we get extended stretches of moderate-to-high wait times. And this week had a few extra twists thrown in for good measure, especially at one park that decided to behave very strangely at the end of its festival run.
Let’s dive into the data together!
Observed Crowd Levels February 17 – 23
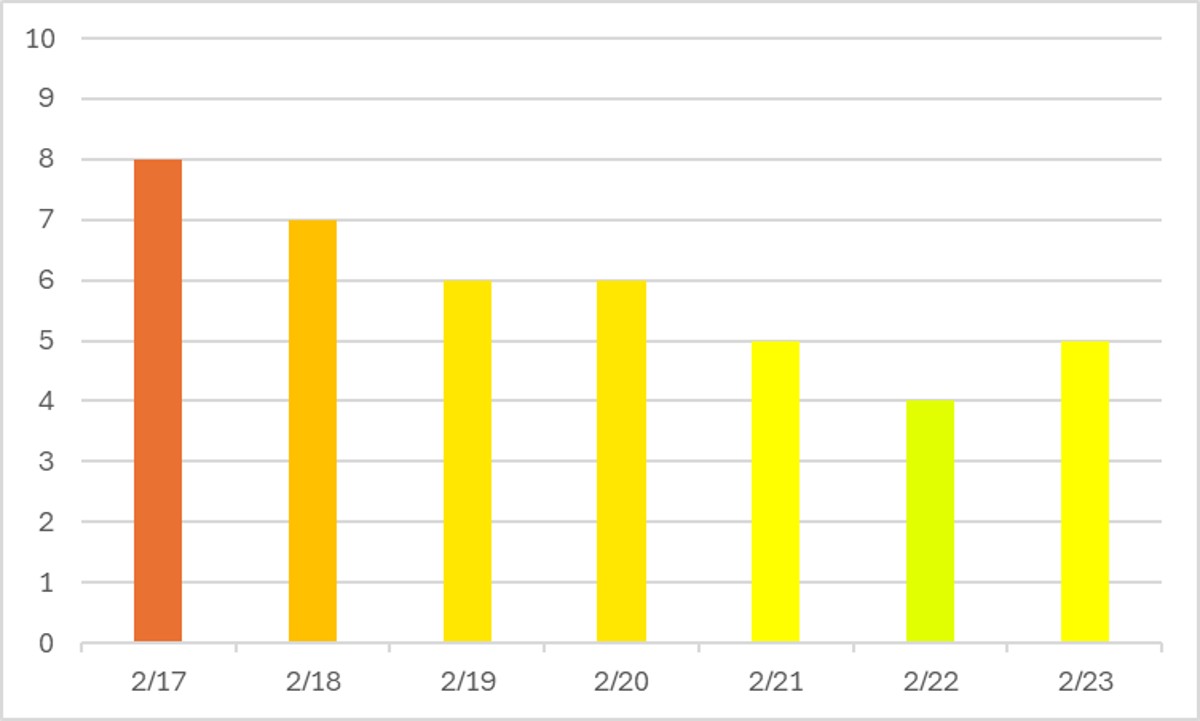
Remember when I said last week that it wasn’t just going to be a crowded long weekend? That the crowds would linger throughout the week? Look at that lingering! No sharp drop-off after weekends in the fall. Things didn’t get back to below average until Sunday … and then immediately bounced back up a little.
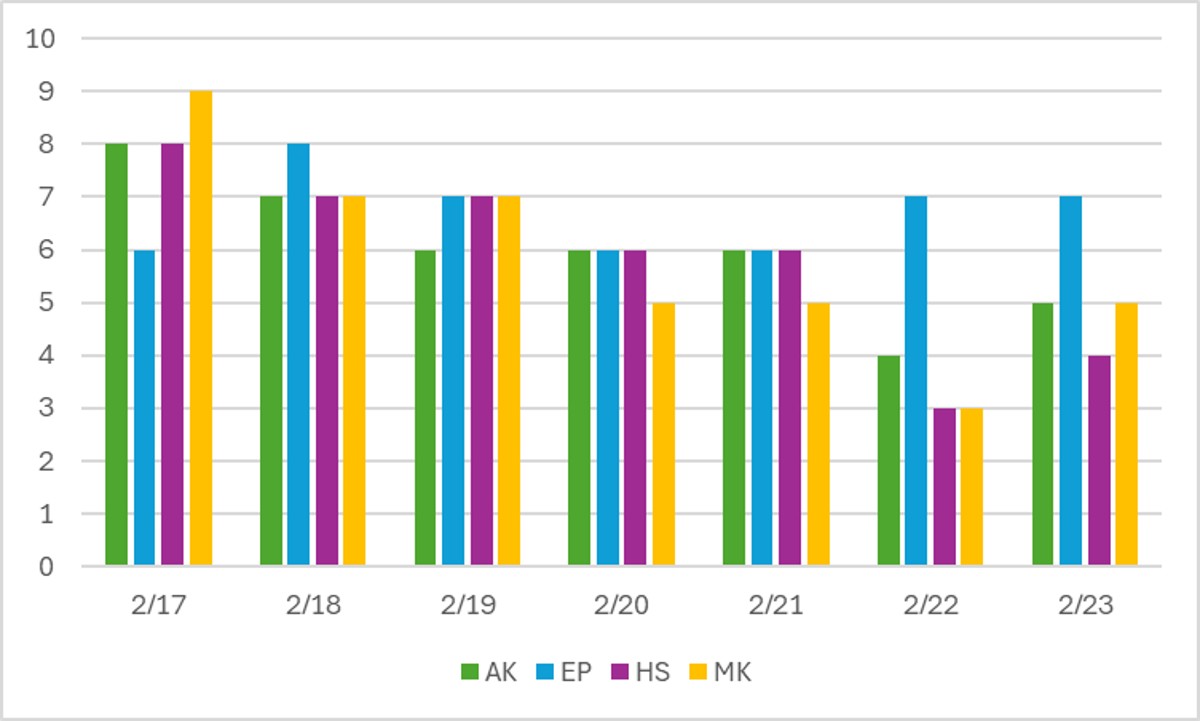
At the park level, we can see that the 22nd and 23rd probably would have actually had slightly lower overall crowd levels if it weren’t for EPCOT. This is very odd behavior, and really it’s only happening (I think) because those were the last two days of Festival of the Arts, a very popular time to visit EPCOT. Diet EPCOT season starts on the 24th and will last through March 3rd. Otherwise, there’s not much of note in differences between parks.
Performance of Crowd Level Predictions
Each week, I give you a very transparent look into how the TouringPlans crowd level predictions performed. Each day at each park is one data point, so each week we have 28 different crowd level predictions to evaluate. Any time a prediction is within one or two crowd levels, things won’t really “feel” much different than what was predicted. Being off by 3 or more crowd levels is where you might feel that difference in wait times throughout the day.
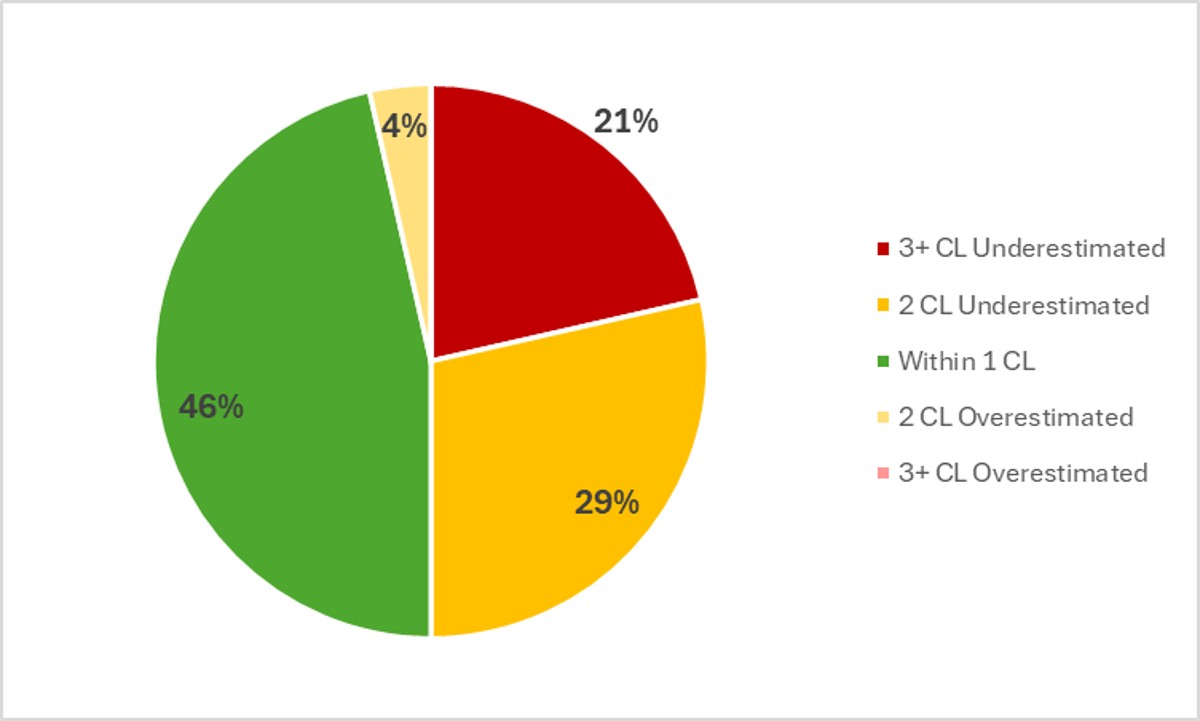
In the past week, Touring Plans predictions were either spot-on or within 1 crowd level 46% of the time, which is significantly lower than the past two weeks. And then 79% of the time Touring Plans predictions were within 2 crowd levels, so that means we get a C+ for our predictions in the past week, which is also lower than the past two weeks. And the weirdest thing of all is that half of the park-days were significant underpredictions. I called out that this was going to be the most crowded week of the winter, but predicted crowd levels didn’t particularly reflect that. The biggest misses of the week were two underpredictions by 4 crowd level – on the 17th, Magic Kingdom was predicted to see a crowd level 5, but hit a crowd level 9. And on the 22nd, EPCOT was predicted at crowd level 3, but hit a crowd level 7 thanks to the draw of Festival of the Arts.
Attraction Downtime February 17 – 23
If we average all of the capacity lost due to unexpected downtime over the past week, it comes out to 4.6% of attractions unexpectedly being down. That’s close to our historical average, and slightly lower than the past couple of weeks. In the past week, EPCOT was by far the park with the most overall downtime, averaging 7.1% of its capacity lost to downtime throughout that period. No other park peaked above 5% overall downtime for the week.
The worst day for attraction downtime in the past week was on February 18th. On that day, 9% of all capacity at WDW was lost due to unexpected downtime. Almost 10% of overall downtime! Yikes. The worst park-day of the week also happened on February 18th at EPCOT. Prepare yourselves for this. On that day, 21% of attraction capacity at EPCOT was lost due to unexpected downtime. I think that might be our highest single park-day downtime number ever! Spaceship Earth was down almost all day, The Seas was down for almost half of the day, and Frozen Ever After was down for almost a third of the day, along with other scattered downtime throughout the park. EPCOT was open for 12 hours on the 18th, so 21% downtime is the equivalent of the entire park shutting down for 151 minutes. 2.5 hours of the entire park opening late or shutting down early or deciding to take a long lunch break. That has a big impact on wait times throughout the day!
Attraction Downtime Worst Offender
This week, Spaceship Earth was the WDW attraction with the worst overall unplanned downtime. It was unexpectedly down for 28% of the past week. More than a quarter of the week! That’s a big downtime number for a really core attraction. The worst day at Spaceship Earth over the last week was easily on February 18th, when it was down for almost the whole day. But it was down for two thirds of the day on the 22nd as well.
Rope Drop Downtime
Here are problematic offenders from the past week, with the percentage of downtime during the first hour of the day in parentheses:
- Magic Kingdom: Monsters Inc Laugh Floor (47%), Country Bear Jamboree (45%), Space Mountain (34%), The Barnstormer (26%), Tiana’s Bayou Adventure (21%), Hall of Presidents (21%), Peter Pan’s Flight (20%), Pirates of the Caribbean (13%)
- EPCOT: Spaceship Earth (35%), Test Track (34%), Frozen Ever After (31%), Remy’s Ratatouille Adventure (21%), The Seas (13%)
- Hollywood Studios: Rock’n’Roller Coaster (16%), Slinky Dog Dash (13%)
- Animal Kingdom: No rope drop downtime issues!
Gold star for Animal Kingdom this week! Second week in a row. Hopefully it keeps up the trend, with so few attractions to choose from.
EPCOT is on the naughty list this week for the first time in a while. Test Track, Frozen Ever After, and Remy’s all need to have reliable rope drops to allow this park to operate efficiently. When all three show up on the list, it’s really bad news.
And Magic Kingdom continues to underperform with huge lists of rope drop unreliability. Even my usually-recommendable Peter Pan’s Flight shows up this week!
Wait Times February 17 – 23
Attractions with the Highest Average Posted Wait at Each Park
- EPCOT: Cosmic Rewind, average posted wait of 90 minutes (was 93 minutes last week)
- Hollywood Studios: Slinky Dog Dash, average posted wait of 79 minutes (was 83 minutes last week)
- Animal Kingdom: Flight of Passage, average posted wait time of 77 minutes (was 92 minutes last week)
- Magic Kingdom: TRON, average posted wait time of 74 minutes (was 79 minutes last week)
Overall, we can see some easing up in the wait times compared to last week, which covered the long weekend. But these are still above-average wait times, and should be some of the highest weekly averages that we see all year, only being outdone by the week after New Years Day, last week, and potentially one or two weeks of Spring Break.
Parks with the Highest and Lowest Average Wait
- Highest: Hollywood Studios, average park-wide posted wait of 44.5 minutes (was 45 minutes last week)
- Lowest: Magic Kingdom, average park-wide posted wait of 25.5 minutes (was 26 minutes last week)
Once again, the weekly numbers are still above average, but ever so slightly lower than last week. It was still a crowded week, but it didn’t quite compete with the long weekend itself.
Most Inflated Posted Wait Times
We all know that Disney inflates their posted wait times on purpose. They have many reasons for doing this. Some are totally understandable, and some are potentially more problematic. We can figure out how much posted wait times are being inflated by comparing submitted actual wait times from the Lines App and the posted wait time when the person timing their wait entered the line.
Over the past week, actual wait times in the Lines App averaged 75% of what was posted. That’s well above our historical average in the era of Lightning Lanes, which means that posted waits are not as inflated as normal! Overall, if the posted wait time at a popular attraction was 60 minutes, you could’ve expected to wait 45 minutes instead.
But the worst inflation offender for the past week was Mission: SPACE. At this one attraction, submitted actual wait times were only 37% of posted wait times in the past week. That means that if Mission: SPACE had a 30 minute posted wait, you probably would have actually only waited just about 11 minutes instead. Almost a third of what was posted! Remember to always check the Lines app for predicted actual waits instead of making decisions based on what is posted.
This Week’s Wait Time Rock Star
Between February 17th and 23rd, we had just over 1000 timed actual waits submitted through the Lines app. The one person who recorded the most actual waits during that time was mbcollins, with 21 overall timed waits – 2 Lightning Lane waits and 19 standby waits. Thanks for all of that timing, jlm1689! It unfortunately does not compete with the the 97 timed waits in a single week from our current timing champion, preef.
Looking Ahead: February 24 – 30
I write this article on Tuesday evenings so that you all have the very freshest of data on Wednesdays. That means the 24th will already be in the past by the time you’ve read this, so welcome back to the future!
We’ve made it through the real February crush and should now generally be coasting until the second half of March, when Spring Break season swings into high gear. The one slight exception is this upcoming weekend, when the runDisney Princess Half Marathon events are taking place. Runners will arrive on the 26th (or earlier), with the 5k on Friday, 10k on Saturday, and half marathon on Sunday. Since there is no full marathon, this won’t have a huge impact on park operations. The biggest impact will be on Sunday at EPCOT as half marathoners may still be finishing up after park opening – but opening for EPCOT is delayed that day until 10 am anyway.
If you can make it to the parks in the morning, or stay late at night, you should have an especially lovely weekend because runners will be recovering from their events, or going to bed early for their middle-of-the-night wakeup calls.
I’m participating in the races this weekend (I walk, I don’t run …) for the first time ever, for science! So I’ll have more thoughts to share next week.
Weather for most of the week looks lovely, with the one big exception rearing its head just in time for race weekend. It looks like rain and storms will kick off late on the 27th and continue through most of the 28th. It’ll be a soggy 10k, and a damp Saturday for anyone touring the parks that day. Be prepared with your rain gear!
Were you in the parks this past week? Or are you headed to Orlando soon? Let me know in the comments below!
You May Also Like...
-

And we're back!! If you're a weekly Disney Data Dump reader, I apologize for the interlude while we went through all…
-
February is always a bit of a wild card at Walt Disney World. You can get stretches that feel almost suspiciously…
I appreciate these posts!
I also wondered about the underpredictions. Did the changes to the model overcompensate for last year’s overpredictions? Or did it not fully consider the impact of the holiday? Or are travel patterns changing (e.g., are international travel trends coming back to the norm)? Something else?
Agreed, would love to hear more comments about the why on the significant misses on crowd projection. I had some plans built in the app for many months now and got a notification about 2 months ago that the crowd projections had been lowered for my dates. So Tuesday 2/17 was lowered from a 6 to a 5, but actually ended up around 9! I’m wondering why the crowd projections were lowered when anyone in the know would say that the week Mardi Gras meets President’s Day is known to be crazy. It is what it is and lesson learned for me, but I used the app plan I had built/crowd projection to make the decision to not buy LLMP. Based on what I experienced, I wish I had made a different decision.
Thanks again for the analysis ; are the over predictions directly linked with changes to the model or other factors ?
The photo accompaniments are really stellar this week.