Disney Data Dump July 30 2025
We may have found the crowd calendar’s favorite summer hobby: the slow, cautious climb. No, it’s not a surge. But it is higher than early July. So far, Starlight hasn’t lured the masses other than just during parade time, Test Track’s return isn’t impacting overall EPCOT wait times, and Animal Kingdom is apparently being held together with duct tape. But wait times are sneaking upward across the board, and not even Magic Kingdom’s low crowd levels could hold back a bump in its park-wide average. Let’s call it what it is: a simmer, not a boil.
Observed Crowd Levels July 22 – 28
Ok, so this still doesn’t look like big crowds. And it’s not. But they are significantly up compared to early July. Weekends, and especially Sundays, continue to be the lowest-crowd days. This is a trend that we’ve been seeing for months and months, but it’s worth calling out again because I feel like families avoid weekends because they think those days will be most crowded.
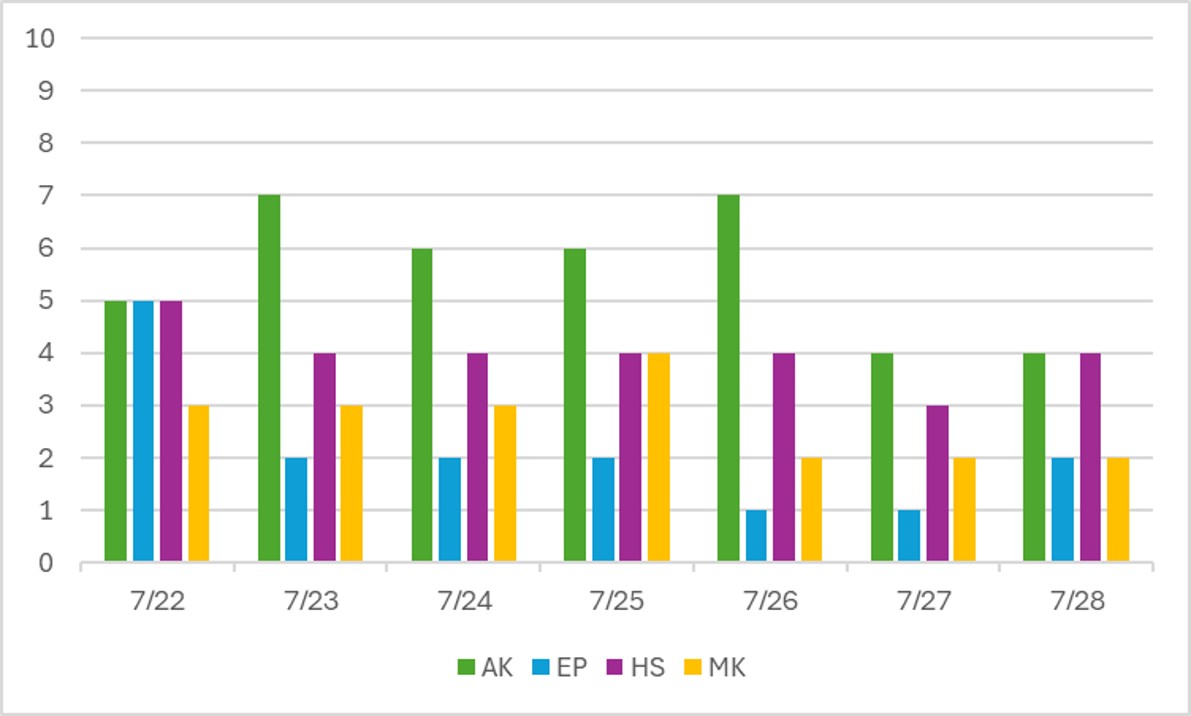
Oh boy, poor Animal Kingdom is having a rough time. More on that later. EPCOT, meanwhile, is having its lowest crowds of the year. Even with the reopening of Test Track, we’re not seeing a huge impact on the rest of the park. Instead, “Diet EPCOT” (when no festival is running) continues to be a great time to visit if all you care about is the park and low wait times, and not festival booths. And as I called out last week, Hollywood Studios is more steadily in the crowd level 4 range, instead of the 2s and 3s we were seeing earlier this summer.
But the big story here is Magic Kingdom. Other than a blip on the 22nd, it’s stayed in the crowd level 1 or 2 range. This doesn’t mean that you can go see Starlight Parade and get a prime viewing seat without showing up pretty early. It’s important to remember that crowd levels are measures of wait times, not humans lining a parade route. But even Disney has noticed that people aren’t showing up to Magic Kingdom other than for the parade. As a result, they’ve already removed some reservation restrictions and blockouts (like for Cast Members). That should lead to some increases in wait times at Magic Kingdom, but it probably won’t make a huge splash.
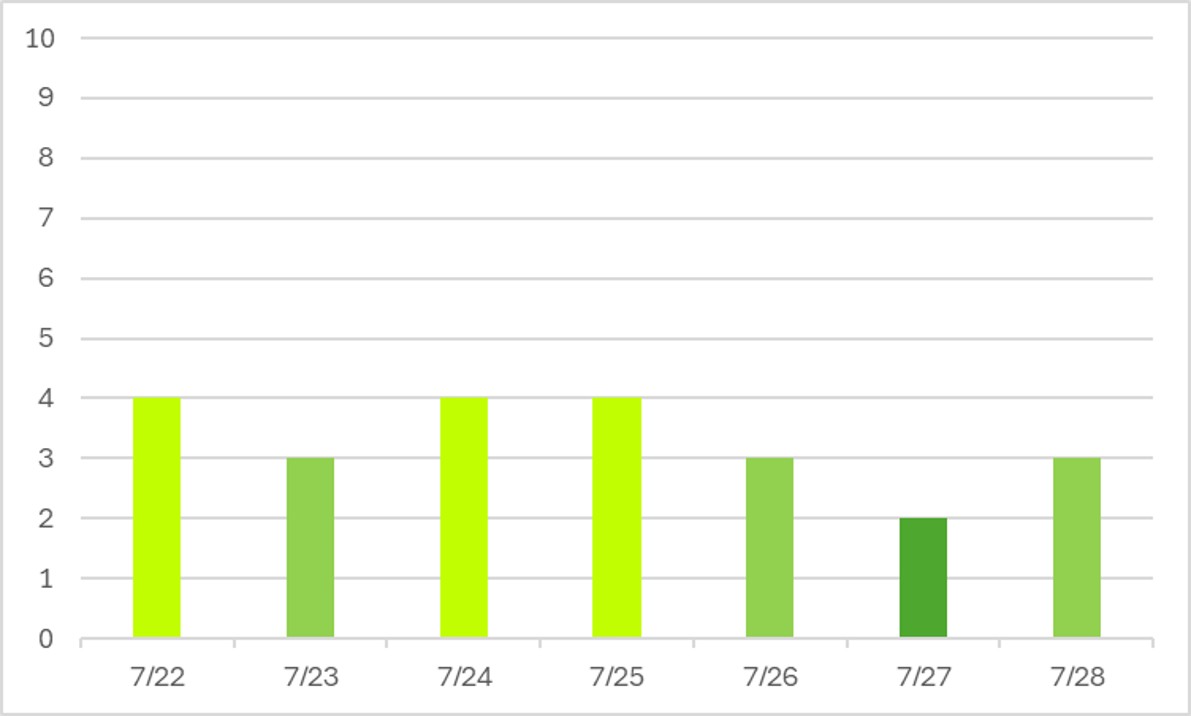
Performance of Crowd Level Predictions
Each week, I give you a very transparent look into how the TouringPlans crowd level predictions performed. Each day at each park is one data point, so each week we have 28 different crowd level predictions to evaluate. Any time a prediction is within one or two crowd levels, things won’t really “feel” much different than what was predicted. Being off by 3 or more crowd levels is where you might feel that difference in wait times throughout the day.
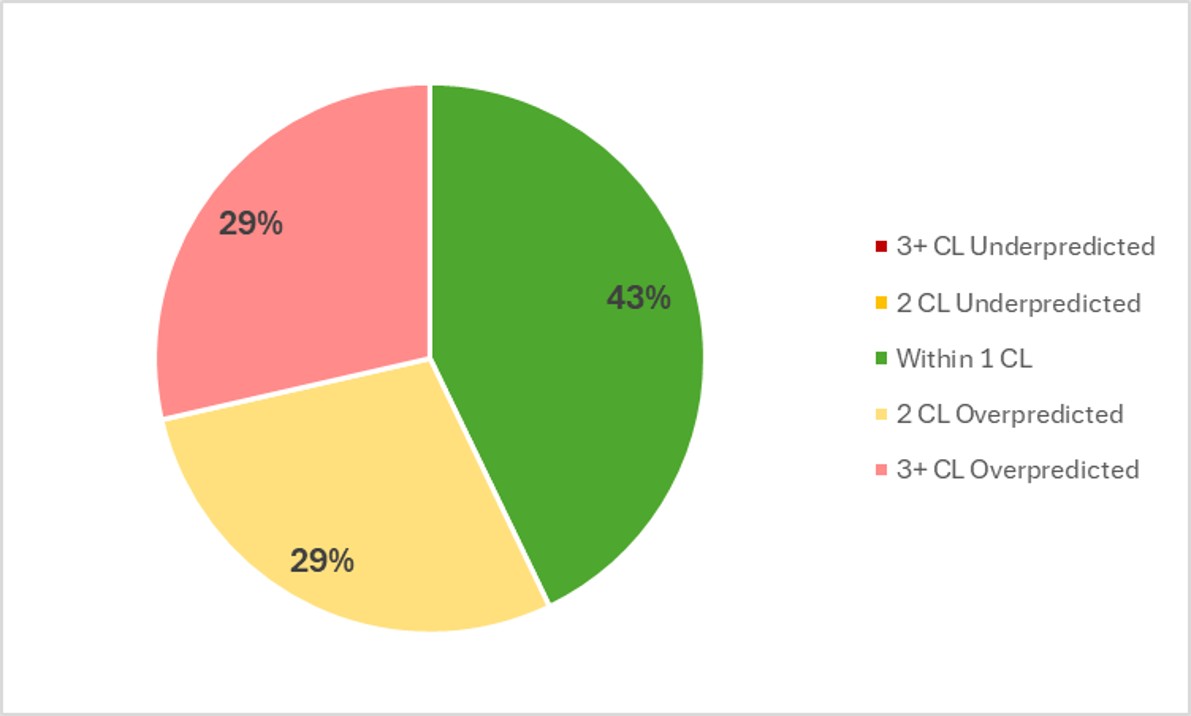
As a reminder, a big crowd calendar overhaul happened last week. You can read more about that here. In the past week, Touring Plans predictions were either spot-on or within 1 crowd level 43% of the time, which is a significant increase from what we’ve seen for all of 2025 so far. 71% of the time Touring Plans predictions were within 2 crowd levels, so that means we get a C- for our predictions in the past week. Again, that’s much higher than the average result for the year. All misses were over-predictions, meaning that crowds came in lower than expected throughout the past week. On average, the crowd level at any park any day of the week was about 1.8 crowd levels below prediction. That’s within our “feels roughly the same” margin overall, and it’s the first time it’s been less than 2 crowd levels all year. The biggest miss of the week was an overprediction by 4 crowd levels, which happened at EPCOT on the 25th … and 26th, 27th, and 28th.
Attraction Downtime July 22 – 28
If we average all of the capacity lost due to unexpected downtime over the past week, it comes out to 5.7% of attractions unexpectedly being down. That’s much higher than average, even considering summer storms. In the past week, Animal Kingdom was the park with the most overall downtime, averaging 10.1% of its capacity lost to downtime throughout the week. Let that sink in for a minute. Over the course of an entire week, more than 10% of Animal Kingdom’s attraction capacity evaporated thanks to unexpected downtime. That has a huge impact on wait times and crowd levels, as seen in the park-by-park results above.
The worst day for attraction downtime in the past week was on July 25th. On that day, 8% of all capacity at WDW was lost due to unexpected downtime. The worst park-day of the week was on July 26th at Animal Kingdom. On that day, 16% of attraction capacity was lost due to unexpected downtime. Animal Kingdom was open for 11 hours on the 26th, so 16% downtime is the equivalent of the entire park shutting down for 105 minutes. Out of a 660 minute day. If the park randomly closed almost 2 hours early, or opened almost 2 hours late, everyone would be up in arms. But this is essentially the same thing happening, spread throughout the day.
Attraction Downtime Worst Offender
In the past week, Expedition Everest was the WDW attraction with the worst overall downtime. It was unexpectedly down for 31% of the past week. That’s one of the highest downtime numbers we’ve seen in a single week … ever! And it definitely contributed to the overall downtime woes at Animal Kingdom this week. The worst day at Everest was on July 26th, when the attraction was down for 74% of the day. But it was also down 68% of the day on the 27th. And ~25% of the day on the 24th and 25th. Rough week.

Rope Drop Downtime
Prepare yourselves for this one. You’re not ready. Here are problematic offenders from the past week, with the percentage of downtime during the first hour of the day in parentheses:
- Magic Kingdom: Under the Sea (40%), Pirates of the Caribbean (31%), Seven Dwarfs Mine Train (26%), Space Mountain (25%), Haunted Mansion (17%), Buzz Lightyear (16%), TTA PeopleMover (13%), Mickey’s PhilharMagic (11%)
- EPCOT: Frozen Ever After (14%), Remy’s Ratatouille Adventure (13%), Journey Into Imagination (12%)
- Hollywood Studios: Rise of the Resistance (34%), Slinky Dog Dash (26%), Rock’n’Roller Coaster (21%)
- Animal Kingdom: Navi River Journey (14%), Expedition Everest (13%), Dinosaur (11%)
I called last week a bad rope drop week, and that’s my bad. I jinxed this week. Look at that Magic Kingdom list – almost nothing was spared. If you arrived during early entry, Peter Pan was your best bet. And for once, miraculously, Tiana’s Bayou Adventure didn’t have early reliability issues. So that’s something?
Hollywood Studios is especially problematic this week, too. Rise of the Resistance and Slinky both had issues with early downtime, and Rock’n’Roller Coaster is back on the list too. Those are arguably three of the biggest rope drop draws in the park, so for all three to appear on the list … ouch. That makes rope drop crowds at other attractions higher too.
Definitely no gold stars this week.
Wait Times July 22 – 28
Attractions with the Highest Average Posted Wait at Each Park
Once again, prepare yourselves. Some big shifts this week.
- Hollywood Studios: Rise of the Resistance, average posted wait of 100 minutes (was 67 minutes at Slinky Dog Dash last week)
- EPCOT: Test Track, average posted wait of 90 minutes (was 72 minutes at Cosmic Rewind last week)
- Animal Kingdom: Flight of Passage, average posted wait time of 74 minutes (was 61 minutes last week)
- Magic Kingdom: TRON, average posted wait time of 67 minutes (was 65 minutes last week)
TWO newcomers to the highest posted wait list this week. Rise of the Resistance had a very high-wait week, beating out Slinky Dog Dash for the first time in a long time. And it didn’t just squeak past … it BLEW past. For reference, Slinky was at 67 minutes last week and 74 minutes this week. So wait times were up overall, but WAY up at Rise.
And Test Track is the cool new kid on the block this week, with the wait times to prove it. Wait times were up at Cosmic Rewind too (77 minutes this week, compared to 72 minutes last week), but not enough to keep up with Test Track. Test Track also had close to 20% downtime for the week, so that impacts wait times when it’s open.
Parks with the Highest and Lowest Average Wait
These parks likely won’t change week-to-week unless something ridiculous happens (oh hey, change this week), but these data points will give us a high-level view of how wait times are trending from week to week.
- Highest: Hollywood Studios, average park-wide posted wait of 38 minutes (was 33 minutes at Animal Kingdom last week)
- Lowest: Magic Kingdom, average park-wide posted wait of 22 minutes (was 20 minutes last week)
The huge increase at Rise of the Resistance was enough to push the overall average past Animal Kingdom (which was at 37 minutes this week). And even Magic Kingdom, with its crowd level 1 and 2 days, was up a little bit. So we’re seeing some late-summer surge. But not a lot.
Most Inflated Posted Wait Times
We all know that Disney inflates their posted wait times on purpose. They have many reasons for doing this. Some are totally understandable, and some are potentially more problematic. We can figure out how much posted wait times are being inflated by comparing submitted actual wait times from the Lines App and the posted wait time when the person timing their wait entered the line.
Over the past week, actual wait times in the Lines App averaged 71% of what was posted. That’s a significant bump up from our average this year. More on that in a bit. Overall, if the posted wait time at a popular attraction was 60 minutes, you could’ve expected to wait just 43 minutes instead.
A lot of that increase is thanks to one attraction. One newly reopened attraction. Actual wait times are coming in higher than what is posted a significant number of times. And oddly, it seems to be throwing off predictions at Cosmic Rewind too. Things have been stead there, but just this week there are once again a lot of actual wait times coming in over what was posted. So be wary of what is posted at those two headliners in the coming weeks.
But the worst inflation offender for the past week was Navi River Journey. For the second week in a row! At this one attraction, submitted actual wait times were only 30% of posted wait times in the past week. That means that if Navi River Journey had a 45 minute posted wait, you probably would have actually only waited less than 13 minutes instead. Less than a third of what was posted. Remember to always check the Lines app for predicted actual waits instead of making decisions based on what is posted.

This Week’s Wait Time Rock Star
Between July 22nd and 28th, we had over 1000 timed actual waits submitted through the Lines app. The one person who recorded the most actual waits during that time was stinkpickle (ok, you get a bonus award for funny username), with 30 overall timed waits – and it was in hard mode, with all standby waits. Thanks for all of that timing, stinkpickle! It unfortunately does not compete with the the 97 timed waits in a single week from our current timing champion, preef.
Looking Ahead: July 29 – August 4
I write this article on Tuesday evenings so that you all have the very freshest of data on Wednesdays. That means the 29th will already be in the past by the time you’ve read this, so welcome back to the future!
Nothing remarkable is happening over the next week. Or month. Ha! As we move into mid-August, fewer families will be making WDW trips thanks to school starting up for the fall. Typically, August is a heavier month for international visitors, but international travel to the US as a whole is down, so we’ll see what that means for already-low August crowds. I expect things to stay in the crowd level 3-4 range. It looks like Disney expects that too, with no major changes to park operating hours.
‘Tis the season for high temps and afternoon storms. Actually, temperatures will be so high that those afternoon storms will feel like a big blessing! Stay hydrated … and dry 🙂
Were you in the parks this past week? Or are you headed to Orlando soon? Let me know in the comments below!
You May Also Like...
-

For the first time ever, this week’s Data Dump comes to you from the back porch of Jambo House, with giraffes…
-

We’ve officially crossed the threshold into the “Starlight Summer” era … and so far, it’s more sparkle than surge. The parade…
Agreed! The number of attractions down for rope drop last week was ridiculous And we needed productive Early Entry time to help us avoid the midday heat. It was rough. Otherwise, I would have been able to submit more standby waits. 😉
I always enjoy these Data Dumps every week. One thing I was thinking that was causing lower weekend traffic (I could easily be wrong) but I know the flights on the weekends here in the DMV area cost more on the weekends than they do during the week.