Disney Data Dump September 10 2025
If you’re looking for the quietest time of year to be in Walt Disney World, here it is. The week after Labor Day almost never disappoints (I’ve been recommending it for years!), and 2025 is proving no exception. Crowd levels barely nudged above a 2 all week, and most days were about as close to empty as the parks get outside of hurricanes. The only real “blip” came from heavy rain pushing Animal Kingdom and Magic Kingdom up a bit, but otherwise this is the week touring dreams are made of – if you’re willing to put up with heat indexes that make you question your life choices.
Observed Crowd Levels September 2 – 8
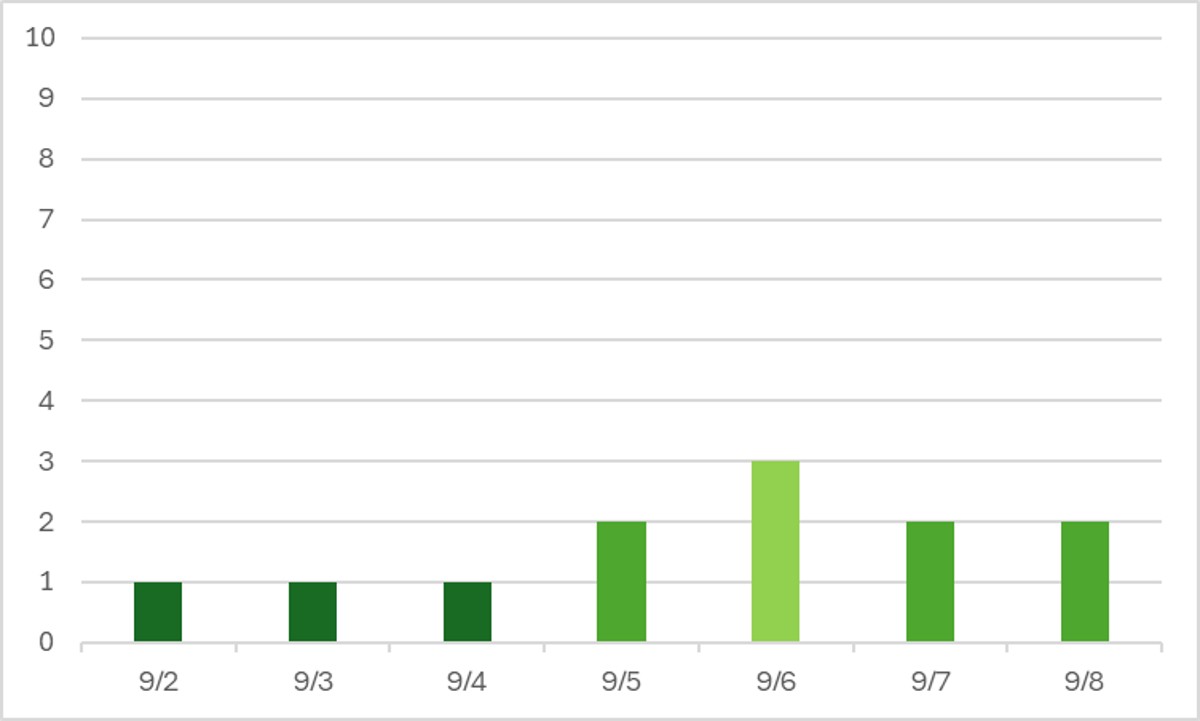
This is why I personally love the week after Labor Day, and always recommend it to people who want to avoid crowds (and don’t care about heat). The 6th was the only day to register above a crowd level 2, and that was mostly thanks to heavy rain causing attraction downtime for outdoor options, and increasing waits at indoor options.
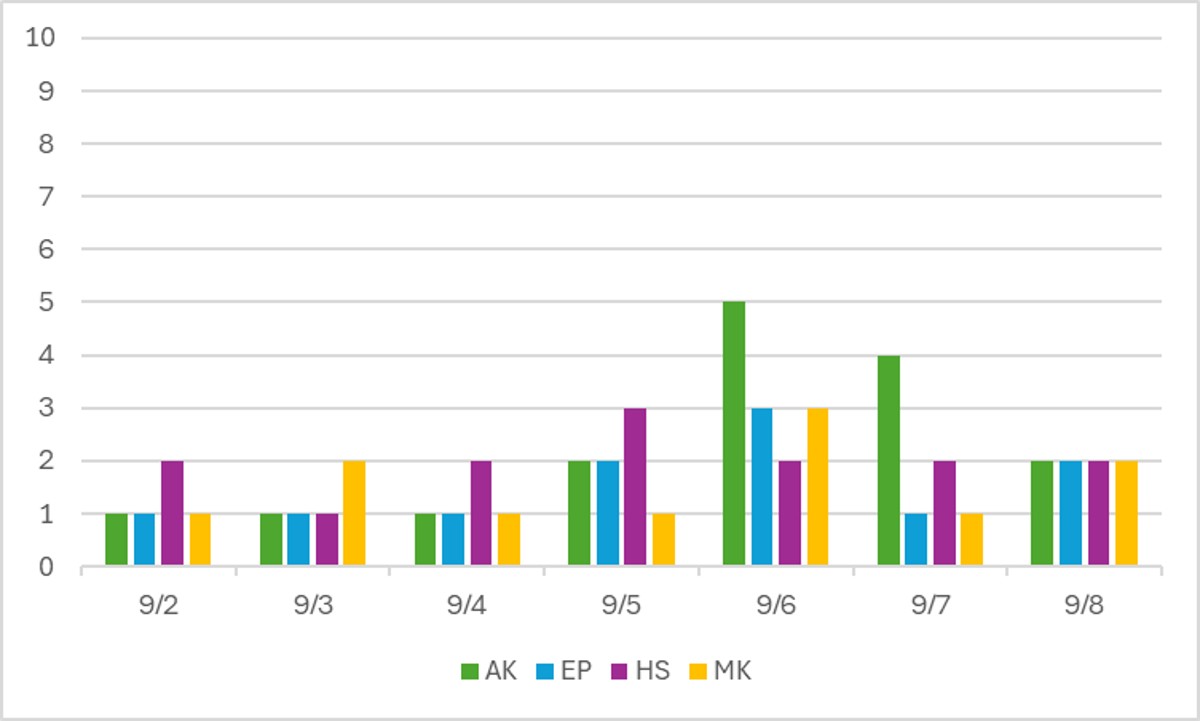
Look, I’m not saying that if you were in the parks on the 2nd, 3rd, or 4th that I’m jealous of you. Actually, no, that’s exactly what I’m saying. MK parties happened on the 2nd, 5th, and 7th (and 9th), so that explains our higher “crowds” at Magic Kingdom on the 3rd, 6th, and 8th. And the impact of rain at Animal Kingdom is very clear on the 6th and 7th too.
Performance of Crowd Level Predictions
Each week, I give you a very transparent look into how the TouringPlans crowd level predictions performed. Each day at each park is one data point, so each week we have 28 different crowd level predictions to evaluate. Any time a prediction is within one or two crowd levels, things won’t really “feel” much different than what was predicted. Being off by 3 or more crowd levels is where you might feel that difference in wait times throughout the day.
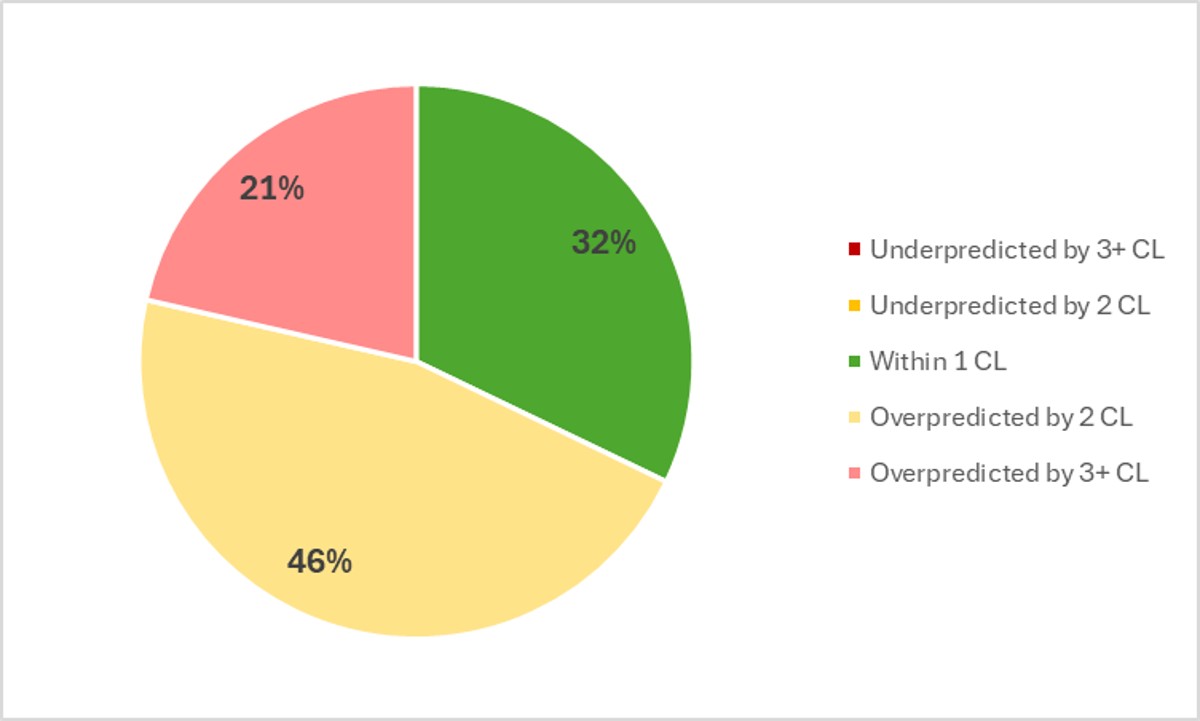
Well, this unfortunately looks more like our “normal” result for the past year or so. In the past week, Touring Plans predictions were either spot-on or within 1 crowd level 32% of the time, which is not nearly as good as the past couple of weeks. 78% of the time Touring Plans predictions were within 2 crowd levels, so that means we get a C+ for our predictions in the past week. On average, the crowd level at any park any day of the week was 2.1 crowd levels below prediction. That’s noticeable. We only had one spot-on park-day prediction, and literally everything else from the past week was an overprediction. The biggest miss of the week was an overprediction by 5 crowd levels, at Magic Kingdom on September 4th. The park was predicted to be a crowd level 6, but only ended up at a crowd level 1.
Attraction Downtime September 2 – 8
If we average all of the capacity lost due to unexpected downtime over the past week, it comes out to 3.6% of attractions unexpectedly being down. That’s actually below our historical average, so that’s even more great news for people taking advantage of low crowds this week. In the past week, Hollywood Studios was the park with the most overall downtime, averaging 5% of its capacity lost to downtime throughout the week.
The worst day for attraction downtime in the past week was on September 6th. On that day, 6% of all capacity at WDW was lost due to unexpected downtime. The worst park-day of the week was also predictably on the 6th, but at Animal Kingdom. On that day, 11% of its attraction capacity was lost due to unexpected downtime. Animal Kingdom was open for 10 hours on the 6th, so 11% downtime is the equivalent of the entire park shutting down for just over an hour.
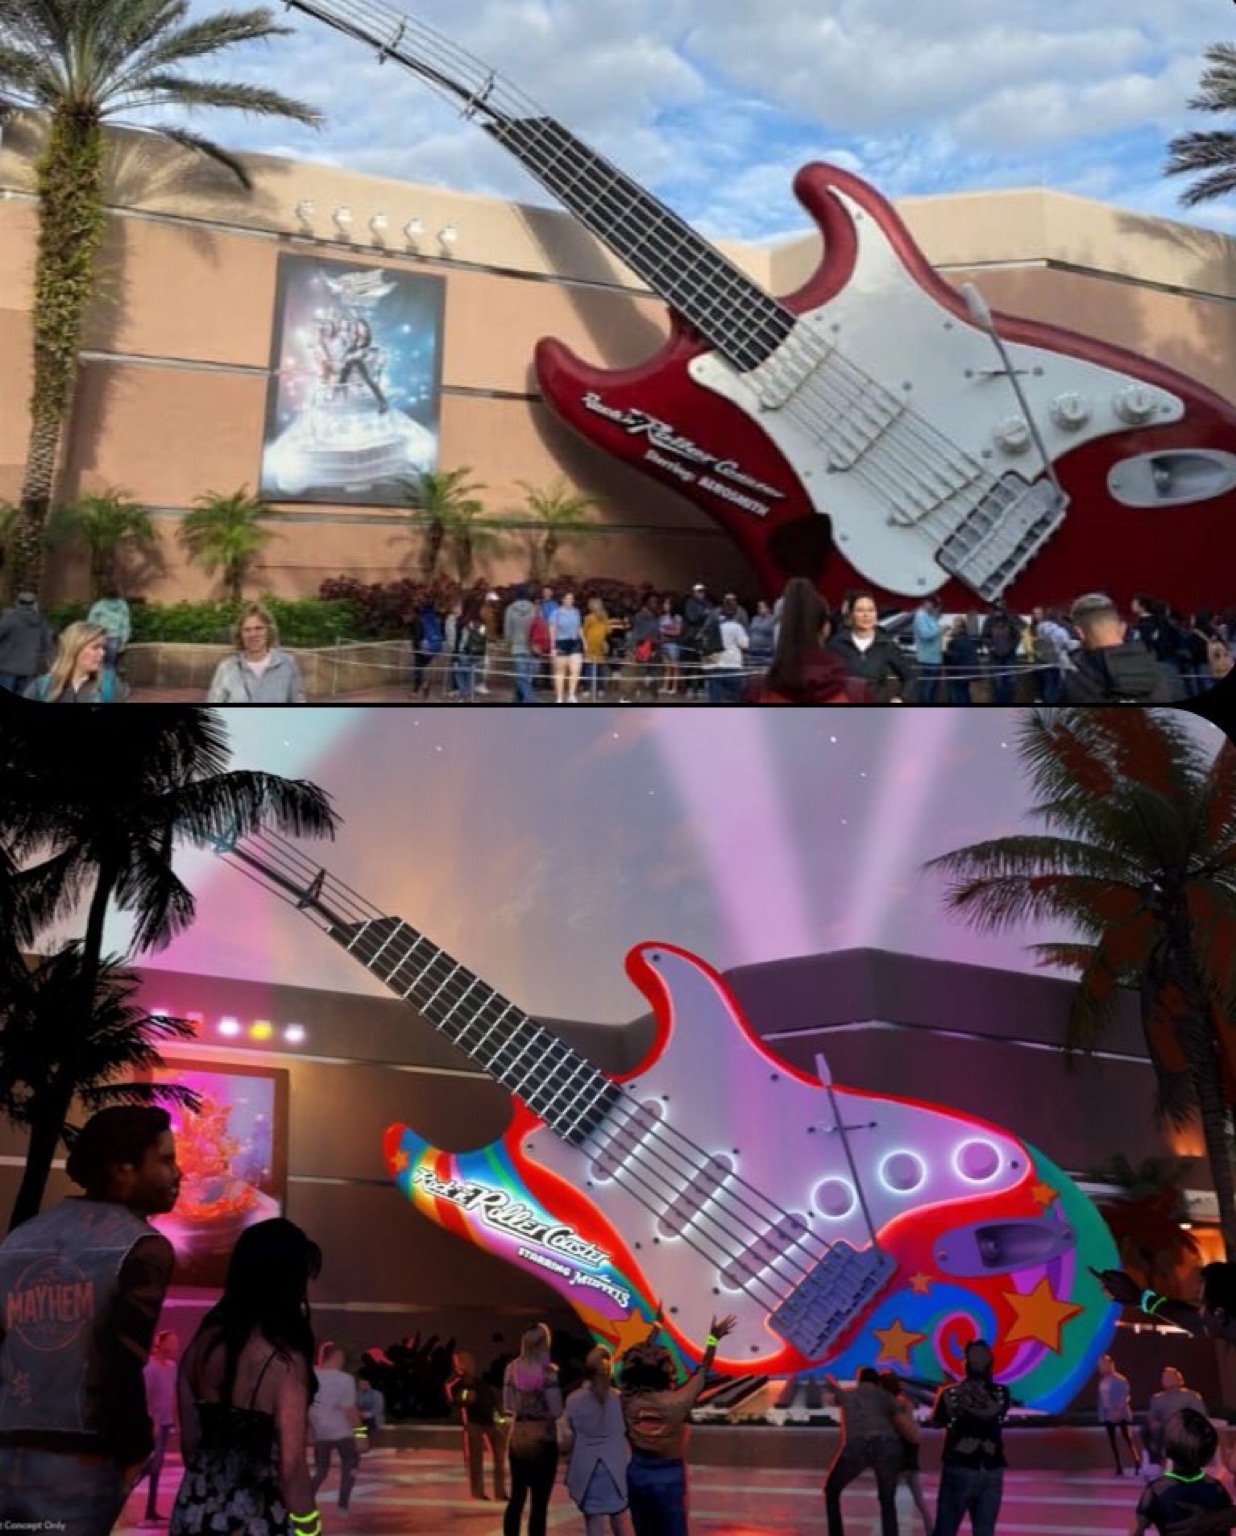
Attraction Downtime Worst Offender
In the past week, Rock’n’Roller Coaster was the WDW attraction with the worst overall downtime. It was unexpectedly down for 19% of the past week. The worst day at RNRC was on September 2nd, when it was down for 50% of the day. But it was down for 47% of the day on the 4th too.
Since I’ve also been keeping close track of Test Track (see what I did there?), I’m somewhat happy to report that it “only” had 13% downtime this week. That’s still the 2nd-highest downtime of any attraction at WDW, but it’s the first time since it reopened that its weekly downtime has dipped below 20%. So that’s … something.
Rope Drop Downtime
Here are problematic offenders from the past week, with the percentage of downtime during the first hour of the day in parentheses:
- Magic Kingdom: Tiana’s Bayou Adventure (46%), Under the Sea (17%), TTA PeopleMover (17%)
- EPCOT: Test Track (16%), The Seas (13%), Cosmic Rewind (12%), Remy’s Ratatouille Adventure (11%)
- Hollywood Studios: Rock’n’Roller Coaster (39%), Slinky Dog Dash (14%), Tower of Terror (11%), Runaway Railway (11%)
- Animal Kingdom: No rope drop issues!
Once again, our rope drop downtime issues are trending down. Hooray! Still, EPCOT and Hollywood Studios continue to be at least a little tricky, with several headliners showing up on the list.
Another gold star to Animal Kingdom this week!
Wait Times September 2 – 8
Attractions with the Highest Average Posted Wait at Each Park
- EPCOT: Test Track, average posted wait of 65 minutes (was 72 minutes last week)
- Hollywood Studios: Rise of the Resistance, average posted wait of 61 minutes (was 71 minutes last week)
- Magic Kingdom: TRON, average posted wait time of 48 minutes (was 51 minutes last week)
- Animal Kingdom: Flight of Passage, average posted wait time of 42 minutes (was 46 minutes last week)
Unsurprisingly, average posted waits at headliners were down this week, even compared to an already-low week last week. Only Test Track and Rise of the Resistance managed to top an hour for their average posted wait. And look at that number for Flight of Passage! I would like Disney to take note that maybe it’s finally time to give this headliner the rolling refurb (closing just one theater at a time) that it deserves and needs. Ok, maybe not in fall and winter when things get more crowded. But maybe next summer? Before the new Tropical Americas land draws more people to the park? I’m sure my recommendations to them hold a lot of weight.
Parks with the Highest and Lowest Average Wait
These parks likely won’t change week-to-week unless something ridiculous happens, but these data points will give us a high-level view of how wait times are trending from week to week.
- Highest: Hollywood Studios, average park-wide posted wait of 26 minutes (was 28.1 minutes at EPCOT last week)
- Lowest: Magic Kingdom, average park-wide posted wait of 16.5 minutes (was 17 minutes last week)
Food & Wine being open has had just enough of an impact to push wait times at EPCOT higher than Hollywood Studios. Barely. But the overall average posted wait for all of Walt Disney World in the past week was under 21 minutes. That’s absolutely wild. The only time it’s been lower this year was just after 4th of July.
Most Inflated Posted Wait Times
We all know that Disney inflates their posted wait times on purpose. They have many reasons for doing this. Some are totally understandable, and some are potentially more problematic. We can figure out how much posted wait times are being inflated by comparing submitted actual wait times from the Lines App and the posted wait time when the person timing their wait entered the line.
Over the past week, actual wait times in the Lines App averaged 67% of what was posted. That’s right around our historical average. Overall, if the posted wait time at a popular attraction was 60 minutes, you could’ve expected to wait just about 40 minutes instead.
But the worst inflation offender for the past week is back to Gran Fiesta Tour. At this one attraction, submitted actual wait times were only 33% of posted wait times in the past week. That means that if Gran Fiesta Tour had a 15 minute posted wait, you probably would have actually only waited 5 minutes instead. A third of what was posted! Remember to always check the Lines app for predicted actual waits instead of making decisions based on what is posted.

This Week’s Wait Time Rock Star
Between September 2nd and 8th, we had just over 1300 timed actual waits submitted through the Lines app. The one person who recorded the most actual waits during that time was kat002445, with 41 overall timed waits – 13 Lightning Lane waits, 24 standby waits, and 4 single rider waits. Thanks for all of that timing, kat002445! It unfortunately does not compete with the the 97 timed waits in a single week from our current timing champion, preef.
Looking Ahead: September 9 – 15
I write this article on Tuesday evenings so that you all have the very freshest of data on Wednesdays. That means the 9th will already be in the past by the time you’ve read this, so welcome to your future!
There is once again absolutely no reason to believe that the parks should see a large influx of visitors this week. I’d expect things to stay in the crowd level 2-3 range overall. There are Magic Kingdom parties on the 9th, 12th, and 14th (and 16th, although that’s technically in the next week). That means there might be some extra crowds at MK on the 13th and 15th, but things shouldn’t be too bad on the 10th or 11th, or any of the party days. Other than parties, there are no big events or other exciting events happening to draw people to the parks.
I’ll knock on all of the wood while I say that hurricane season has been oddly quiet so far this year. And as we look at the forecast for this week, summer-like afternoon storms look like they’ll be tapering off around Friday, leading to a stretch of all sun all the time. Be prepared with plenty of sunscreen and indoor plans to help with the heat!
Were you in the parks this past week? Or are you headed to Orlando soon? Let me know in the comments below!
You May Also Like...
-

If you like your parks hot, sticky, and gloriously empty, this was the week for you. The end-of-August slump showed up…
-

Welcome to June, and to the first full week of Cool Kid Summer at Walt Disney World! With new deals in…