Disney Data Dump September 3 2025
If you like your parks hot, sticky, and gloriously empty, this was the week for you. The end-of-August slump showed up in full force, with mid-week days so uncrowded that you could practically walk onto anything you wanted. And trust me, I did. Even the Labor Day weekend “crowds” barely scraped up to a crowd level 3. Pair that with some record-breaking downtime drama and you’ve got one of the more interesting weeks we’ve seen in a while. Let’s see what happened!
Observed Crowd Levels August 26 – September 1
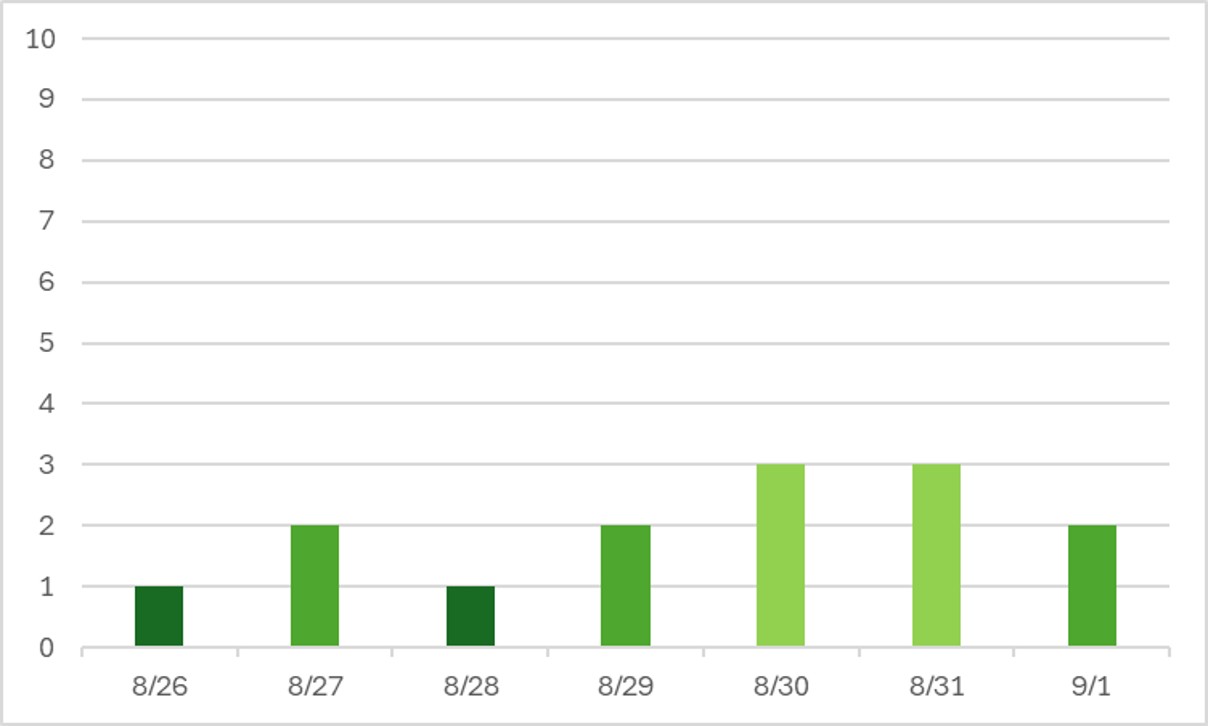
Oh check out that crazy holiday weekend, there folks. Crowd level THREE on those weekend days. But before the holiday rolled around, crowd levels were at their statistical rock bottom. I was in the parks on the 27th through the 29th, and it was glorious. Hot? Yes. But practically empty? Also yes.
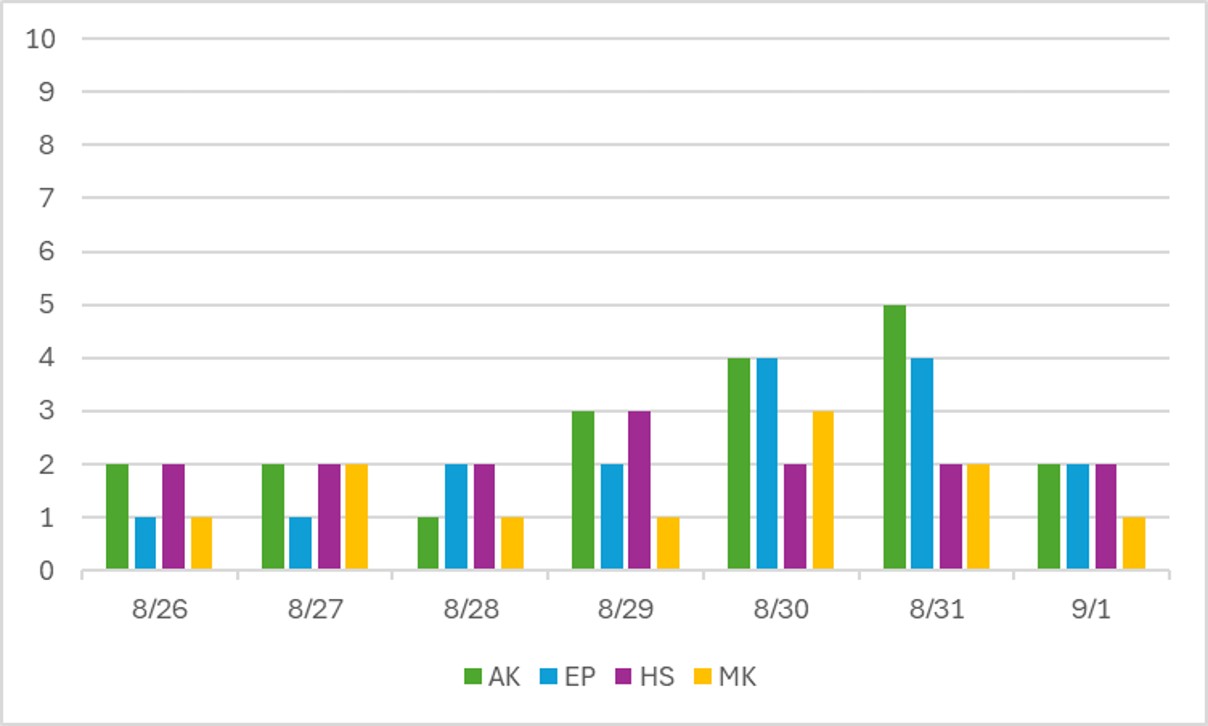
The parks are so uncrowded right now that we can’t even see Magic Kingdom party behavior. The only parties over the past 7 days were on August 26th and 29th … but Magic Kingdom was still at a crowd level one on August 28th and September 1st too.
Just how empty were things? Let me paint you two different pictures based on my personal experience:
- I flew in to Orlando on the morning of the 27th (Wednesday), checked into my room, and meandered into EPCOT around 11:30 am. I intended to ride Test Track, but it had been down all day. That should’ve meant significantly higher waits at all other attractions. But I looked in the app and saw a 40 minute posted wait at Cosmic Rewind. In the middle of the day! I hopped into standby, and including all pre-shows, I only waited 25 minutes. Incredible. I’ve never had that short of a mid-day wait for Guardians ever.
- I started the 29th in Magic Kingdom – but I missed early entry despite staying at a monorail resort (LATE night for Food & Wine opening the night before). I made it to Main Street at 7:54 am, and over to Tron by 7:57 am. To be clear, they didn’t even check that I qualified for early entry at that point – they weren’t scanning. So regular park guests could’ve gotten ahead of me. The posted wait was 20 minutes, but I walked all of the way up to and through the locker situation, and had a 1 minute and 49 second wait for Tron. I was so astounded at the total lack of line that I repeated this two more times – with a 1 minute, 24 second wait at 8:10ish, and a 3 minute wait at 8:20ish. That’s unheard-of. At 8:30, I had a 10 minute wait for Seven Dwarfs Mine Train, then walked onto Haunted Mansion and Pirates of the Caribbean.
Performance of Crowd Level Predictions
Each week, I give you a very transparent look into how the TouringPlans crowd level predictions performed. Each day at each park is one data point, so each week we have 28 different crowd level predictions to evaluate. Any time a prediction is within one or two crowd levels, things won’t really “feel” much different than what was predicted. Being off by 3 or more crowd levels is where you might feel that difference in wait times throughout the day.
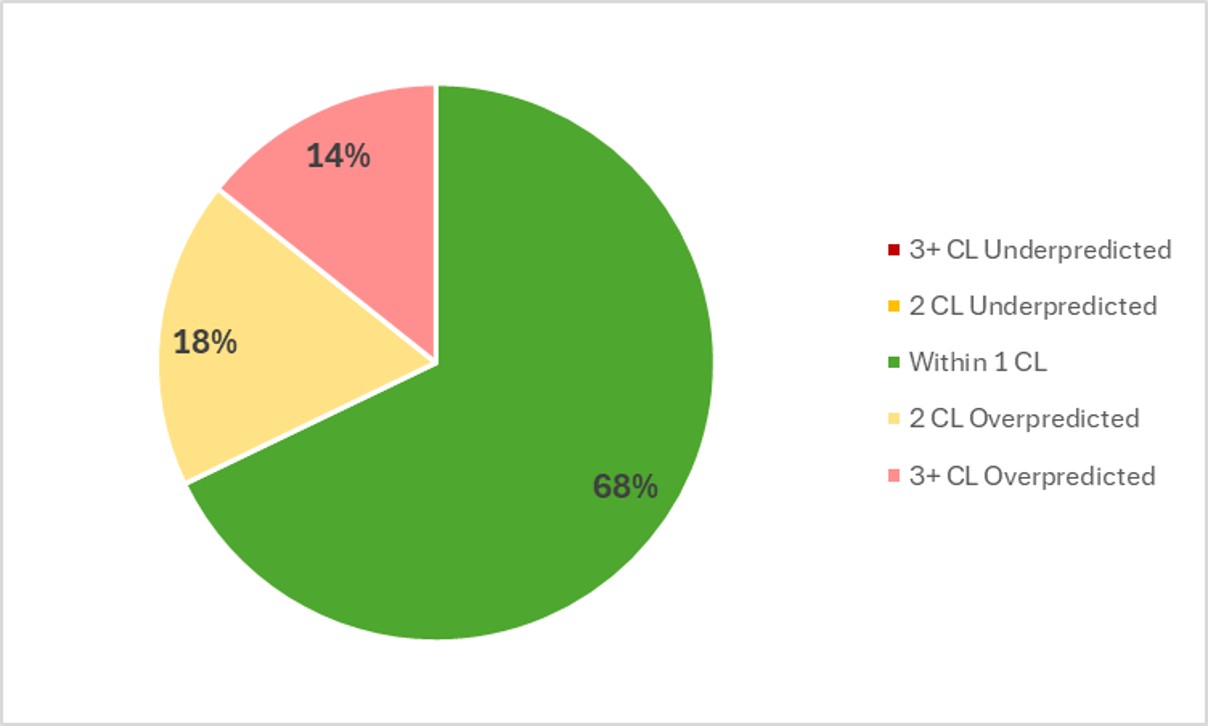
So our perfection from last week couldn’t last forever. In the past week, Touring Plans predictions were either spot-on or within 1 crowd level 68% of the time, which is still pretty good. 86% of the time Touring Plans predictions were within 2 crowd levels, so that means we get a B for our predictions in the past week. On average, the crowd level at any park any day of the week was 1.1 crowd levels below prediction. Still within the margin of error where you probably wouldn’t notice a difference anyway. The biggest miss of the week was an overprediction by 4 crowd levels, at Animal Kingdom on September 1st. The park was predicted to be a crowd level 6, but only ended up at a crowd level 2.
Attraction Downtime August 26 – September 1
If we average all of the capacity lost due to unexpected downtime over the past week, it comes out to 6.6% of attractions unexpectedly being down. That’s still above our historical average, and a lot of it was due to a single event on a single day – but more on that in a bit. Without that one event, the average downtime for the week would’ve been 4.6% instead, which is much closer to the historical average. In the past week, EPCOT was the park with the most overall downtime, averaging 8.6% of its capacity lost to downtime throughout the week.
The worst day for attraction downtime in the past week was on August 29th. On that day, 18% of all capacity at WDW was lost due to unexpected downtime. Big ow. Like, probably worst non-hurricane result we’ve ever had. That’s thanks to a power surge that took out an astounding number of attractions across every park for a significant amount of time. The worst park-day of the week was also predictably on the 29th, at Hollywood Studios. On that day, 25% of its attraction capacity was lost due to unexpected downtime. Hollywood Studios was open for 12.5 hours on the 29th, so 25% downtime is the equivalent of the entire park shutting down for over 3 hours. Which is almost what happened as attractions struggled to come back online after the the power issues.
Attraction Downtime Worst Offender
In the past week, Space Mountain was the WDW attraction with the worst overall downtime. It was unexpectedly down for 33% of the past week. A third of the entire week! That might be one of our highest “winning” percentages ever. The worst day at Space Mountain was easily on August 29th, when it was down for the entire day. But there were several other days when it was down for a third or more of the day too.
There are a couple of other attractions with significant downtime for the past week that are hiding behind that absolutely giant number for Space Mountain, including Test Track (20% downtime for the week) and Mission: Space (19% downtime for the week).
I’ve got to call out again that this is now the fourth week in a row that Test Track has had 20% or higher downtime for the week. That’s the math-equivalent of the ride taking an entire day off once every 5 days. It’s a LOT of downtime. And even when it’s not down, it’s not operating at 100% functionality. On one of my two rides on Test Track this week, the in-car audio was totally broken. I informed a cast member when I exited the vehicle, and was told, “Yes, we know.” Cool cool cool.

Rope Drop Downtime
Here are problematic offenders from the past week, with the percentage of downtime during the first hour of the day in parentheses:
- Magic Kingdom: Space Mountain (32%), Winnie the Pooh (21%), Pirates of the Caribbean (16%), Tiana’s Bayou Adventure (12%)
- EPCOT: Test Track (32%), Mission: Space (13%), Living with the Land (11%), Frozen Ever After (10%)
- Hollywood Studios: Rise of the Resistance (15%), Star Tours (11%), Slinky Dog Dash (11%), Rock’n’Roller Coaster (10%)
- Animal Kingdom: No rope drop issues!
Let’s look on the bright side and say there weren’t as many rope drop issues this week compared to the past several weeks. But we’ve still got struggles at headliners in almost every park. It’s easy to call out that if you plan on rope dropping Space Mountain, Tiana, Test Track, Rise, or Slinky, you absolutely need a backup plan or two.
Gold star to Animal Kingdom again!
Wait Times August 26 – September 1
Attractions with the Highest Average Posted Wait at Each Park
- EPCOT: Test Track, average posted wait of 72 minutes (was 79 minutes last week)
- Hollywood Studios: Rise of the Resistance, average posted wait of 71 minutes (was 60 minutes last week at Slinky Dog Dash – Slinky had an average posted wait of just 50 minutes this week)
- Magic Kingdom: TRON, average posted wait time of 51 minutes (was 59 minutes last week)
- Animal Kingdom: Flight of Passage, average posted wait time of 46 minutes (was 60 minutes last week)
We’ve got some interesting behavior here with the headliners. Generally, wait times at headliners were way down this week, even compared to an already low week last week. Rise of the Resistance is the only exception, because it had a difficult downtime week that impacted its overall posted waits.
Parks with the Highest and Lowest Average Wait
These parks likely won’t change week-to-week unless something ridiculous happens, but these data points will give us a high-level view of how wait times are trending from week to week.
- Highest: EPCOT, average park-wide posted wait of 28.1 minutes (was 33 minutes at Hollywood Studios last week)
- Lowest: Magic Kingdom, average park-wide posted wait of 17 minutes (was 20 minutes last week)
I’ll have to go back into my archives to confirm, but I’m almost certain that this is the first time we’ve ever seen EPCOT with the highest overall average posted wait of any park. To be fair, Hollywood Studios was right behind it at 28 minutes. I’m also not sure we’ve ever seen Magic Kingdom dip below 18 minutes? All of these are crazy numbers that show just how un-crowded things are in Orlando right now.
Most Inflated Posted Wait Times
We all know that Disney inflates their posted wait times on purpose. They have many reasons for doing this. Some are totally understandable, and some are potentially more problematic. We can figure out how much posted wait times are being inflated by comparing submitted actual wait times from the Lines App and the posted wait time when the person timing their wait entered the line.
Over the past week, actual wait times in the Lines App averaged 66% of what was posted. That’s just below our historical average, and means that posted wait times were even more inflated that normal. And THAT means that those super low average posted waits disguised EVEN lower actual waits. Crazy. Overall, if the posted wait time at a popular attraction was 60 minutes, you could’ve expected to wait under 40 minutes instead.
But the worst inflation offender for the past week was The Barnstormer. At this one attraction, submitted actual wait times were only 31% of posted wait times in the past week. That means that if Barnstormer had a 15 minute posted wait, you probably would have actually only waited 4.5 minutes instead. Less than a third of what was posted! Remember to always check the Lines app for predicted actual waits instead of making decisions based on what is posted.

This Week’s Wait Time Rock Star
Between August 26th and September 1st, we had just under 1400 timed actual waits submitted through the Lines app. The one person who recorded the most actual waits during that time was wozDisney, with 43 overall timed waits – 26 Lightning Lane waits and 17 standby waits. Thanks for all of that timing, wozDisney! It unfortunately does not compete with the the 97 timed waits in a single week from our current timing champion, preef.
Looking Ahead: September 2 – 8
I write this article on Tuesday evenings so that you all have the very freshest of data on Wednesdays. That means the 19th will already be in the past by the time you’ve read this, so welcome back to the future!
There is absolutely no reason to believe that the parks should see a large influx of visitors this week. I’d expect things to stay in the crowd level 2-3 range overall. Maybe with a couple of level one days if we get lucky with the weather! There are Magic Kingdom parties on the 2nd, 5th and 7th (and 9th, although that’s technically in the next week). That means there might be some extra crowds at MK on the 6th and 8th.
September is rainy season, and this week is no exception. Thankfully, that means temperatures should stay slightly more moderate. But be prepared with your wet weather plans!
A couple of you have already reached out and asked for updates about my time in the parks. I put some stories throughout the article here, but here are some of my quick hits from other parts of my trip:
- Got a haircut at the Grand Flo Spa and my hairdresser ended up being the same “Fairy Godmother” that came to our room during Covid to give my little kid her first-ever haircut. It was a sweet, unexpected reunion.
- I hated my meal at Bourbon Steak. Like, one of the worst-ever “fancy” dinners I’ve ever had on property, from price to food to service to atmosphere. Big no thank you.
- On opening day of Food & Wine, my Main St Dish friends and I took 10 hours to try 150 items (74 beverages and 76 food dishes). It was such a fun day, and I think I can say we’ve all got a very firm handle on how each of the booths compares, and what dishes are stand-outs in positive and negative ways.
- I saw Starlight! I went to the 11 pm parade on the 27th, and there were curb seats on Main Street available even just 10 minutes before showtime. I have lots of thoughts. The opening electrical music sweep made me tear up. I gasped when Gramma Tala appeared in the Moana float. It’s a great addition to Magic Kingdom nighttime entertainment. But for goodness’ sake … did the parade organizers forget that things should happen between floats until the very last minute and just stuck some random walkers in between? I want a parade, not a series of floats. K thanks.
- I was the very first official (non-preview) guest in The Beak & Barrel on the 29th! The vibe is rowdy (which is fitting with the theme), my drinks were strong, and I’ll definitely be back.
Were you in the parks this past week? Or are you headed to Orlando soon? Let me know in the comments below!
You May Also Like...
-

Welcome to June, and to the first full week of Cool Kid Summer at Walt Disney World! With new deals in…
-

For the first time ever, this week’s Data Dump comes to you from the back porch of Jambo House, with giraffes…
I would love to hear more about your disastrous meal at Bourbon steak.
Sigh … it was so wrong on so many levels.
The restaurant was just LOUD. So many hard surfaces everywhere and lots of humans.
Our service was not great, which was odd because I know most of the staff just transitioned over from Shula’s, so not that much should’ve changed. But we had forgotten things, dishes stacked on top of each other at the table, things removed before we were done with them, etc.
Food. The food. Out of 12-ish dishes, three were good enough for me to consider ordering them again (onion soup, creamed corn side, and bruleed cheesecake). The steak wasn’t cooked right. The scallops were rubbery. Most of it was just … off.
But the old-fashioned with bacon-washed bourbon – I would go back for that every day of the week.
Thanks for your honest report !
It is especially surprising since usually a new restaurant try harder…
For our upcoming trip, my husband wants to go to a steakhouse (not just for the steak, but the whole experience) – but I guess I will need to find an alternative