Today’s Wait Times: A Sign of the Apocalypse?
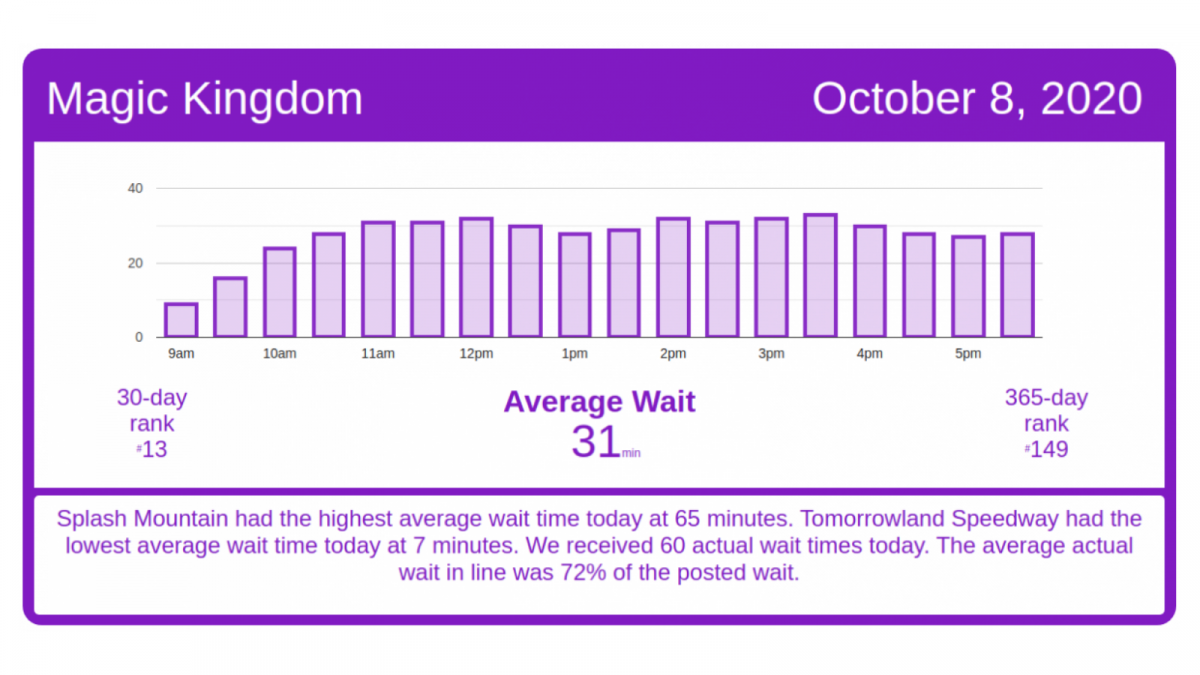
Here’s a quick look at the wait times across Walt Disney World for today, Thursday, October 8, 2020. Over at the Magic Kingdom, Splash Mountain, Space Mountain, and Astro Orbiter had their highest wait times of the week. The most surprising thing, though, was at Mickey’s PhilharMagic, which had an average wait time of 27 minutes today. Not only is that the highest average wait of the week, it looks like it’s the highest average wait we have for the month … and the past year!
The high waits for those attractions were balanced out by relatively low waits at attractions such as Tomorrowland Speedway (next-lowest waits of the week and the month), Peter Pan’s Flight (#4 for the week), The Many Adventures of Winnie the Pooh (22 minutes, #4 for the week), and Seven Dwarfs Mine Train (58 minutes, #3 for the week).
EPCOT Wait Times
The accuracy of posted wait times continues to improve over at EPCOT, with actual wait times sitting at around 70% of the posted wait times. Attractions that were relatively busy today include Gran Fiesta Tour, Spaceship Earth, and Mission: Space (both Orange and Green). In fact, Mission: Space Green’s average wait time of 20 minutes today was the highest all month, and #36 over the past year.
Disney’s Hollywood Studios Wait Times
The headline story here has to be the 27-minute average wait posted over at MuppetVision 3D. This attraction averages a posted wait of around 12 minutes, making today’s number the highest average wait of the past year. The return of live shows such as the Indiana Jones Epic Stunt Spectacular and Beauty and the Beast: Live on Stage can’t come fast enough for the Studios, especially if it wants to increase capacity for the holidays.
The good news is that waits were relatively low for Mickey and Minnie’s Runaway Railway (73 minutes, #6 for the week), Slinky Dog Dash (68 minutes, #5 for the week), Millennium Falcon: Smugglers Run (60 minutes, #5 for the week), and The Twilight Zone Tower of Terror (47 minutes, #6 for the week). Also, your actual wait in line was only around 60% of the posted wait shown at the rides.
Animal Kingdom Wait Times
Today was relatively uneventful over at Disney’s Animal Kingdom. Flight of Passage’s average wait of 57 minutes was #7 for the month, and Kali River Rapids’ average wait of 27 minutes was #4 for the past month. That was balanced out by 17-minute waits over at Kilimanjaro Safaris (#19 for the past month) and 24 minutes at Expedition Everest (#12 for the past month).


I was there on Thursday, the heat and humidity were unbearable. Water rides and indoor rides were at a premium. Would be interesting to layer weather data on top of this analysis.
Are we seeing the October crowds that have become common over the past few years, even during a pandemic?