
Our World Isn’t Back To “Normal” – But Are Wait Times?
A lot has changed at Walt Disney World in the past few months. Crowds have picked up; resorts and restaurants have reopened. And a lot of visitors from July commented that wait times easily felt like they were back to “normal” – or maybe worse than normal, since they can’t FastPass their way around the bigger waits.
I’m a numbers person, so I want to make sure things don’t just “feel” like they’re back to normal. It could be that we just got used to the nice, uncrowded parks full of walk-on options in the months following reopening. I know my family was spoiled during our September 2020 trip – we completed 26 attractions (and a table service meal and a quick service meal) in the Magic Kingdom in an 8 hour day with two toddlers in tow. We went again in January of 2021 and things felt so much more crowded. I went back and pulled my wait times from that trip … and they averaged 11.5 minutes for all of our park days combined. Definitely not an average I’d complain about.
So today let’s do the same sort of analysis overall and not just with my wait times. Yes, the parks look and feel more crowded. But are the wait times on par with what we were seeing before the parks closed last spring?
Explain the Math!
This week is all about tracking wait times over the past couple of years. I want to get a good view of averages pre-pandemic, as well as trends after reopening. There are only three kinds of wait times that I care about for comparing apples to apples:
- Disney’s Posted Wait Times – these are the numbers you’ll see at the entrance to any attraction, or in the MDE app
- User-Submitted Actual Standby Wait Times – these are the times submitted by users in the Lines app, and they reflect the amount of time actually spent waiting in the “regular” line for an attraction. Post-pandemic, the vast majority of these are standby times. But if there are any other types submitted (single rider, virtual line), we’re filtering them out for this analysis.
- User-Submitted Actual FastPass+ Wait Times – these are the times submitted by users in the Lines app prior to the pandemic that reflect the amount of time they actually spent waiting in the FastPass+ line for an attraction. Ah, the good ol’ days.
I went and pulled all of these data points from January 1st, 2019 through July 31st, 2021 and aggregated the average for each park for each month. This won’t give us incredibly detailed data since we’re not digging down to a ride-by-ride analysis. But it’s enough to look at general trends.
Magic Kingdom Wait Times
Let’s start with the biggie. If you haven’t been to Magic Kingdom recently, you’ve probably at least seen the pictures. Especially at rope drop, there are WALLS of people. Lots of humans. And a large number of people have commented that wait times also feel like they’re back to “normal”. Let’s compare wait times from the year before the pandemic to see if that’s true.

- If you went to Walt Disney World in July or August of 2020, lucky you – you averaged FastPass+ wait times for every attraction.
- After peaking in October, actual wait times started decreasing over a period of 7 months. I think this is a good example of how Disney increased operational capacity before increasing attendance capacity. Any increase in crowds was more than accommodated by more being open or ride capacity being increased.
- That steady decrease reversed course in May of 2021. Since then, actual wait times have been on the rise. There doesn’t seem to be much more operational efficiency to be gained to absorb all of the people.
- Other than September, average standby wait times at Magic Kingdom tended to hover between 15 and 25 minutes each month. (This is a good visual for why I always visit in September – but shhhhh, don’t give away my secret). So in this case, yes, standby times are close to their pre-pandemic average. But they have been ever since October – nothing special has happened in the past month or two.
EPCOT
EPCOT is increasingly a tale of two parks – not pre-pandemic and post-reopening necessarily, but rather festival and non-festival. Although by my most recent calculations, there are only about 30 days this calendar year that aren’t covered by a festival. So what do wait times look like at the Experimental Prototype Festival of Tomorrow?
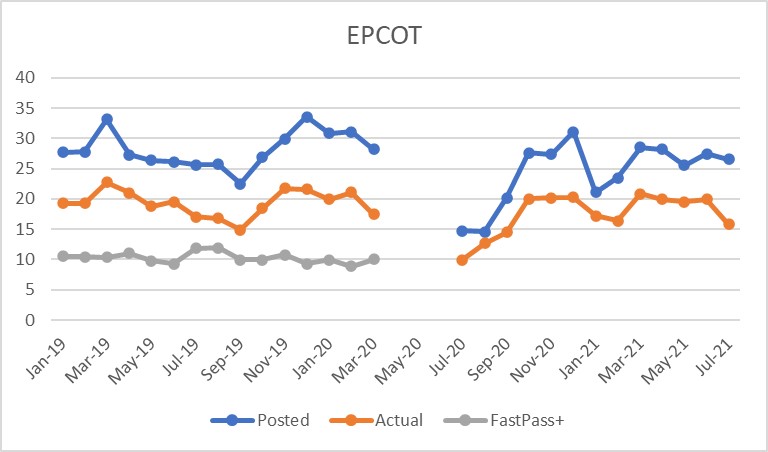
- EPCOT sees different crowd patterns than the Magic Kingdom. Wait times average slightly lower – and sometimes average standby waits weren’t that different from average FastPass+ waits, especially in the summer of 2019.
- EPCOT didn’t see the steady decline in wait times throughout late 2020 and early 2021 that we saw in Magic Kingdom. Things got back to their “peak” (and close to normal from 2019) by October 2020 and stayed there for a few months before slacking off in January and February. But they roared right back from March through June.
- July 2021 seems like an interesting anomaly – wait times saw a significant drop compared to the past several months. In fact, out of the five Saturdays in July, there were two days that were crowd level 3, two days that were crowd level 2, and one day that was crowd level 1. Remarkable! Especially considering that three of those Saturdays were during Food & Wine, and one was during Flower & Garden.
Hollywood Studios
Hollywood Studios is the park where wait times seem to most heavily depend on attraction downtime. It’s also the park that had one of its major attractions debut right before the pandemic shut-down. What did that do to our trends and comparison?
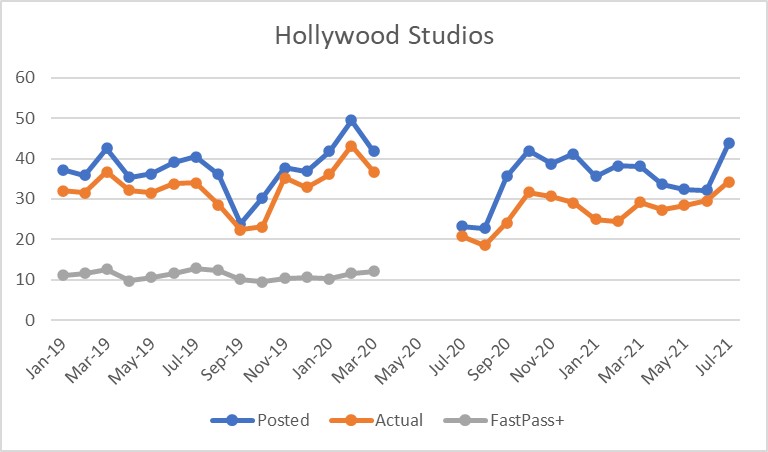
- Pre-pandemic, Hollywood Studios was different than Magic Kingdom and EPCOT in three ways: the average wait time there was higher, the difference between the standby and FastPass wait times was larger, and the inflation of the posted time was smaller.
- Hollywood Studios is also the park that hasn’t yet quite reached its pre-pandemic normal standby waits. Which is definitely fortunate since FastPass+ made such a difference there.
- Wait times have been on a pretty steady upward trend since April 2021 at Hollywood Studios – until more shows can open to absorb some of the crowds, it will be difficult to maintain stable standby waits.
Animal Kingdom
Animal Kingdom has several attractions (like walking trails) that don’t require any wait and help with absorbing crowds. But it also has the one attraction with the highest average standby wait of any attraction at WDW – thanks, Flight of Passage. How does that all average out in times waits?

- Since I’ve been doing so much analysis of inflated posted wait times, something that immediately stands out to me is that early on in reopening, Disney was actually underestimating waits at Animal Kingdom. They eventually went back to posting higher times, and then went much further that direction in July 2021.
- Pre-pandemic, average waits rarely drifted below 30 minutes, and since reopening they haven’t yet hit that number in any month.
- Animal Kingdom is the other park (along with Hollywood Studios) where FastPass times were most different from standby times, but because standby times haven’t returned to their pre-pandemic highs, the lack of FastPass+ isn’t having as much of an impact.
What Does This Mean For You?
- As of the summer of 2021, it appears that each park has begun to reach the limits of its operational efficiency gains, and attendance gains are starting to push wait times up. This may change if/when shows or other attractions are able to open.
- The two parks where FastPass+ wait times were the most different than standby wait times haven’t yet reached their “normal” standby wait times post-reopening. I’m not attempting to predict the future here, so that could change in the coming months. But for now, standby waits at Animal Kingdom and Hollywood Studios are still lower than their pre-pandemic levels.
- Posted wait times are still generally much higher than actual wait times, so the key piece of advice here is to be a smart visitor and know what to really expect before making a decision to jump in line or bail out.
Have you visited WDW recently and experienced wait times that you weren’t expecting? Are you surprised by any of the trends or comparisons? Let us know in the comments!

You May Also Like...
-

Last week I saw a nice data visualization of how COVID-19 compares to other causes of death in the United States.…
-

Here's a quick look at the wait times across Walt Disney World for today, Thursday, October 8, 2020. Over at the…
-

Our Lines app (iOS / Android) now supports optimizing touring plans and timing waits in line when guests are admitted to…
-

The weird winter chill has come and gone, leaving pleasant temperatures in Orlando again. Posted wait times at all four Walt…