2025 Disney World Crowd Calendar Retrospective
If you were paying attention last week, you know that I celebrated the new year by comparing Touring Plans predictions to Disney’s ticket costs “prediction” about crowd levels. This week I’m digging a little deeper and trying to determine how crowd calendar predictions performed compared to previous years and at the park level. All of this will help the stats team to make even better predictions in the future, and to help you make better plans throughout the 2026.
Explain the Math!
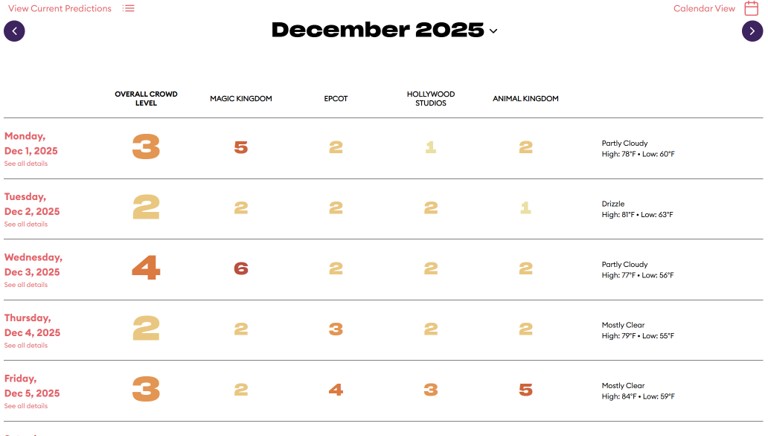
If you take a peek at the Walt Disney World crowd calendar, you’ll notice that each park-day is given a predicted crowd level on a scale from 1 to 10. Crowd level 1 days are the least crowded of the year, and crowd level 10 days are wall-to-wall humans everywhere you look. These are Touring Plans’ predicted crowd levels.
Then, after a park day happens, we can measure all of the wait times at every attraction in every park and determine what the actual crowd level was for that day. By subtracting the difference between the actual and the predicted crowd level, we can get an easy measure of how accurate those predictions were.
In this case, I’m going to subtract the predicted crowd level from the actual crowd level. For example, if Touring Plans predicted a crowd level 10 at Magic Kingdom, but the day ends up being a crowd level 8, the difference is -2. The crowds were overpredicted by 2. But if Touring Plans predicts a crowd level 4 at EPCOT and the day ends up being a crowd level 7, the difference is 3. The crowds were underpredicted by 3.
In general, you’re not going to feel any difference in your park day if predictions are off by just one crowd level. Within 1 crowd level is the goal. Really anything within 2 crowd levels I’ll call “fine”. Missing by 3 or more crowd levels is a big miss, and that’s the type of thing that should be avoided.
2025 Performance Compared to Previous Years
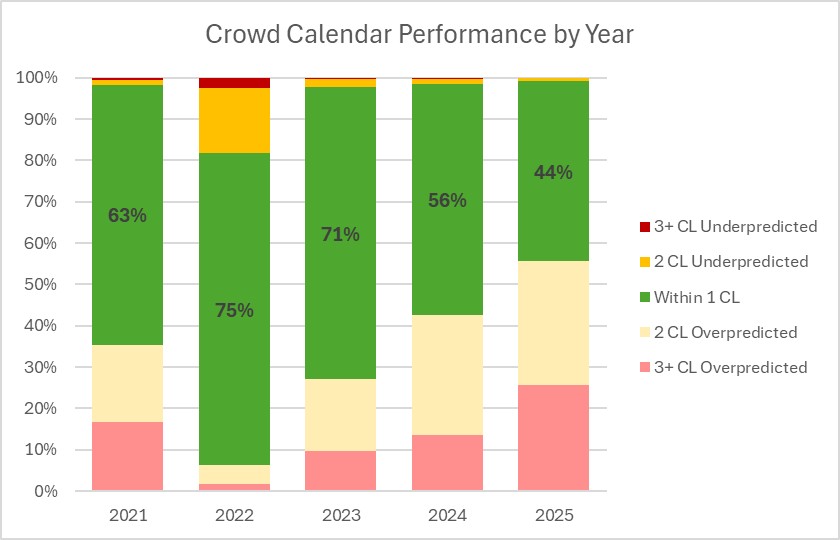
In an ideal world, that green bar would be 100% every year. Touring Plans would have perfect predictions, you’d love and believe them 100% of the time, and we’d all be best friends. In reality, things happen. The world is an unpredictable place. More to the point, Walt Disney World can change their operational decisions on a whim. Capacities, staffing, hours, etc. are all under their control. And the stats team tries to not change the predicted crowd levels constantly so that people planning have some stability. These operational changes have shifted into hyper-drive post pandemic, along with the unpredictability of human behavior. So there’s a lot working against stable predictions. Still, everyone wants that green bar in the graph to be as big as possible. And we especially want the red and pink bars (missed by 3 or more crowd levels) to be as small as possible.
What about the other bars? Well, in general, people are happier if the parks are less crowded than they expect (aka, Touring Plans overpredicted). And they’re more upset if the parks are more crowded than they expect (aka, Touring Plans underpredicted). But Touring Plans is full of math nerds, and math nerds want our distribution to be centered (aka, just as many underpredictions as overpredictions). Still, during a retrospective, I’m going to recognize and acknowledge that all of you are going to be less angry if those underpredictions are kept to a minimum.
2025 wasn’t great. In most ways, it was the worst prediction year since the pandemic. In 2025, Touring Plans predictions were within 1 crowd level just 44% of the time. The next-worst year was 2024, when it was 56%. And just like 2024, predictions this year were wildly skewed toward overpredictions. This is great news for those of you in the parks this year. They were much, much less crowded than they could have been. But it’s bad for accuracy and predictability. In fact, if you had subtracted 1.7 crowd levels from predictions for almost the entire year, you would’ve been more accurate. It was only 1.2 crowd levels of average overprediction in 2024. More than half of the time, crowd levels were 2 or 3 levels below what was predicted.
2025 Performance Compared Across Parks
In order to understand what went right (or wrong) in 2025, we need a little more information. In this article we’ll go down one level and look at how predictions performed at each park rather than the resort as a whole.
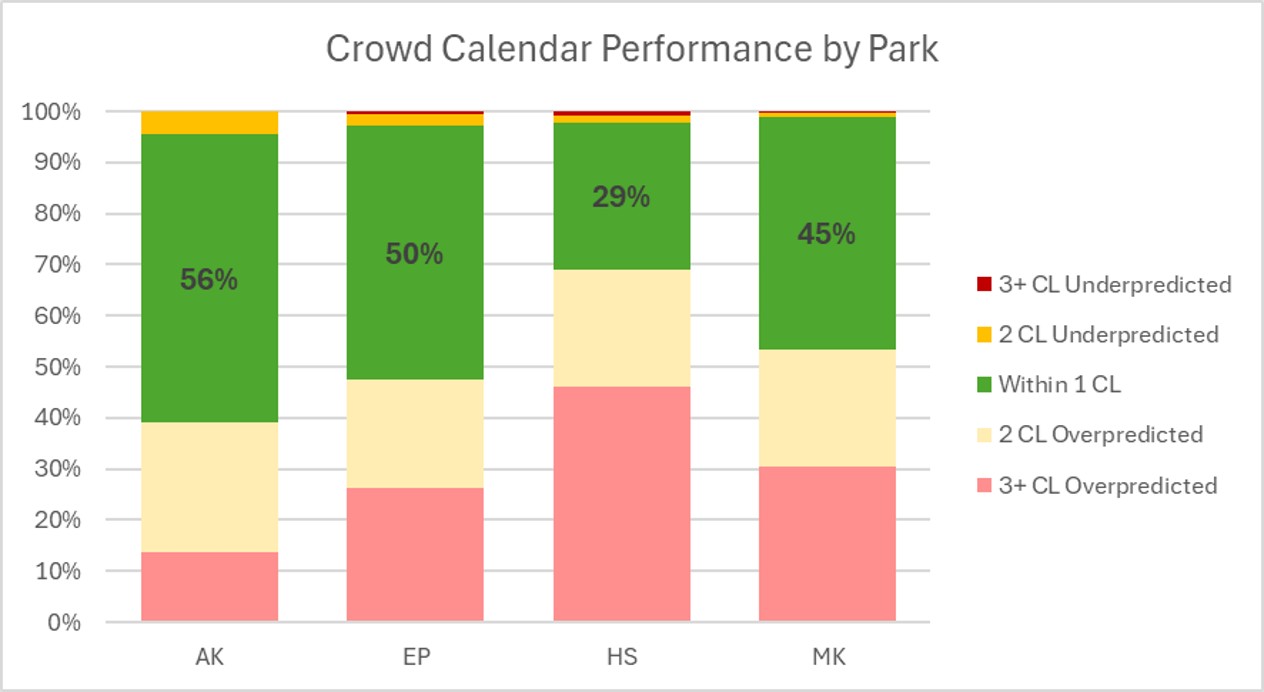
We can quickly see that Animal Kingdom is the park that the predictions got “most right” in 2025. Touring Plans predictions were within 1 crowd level 56% of the time. This makes sense. In a year where every park was much less crowded than expected most of the time, Animal Kingdom had a bunch of lost capacity as it prepares for Tropical Americas, and having fewer attractions skewed the wait times up at what remained open. And Hollywood Studios is where there was the most trouble in 2025 – predictions were only within 1 crowd level 29% of the time. Less than a third of the time.
I usually call out which parks have the most- or least-skewed predictions, but in 2025, everything is skewed to over-predictions everywhere. Really the only differences in skewed-ness are due to overall accuracy. Animal Kingdom is the least-skewed precisely because it had the most within-1-crowd-level predictions.
Calendar Retrospective of Crowd Calendars
What better way to review calendars than with more calendars?!
I’ll start here with the park where predictions had the highest accuracy, provide my commentary, and then move to the next park. We can discuss park-specific issues, as well as trends that I notice affecting multiple parks.
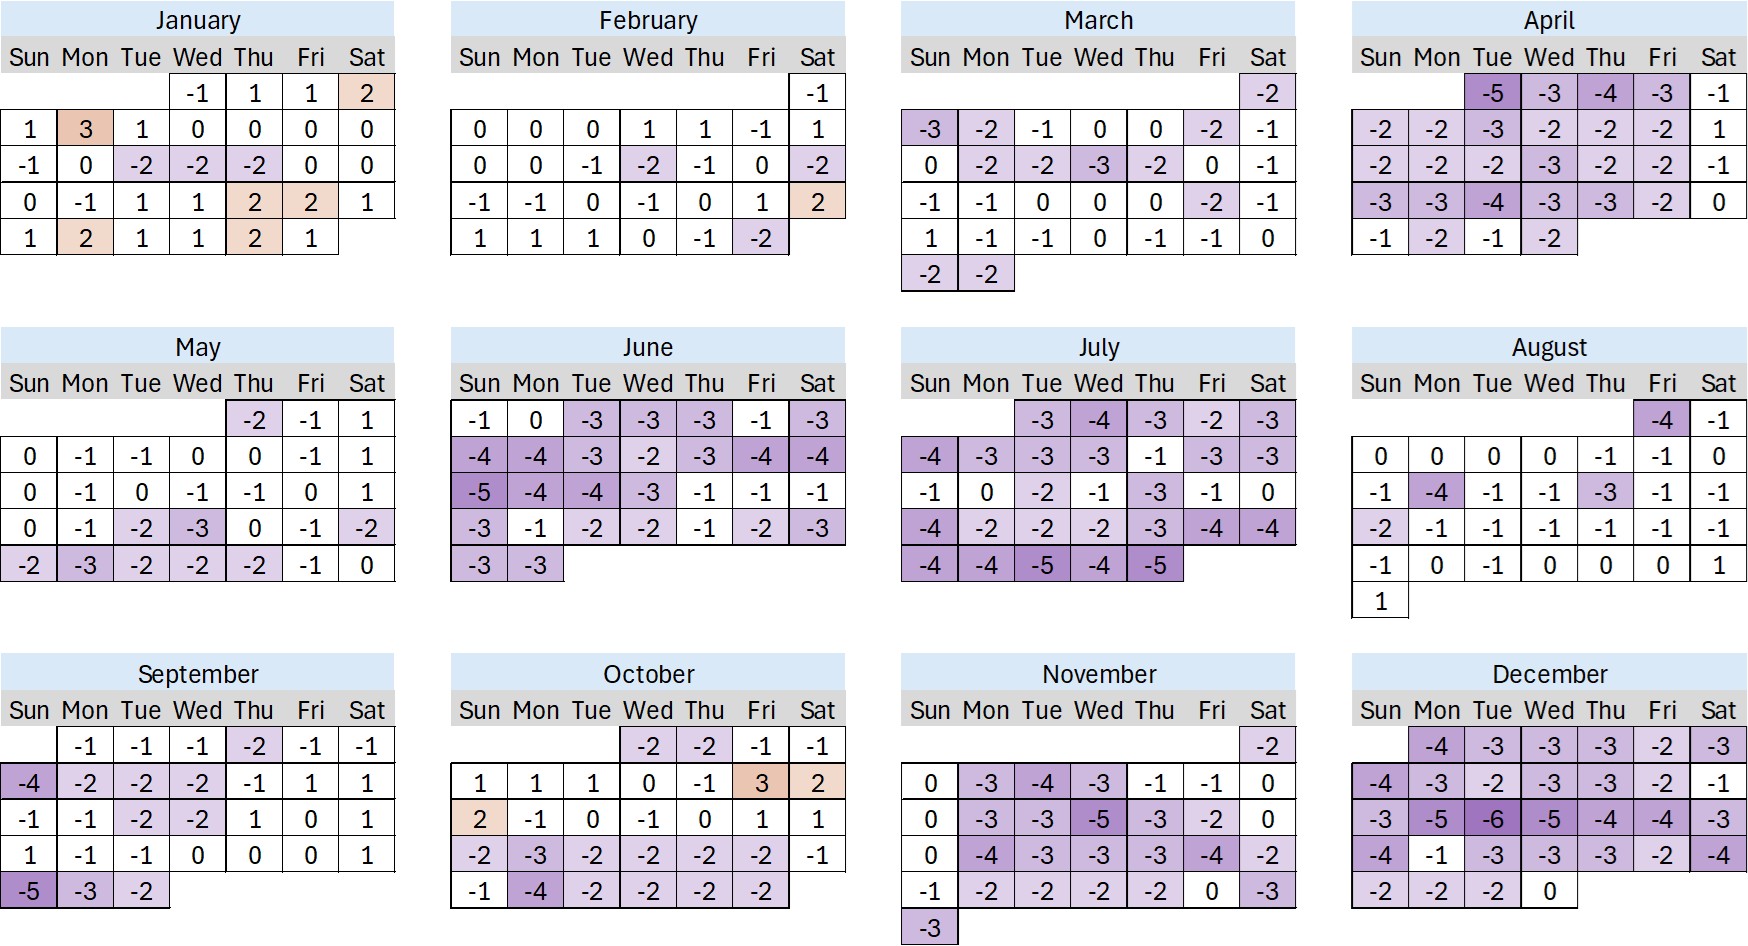
When Touring Plans overpredicted crowds, those days turn purple. And when predictions make people angry by underpredicting crowds, those days turn orange. The darker orange, the angrier the people.
Animal Kingdom
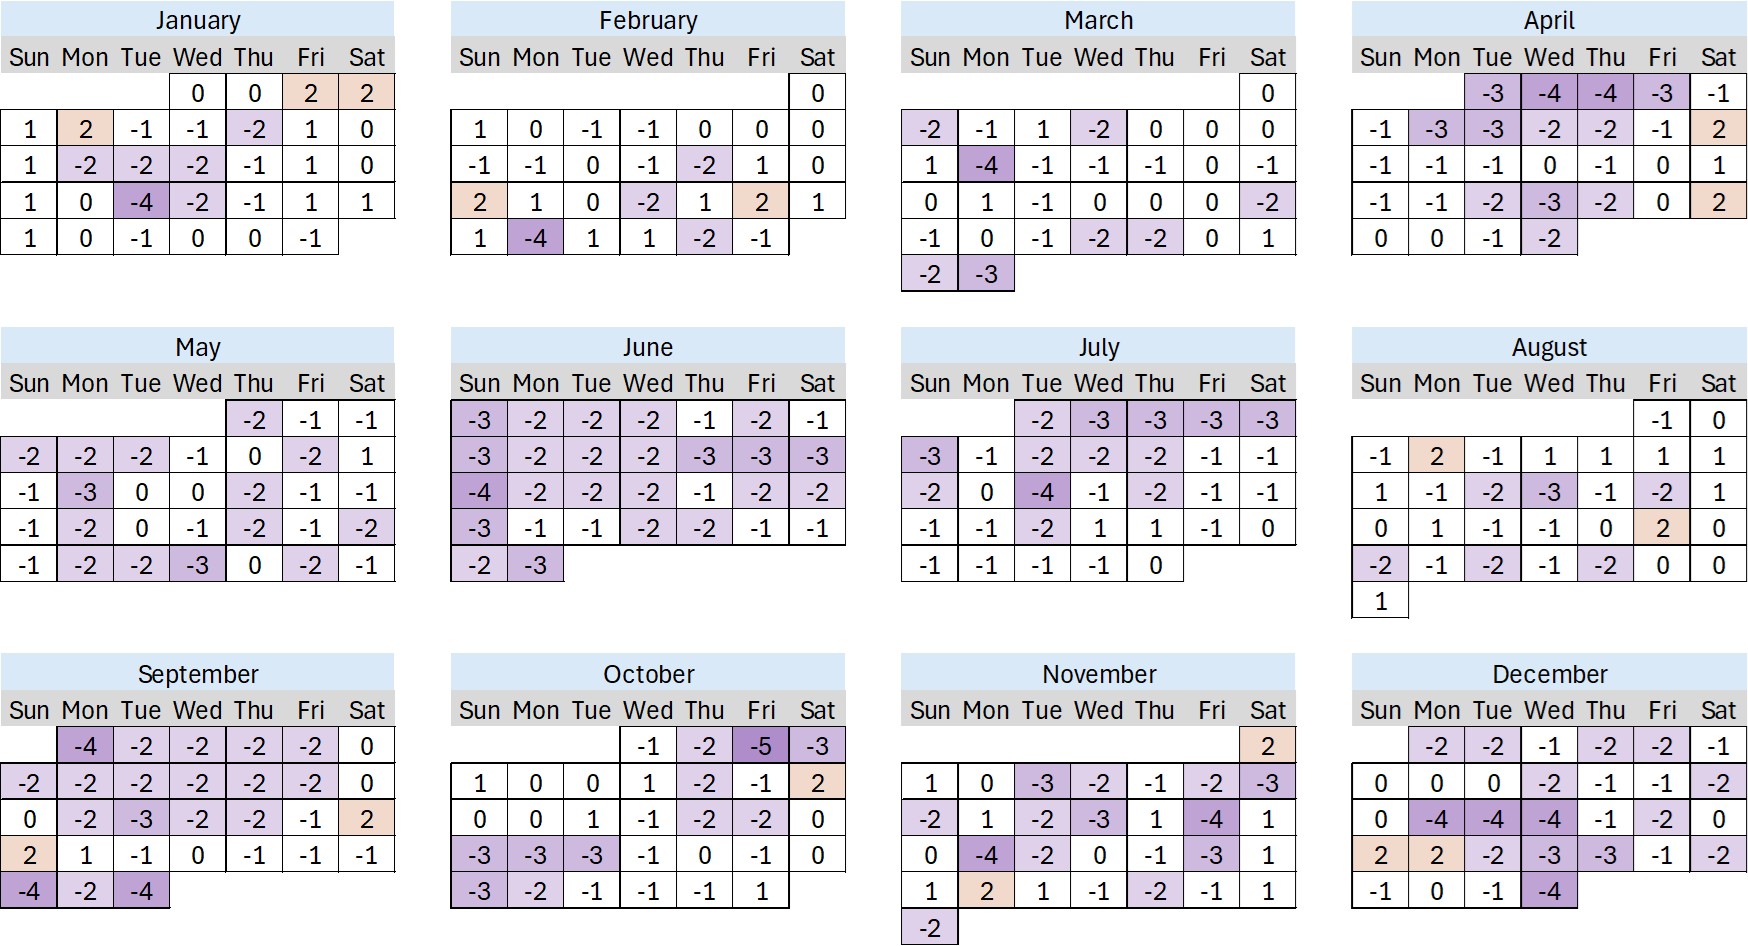
Animal Kingdom has the most white-colored boxes of any WDW park in 2025. And actually, January through March was all pretty normal. A balanced mixed of a few orange boxes, a few more purple boxes, and a lot of white boxes. Then in April, things started getting different. April Saturdays stayed somewhat crowded compared to what was expected (mostly thanks to locals enjoying nice weather on the weekends), but otherwise April through July was all very uncrowded.
In the second half of the year, we started to get some orange boxes mixed in again … but only rarely. It’s still generally a sea of purple boxes, especially on weekdays.
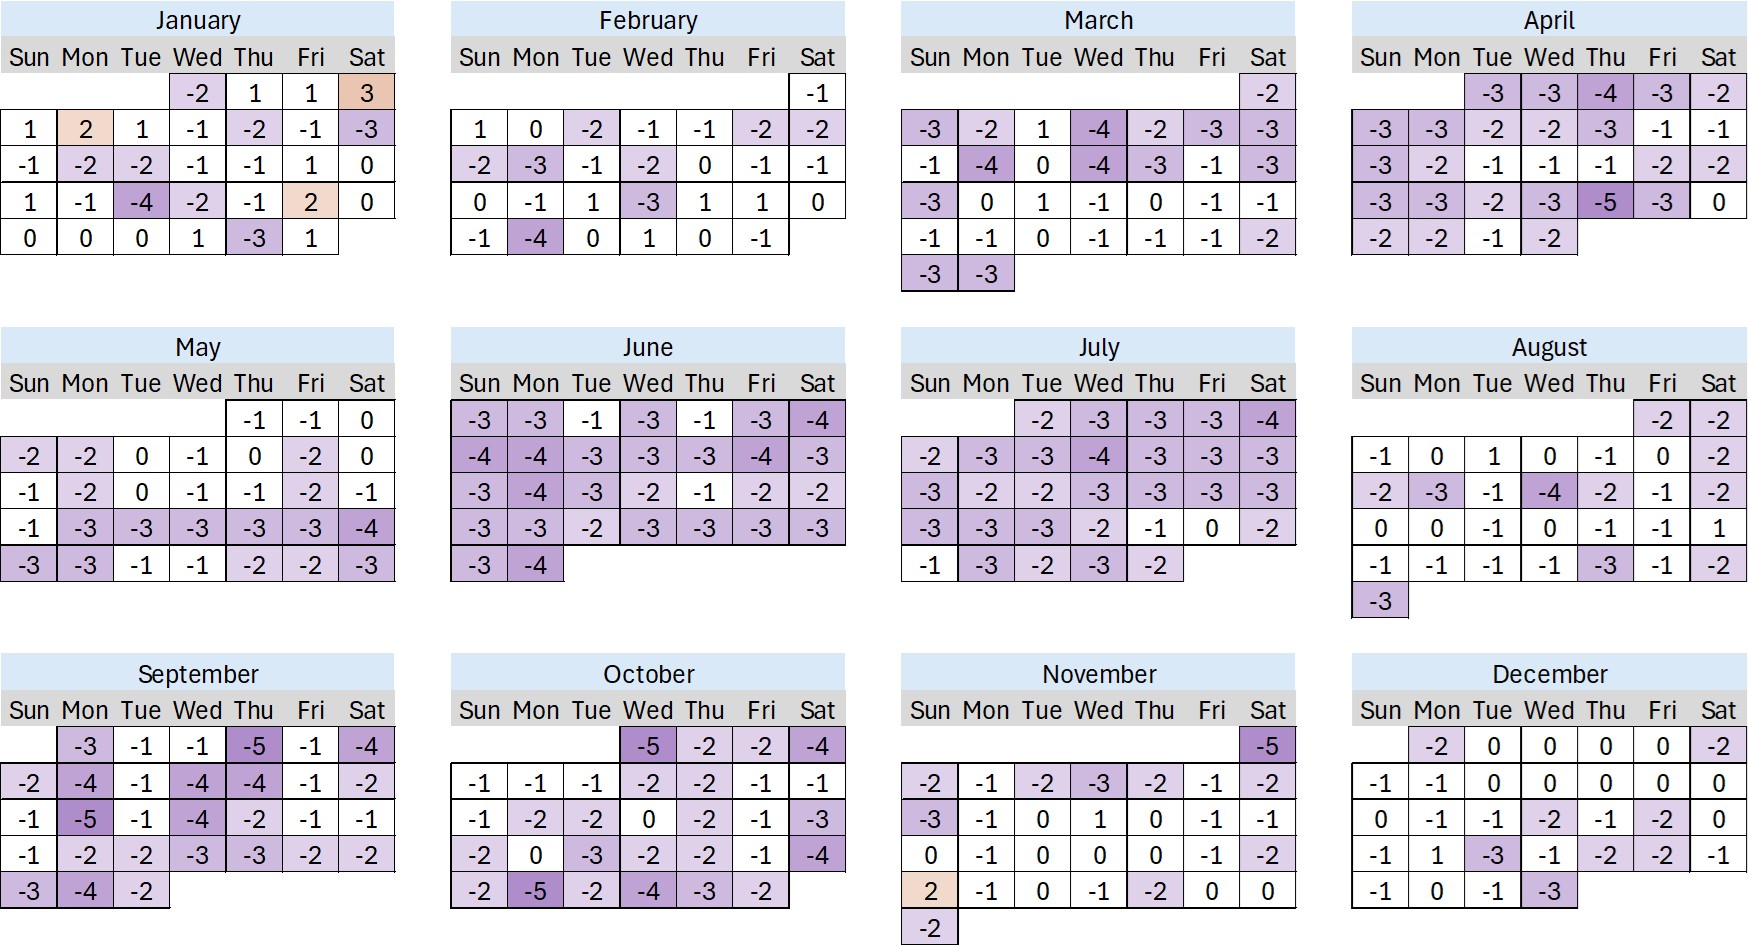
EPCOT
At EPCOT, we see similar trends, but with some park-specific tweaks. January and February were once again pretty popular at EPCOT – there’s more orange and white there than we even saw at Animal Kingdom. This is thanks to the enduring popularity of Festival of the Arts. It’s a good one, and locals especially know it. In March, things started to calm down. And then April was empty! Blocks of purple other than on Saturdays.
Similarly, May and August were about as predicted, with a lot of white boxes. But June and July were very uncrowded, especially on weekends and surrounding holidays. Columbus Day weekend was a rare onslaught of humans into EPCOT, with a series of three orange boxes in a row. And other October and November weekends stayed as crowded as expected. But everything else was a wash – weekdays at EPCOT were glorious from the second half of October through all of December (other than New Years Eve).
One important note: a late July crowd calendar update looked at all of the summer overpredictions and shifted predictions downward for the rest of the year by an average of 1.4 crowd levels. Those predictions worked for August and some of September, but crowds dropped even further in November and December, outpacing the adjustments.
Magic Kingdom
At Magic Kingdom, predictions were only within 1 crowd level 45% of the time. So less than half of our boxes are white now.
Let’s not get repetitive. April, June, and July are clearly the problem months here. For Disney, not for guests. Big walls of purple that mean parks that were less crowded than they were predicted to be. In September and October, crowds were low enough that non-party-day spikes didn’t show up as much as we’ve seen in previous years. They were still more crowded than party days, but not AS crowded as other years. In November and December, party day behavior is just about what we would expect. That explains why more white starts to show up in those months again.
An important note is that the debut of Starlight Parade in late July has made evenings at Magic Kingdom incredibly popular. Especially on non-party days from August through the end of the year, guests flood into Magic Kingdom around dinner time to watch the parade and Happily Ever After. But this isn’t reflected in crowd levels because those numbers are calculated based on wait times from 11 am to 5 pm. Late surges in wait times, or parade routes filling up hours before the parade aren’t captured well. Unexpectedly low crowds all year are all fine and good, but they don’t mean that you’ll be able to waltz up to a parade spot easily.
Hollywood Studios
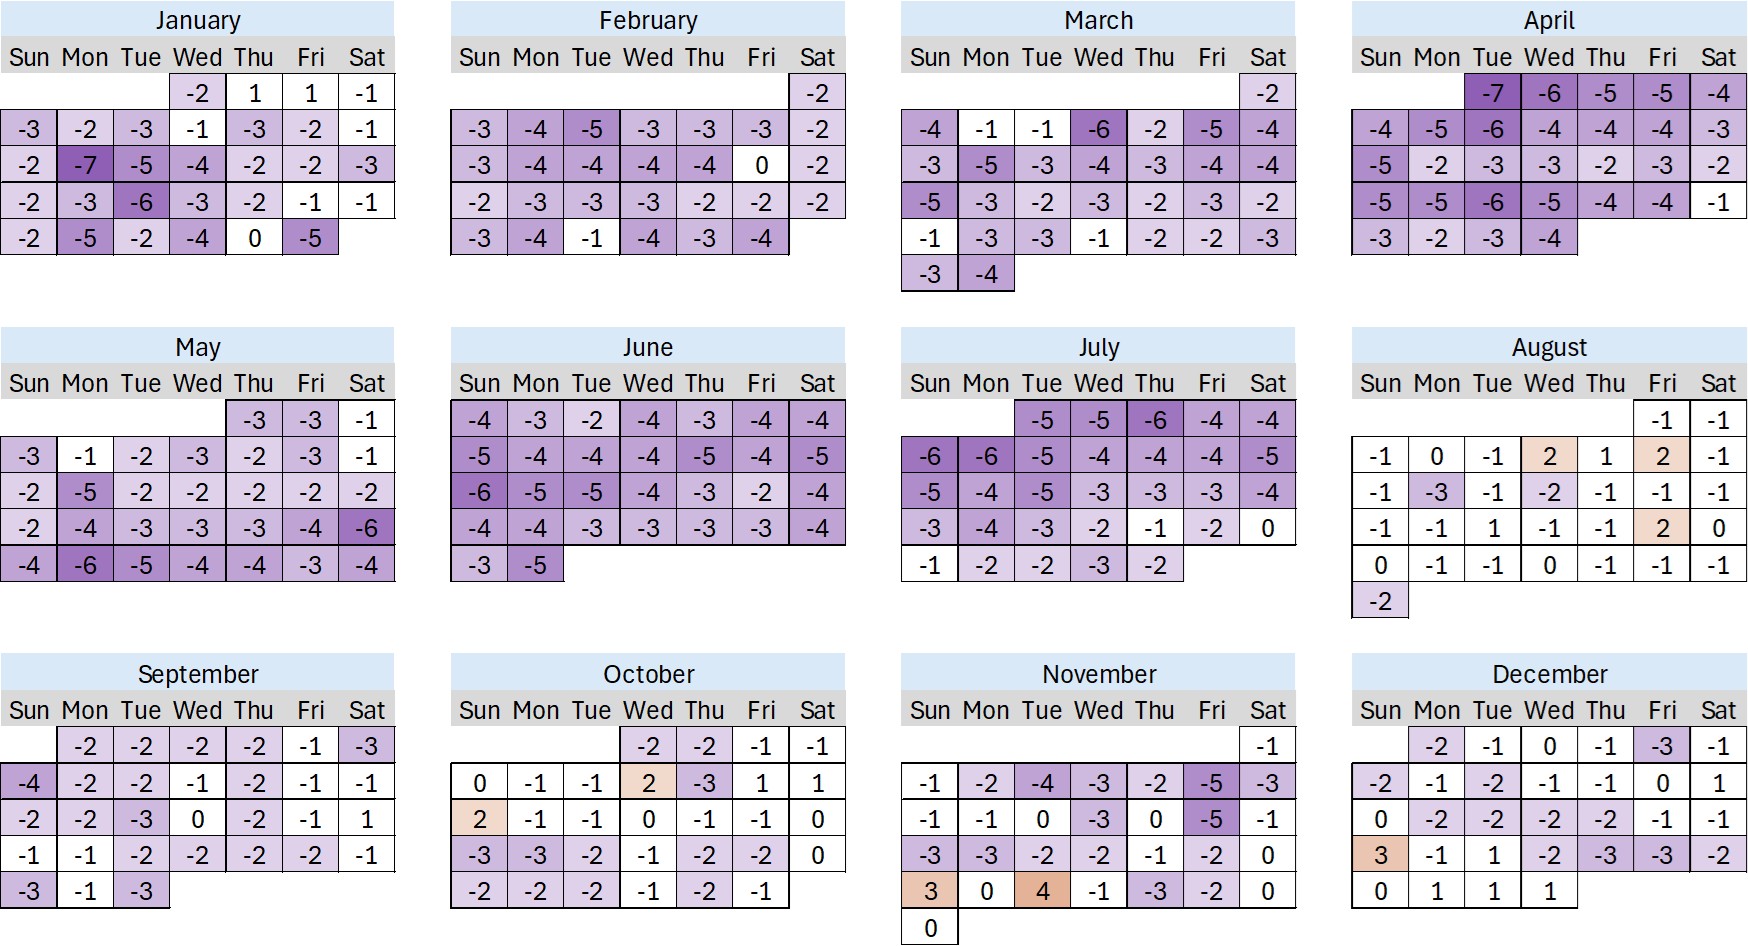
Ah, Hollywood Studios. Only less than a third of the boxes on this calendar are colored white. Unlike the other three parks, January through March was not well-predicted at Hollywood Studios. The wall of purple started at the very beginning of the year and lasted all the way through July. A late July crowd calendar update tried to compensate for this behavior, and it worked … for about a month. Then crowds kept dropping even further than the update accounted for.
A lot of the lower wait times at Hollywood Studios can be explained by increased reliability at the park. It’s still where you’ll find the most downtime issues at Walt Disney World, but Rise of the Resistance isn’t seeing multiple hours of downtime anymore, and Rock’n’Roller Coaster and Slinky Dog Dash have been performing better this year too. When everything is running smoothly, there has been plenty of capacity for everyone visiting the park.
A Note About 2025
We explained all of the overpredictions in 2024 as a result of the DAS revamp that led to perceivably shorter standby waits since Lightning Lanes weren’t as full, even with the same attendance in the parks. In 2025, Disney continued to tinker with the math by rebalancing how many Lightning Lane guests were admitted onto a ride compared to Standby guests. The results were very favorable to Standby guests, shortening those waits further. All of those operational changes mean shorter standby waits even on equal attendance days.
But the bigger story here is lower travel. International travel is way down, which especially impacts summer travel dates. And Cool Kid Summer was actually a pretty great event, but it didn’t draw as many families as Disney probably hoped.
So if 2024 was operational changes that made “crowds” (actually wait times) lower, in 2025 it was lower travel and legitimately fewer guests.
Did any of the results of this retrospective surprise you? Were you at Walt Disney World for any of the significant overpredictions or underpredictions? Let me know in the comments!
You May Also Like...
-

Over the past 30 days, crowd levels at Magic Kingdom and Animal Kingdom have been slightly lower than historical averages. Therefore,…
-

We’re almost to the end of January, and that means that we need to wrap up all of our crowd calendar…
I would like to hear about the next steps : are you going to change the model ? Predictions should move ?
I understand the « better be happy than disappointed » ; however it is not what I expect from a crowd calendar. I want insight within reasonable doubt after understanding the methodology.
I would go as far as saying that if you have such a constraint of not choosing when you go, you do not actually need a calendar.
I think it is a problem for people actively discarding some dates based solely on a calendar, and or buying lighting lanes according to inaccurate projections alone.
The good news is touring plan is very open on methodology and documents every week the results – which is a good « recent » insight and provides balance ; not sure how many people actually go beyond reading the crowd number though.
Hi Anne,
I agree – this isn’t the standard we’ve set. My next project for 2026 is to update the calendar methodology. We’ve spent some time recently determining some fundamental things like “How many crowd levels are there, really?” as a start. We’ve been working with stats professors around the country to look at different approaches for this. (One of the nice side-effects in us sharing our data is that people are willing to help when we have questions!)
I think we can make the calendar better. We re-did our attraction wait-time forecasting process in 2025 and that showed significant improvements.
When we start working on this, we’ll post questions and updates to our forum (forum.touringplans.com). That’s a good place to look for updates.
Thanks for your comment!
Thank you Len ! I do appreciate the honesty and work in progress. A true test and learn approach !
Will the weekly ‘data dump’ be coming back?
It sure will! But I’m finishing up the 2027 Unofficial Guide, doing these retrospectives, plus my full-time job and … y’know … raising two kids! So, no time for more than one article per week. Once retros wrap up, data dump will be back.
Just wanted to write in and say I appreciate the work you all do. An over-prediction is so much better than under-prediction in my book because it helps us folks who can’t plan around the time where it’s slowest, only the time when we can go. So when we come to the park and it turns out more quiet and easy to navigate than expected, it turns a good day to a great one. Again thank you for your dedication and work you do to help everyone have a once in a lifetime vacation.