Disney Data Dump December 3 2025
It’s officially that fun little in-between season at Walt Disney World! The brief window after Thanksgiving crowds head home, but before winter break swoops in and fills every queue. Crowds dropped fast (just like we predicted), but not without a few dramatic blips along the way – especially at one park that went from bursting at the seams to practically empty in just a handful of days. Add in lots of parties at Magic Kingdom and EPCOT’s festival kickoff, and it was a surprisingly interesting week for an otherwise calm stretch on the calendar.
Observed Crowd Levels November 25 – December 1
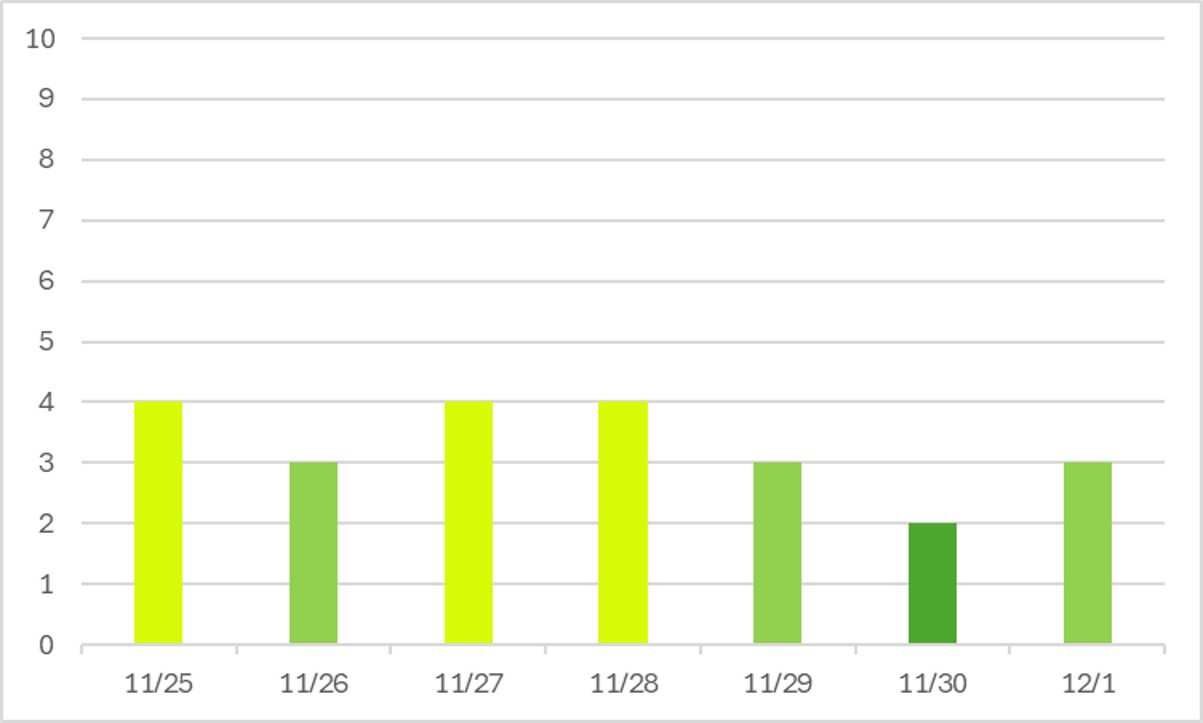
Well, those pre-Thanksgiving crowds disappeared just as quickly as I said they would last week. Thanksgiving was on the 27th, and already by Tuesday, families who had taken a long weekend were already headed back home. There is absolutely no reason that we should see any crowds above the 2-3 range for the next couple of weeks – unless locals show up in force over the weekends or giant breakdowns boost wait times. But these overall WDW numbers are hiding some interesting stories …
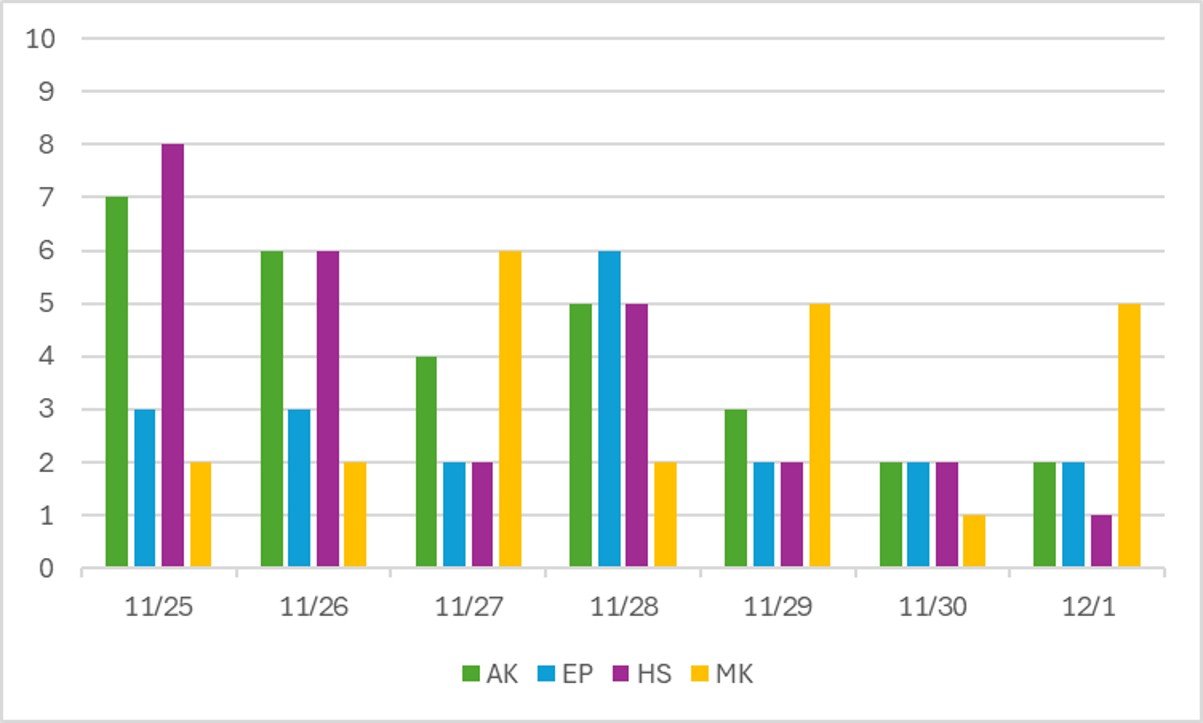
Let’s look at those purple bars first. Hollywood Studios started the week by almost blowing up the chart with a crowd level 8 on the 25th, before gradually calming back down, all the way to a crowd level 1 on the 1st. Why did that happen? First, the 24th was a party day at Hollywood Studios, so lots of folks who wanted to visit that day may have delayed to the 25th instead. Then the 25th was a Magic Kingdom party day AND Diet EPCOT season. Why does that combo matter? On Magic Kingdom party days, all three other parks tend to absorb the crowds. But when EPCOT doesn’t have a festival, its crowd levels stay really low. So it looks like everyone went to Animal Kingdom or Hollywood Studios instead. The same behavior happened on the 26th, but lots of families were already headed home by that day, so the result wasn’t quite as wild.
It’s once again very easy to see our Magic Kingdom party day behavior. Parties happened on the 25th, 26th, 28th and 30th. The Jollywood parties are harder to pick out. They happened on the 29th and 1st, but crowds were already so low throughout WDW that we didn’t see any sort of non-party spike on the 30th.
EPCOT got a big boost on the 28th, when Festival of the Holidays opened. But it also immediately calmed back down over the weekend and into the new week.
Performance of Crowd Level Predictions
Each week, I give you a very transparent look into how the TouringPlans crowd level predictions performed. Each day at each park is one data point, so each week we have 28 different crowd level predictions to evaluate. Any time a prediction is within one or two crowd levels, things won’t really “feel” much different than what was predicted. Being off by 3 or more crowd levels is where you might feel that difference in wait times throughout the day.
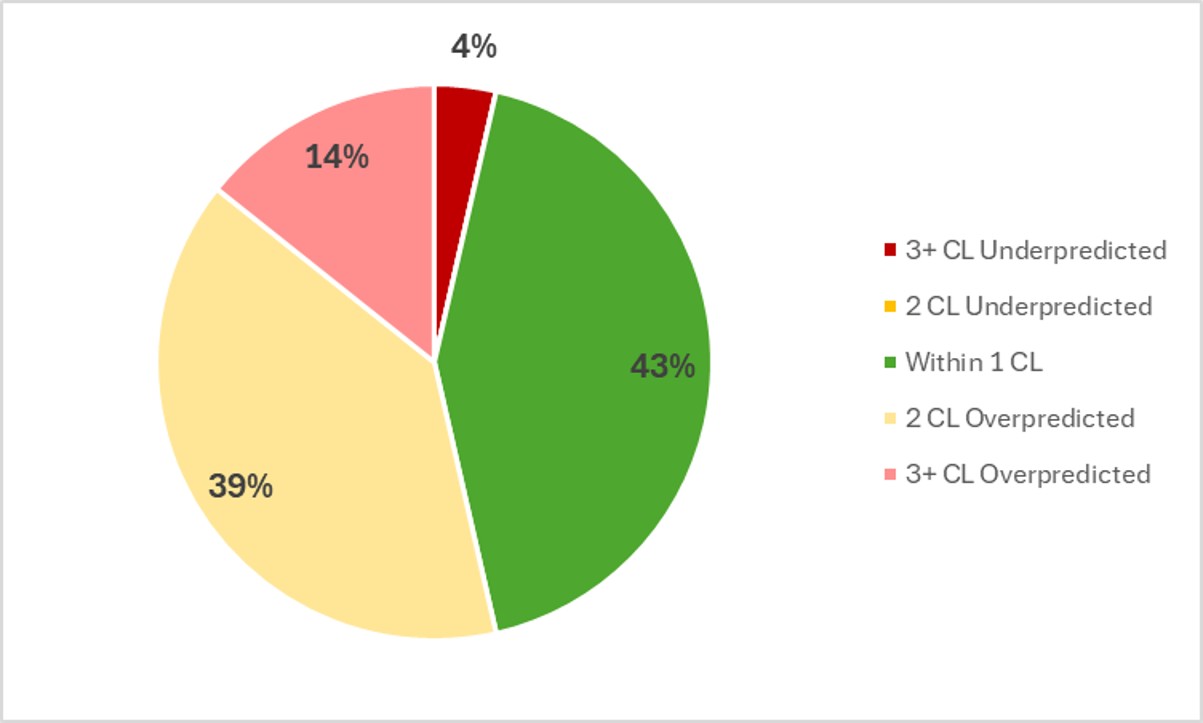
In the past week, Touring Plans predictions were either spot-on or within 1 crowd level 43% of the time, which continues a lightly downward trend. And then 72% of the time Touring Plans predictions were within 2 crowd levels, so that means we get a C- for our predictions in the past week, which is also lower than last week. We had two biggest misses of the week, on opposite ends of the prediction spectrum. First, on December 1st, we had an overprediction by 4 crowd levels at EPCOT, which was predicted to be a 6 and ended up being a 2. This was the first Monday of a new festival, but it was also a non-party day at Magic Kingdom, so it looks like everyone went there instead. Second, on November 25th we had a very very very rare underprediction by 4 crowd levels at Hollywood Studios, which was predicted to be a 4 and ended up being an 8. Ouch ouch ouch. As discussed above, there were several behaviors that led to this crowd spike.
Attraction Downtime November 25 – December 1
If we average all of the capacity lost due to unexpected downtime over the past week, it comes out to 3.3% of attractions unexpectedly being down. That’s below our historical average, and even slightly lower than last week. In the past week, Animal Kingdom was the park with the most overall downtime, averaging 4% of its capacity lost to downtime throughout that period. Once again, no real major issues at any park.
The worst day for attraction downtime in the past week was on November 29th. On that day, 5% of all capacity at WDW was lost due to unexpected downtime. All told, not a very bad worst day. And the worst park-day was at Animal Kingdom on November 29th. Back to a predictable combo of our worst park and our worst day! On that day, 9% of Animal Kingdom’s attraction capacity was lost due to unexpected downtime. Animal Kingdom was open for 10 hours on the 29th, so 9% downtime is the equivalent of the entire park shutting down for 54 minutes. Not great, but not even an hour. Hooray!
Attraction Downtime Worst Offender
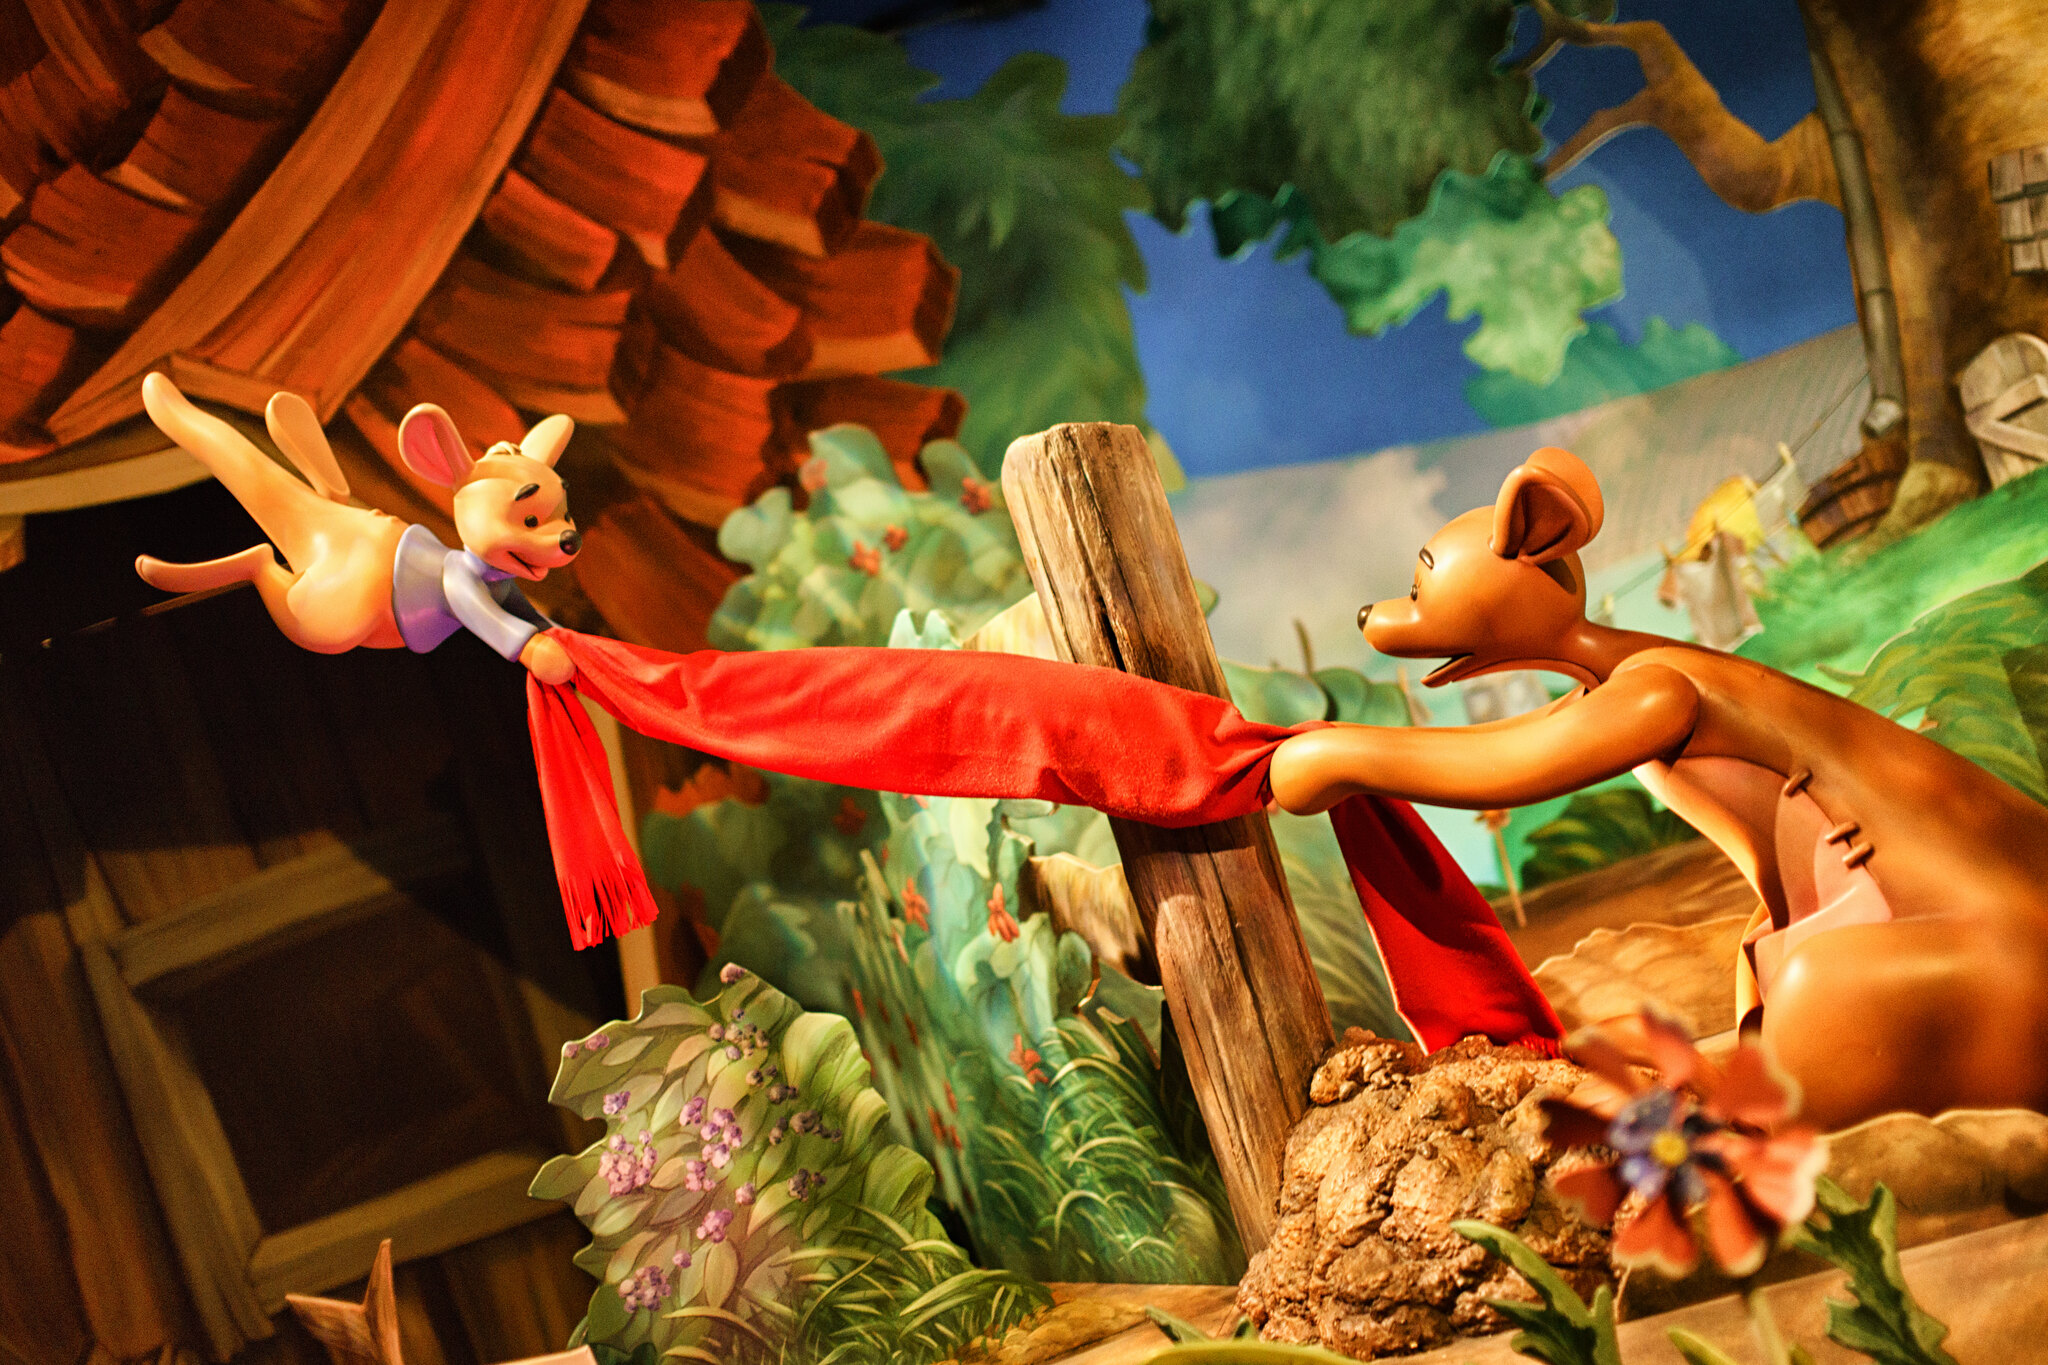
In the past week, The Many Adventures of Winnie the Pooh was the WDW attraction with the worst overall unplanned downtime. After never winning this category ever before, it’s now a repeated winner. Something must have gotten into the honey. It was unexpectedly down for 23% of the past week. Not only did it have the highest downtime overall, it had literally double the amount of downtime as the next-most-problematic attraction (Remy, 11% downtime). The worst day at Winnie the Pooh over the last week was easily on November 29th, when it was down for 83% of the day.
Rope Drop Downtime
Here are problematic offenders from the past week, with the percentage of downtime during the first hour of the day in parentheses:
- Magic Kingdom: The Many Adventures of Winnie the Pooh (36%), Space Mountain (16%), Seven Dwarfs Mine Train (13%), Tiana’s Bayou Adventure (11%)
- EPCOT: Spaceship Earth (37%), Remy’s Ratatouille Adventure (18%), The Seas with Nemo (16%), Gran Fiesta Tour (15%), Frozen Ever After (14%)
- Hollywood Studios: Rock’n’Roller Coaster (23%), Rise of the Resistance (18%)
- Animal Kingdom: Dinosaur (11%)
No gold stars again this week, which may be our new trend thanks to Disney probably not investing any time, effort, or money into making Dinosaur more reliable at this point.
Otherwise, EPCOT continues to stick out as our unreliable rope drop problem park. Which is a huge deal because it’s the park where it’s most difficult to use LLMP thanks to all of the walking (and demand for Tier One attractions), so rope drop is potentially the most important here. Thankfully this week Cosmic Rewind and Test Track both had good rope drop uptime. But International Gateway guests were slightly doomed with unreliability at Remy and Frozen.
Wait Times November 25 – December 1
Attractions with the Highest Average Posted Wait at Each Park
- EPCOT: Test Track, average posted wait of 76 minutes (was 69 minutes last week)
- Animal Kingdom: Flight of Passage, average posted wait time of 68 minutes (was 55 minutes last week)
- Hollywood Studios: Slinky Dog Dash, average posted wait of 68 minutes (was 57 minutes last week)
- Magic Kingdom: TRON, average posted wait time of 61 minutes (was 56 minutes last week)
If we’re comparing full weeks, it looks like this week that included Thanksgiving was quite a bit more crowded than the week before. But let’s remember than the week before was really two very different weeks (a reminder of the numbers is below). So really, it was more crowded than mid-November, but not AS crowded as the weekend before Thanksgiving. Things had already calmed down.
- Test Track: 57 minutes | 83 minutes
- Slinky Dog Dash: 51 minutes | 63 minutes
- TRON: 42 minutes | 72 minutes
- Flight of Passage: 36 minutes | 78 minutes
Parks with the Highest and Lowest Average Wait
- Highest: Hollywood Studios, average park-wide posted wait of 37 minutes (was 32 minutes last week)
- Lowest: Magic Kingdom, average park-wide posted wait of 20.5 minutes (was 20.5 minutes last week)
No major shifts, other than Hollywood Studios. But scroll back in your brain (or up on the page) and remember that Hollywood Studios started out VERY crowded, and then ended with barely any wait times at all. Your experience would have been wildly different depending on which day you attended.
Most Inflated Posted Wait Times
We all know that Disney inflates their posted wait times on purpose. They have many reasons for doing this. Some are totally understandable, and some are potentially more problematic. We can figure out how much posted wait times are being inflated by comparing submitted actual wait times from the Lines App and the posted wait time when the person timing their wait entered the line.
Over the past week, actual wait times in the Lines App averaged 67% of what was posted. That’s quite a bit below our LLMP historical average, which means that posted waits were MORE inflated than normal. So even those sad little crowd numbers that past few days were inflated more than normal. Overall, if the posted wait time at a popular attraction was 60 minutes, you could’ve expected to wait about 40 minutes instead.
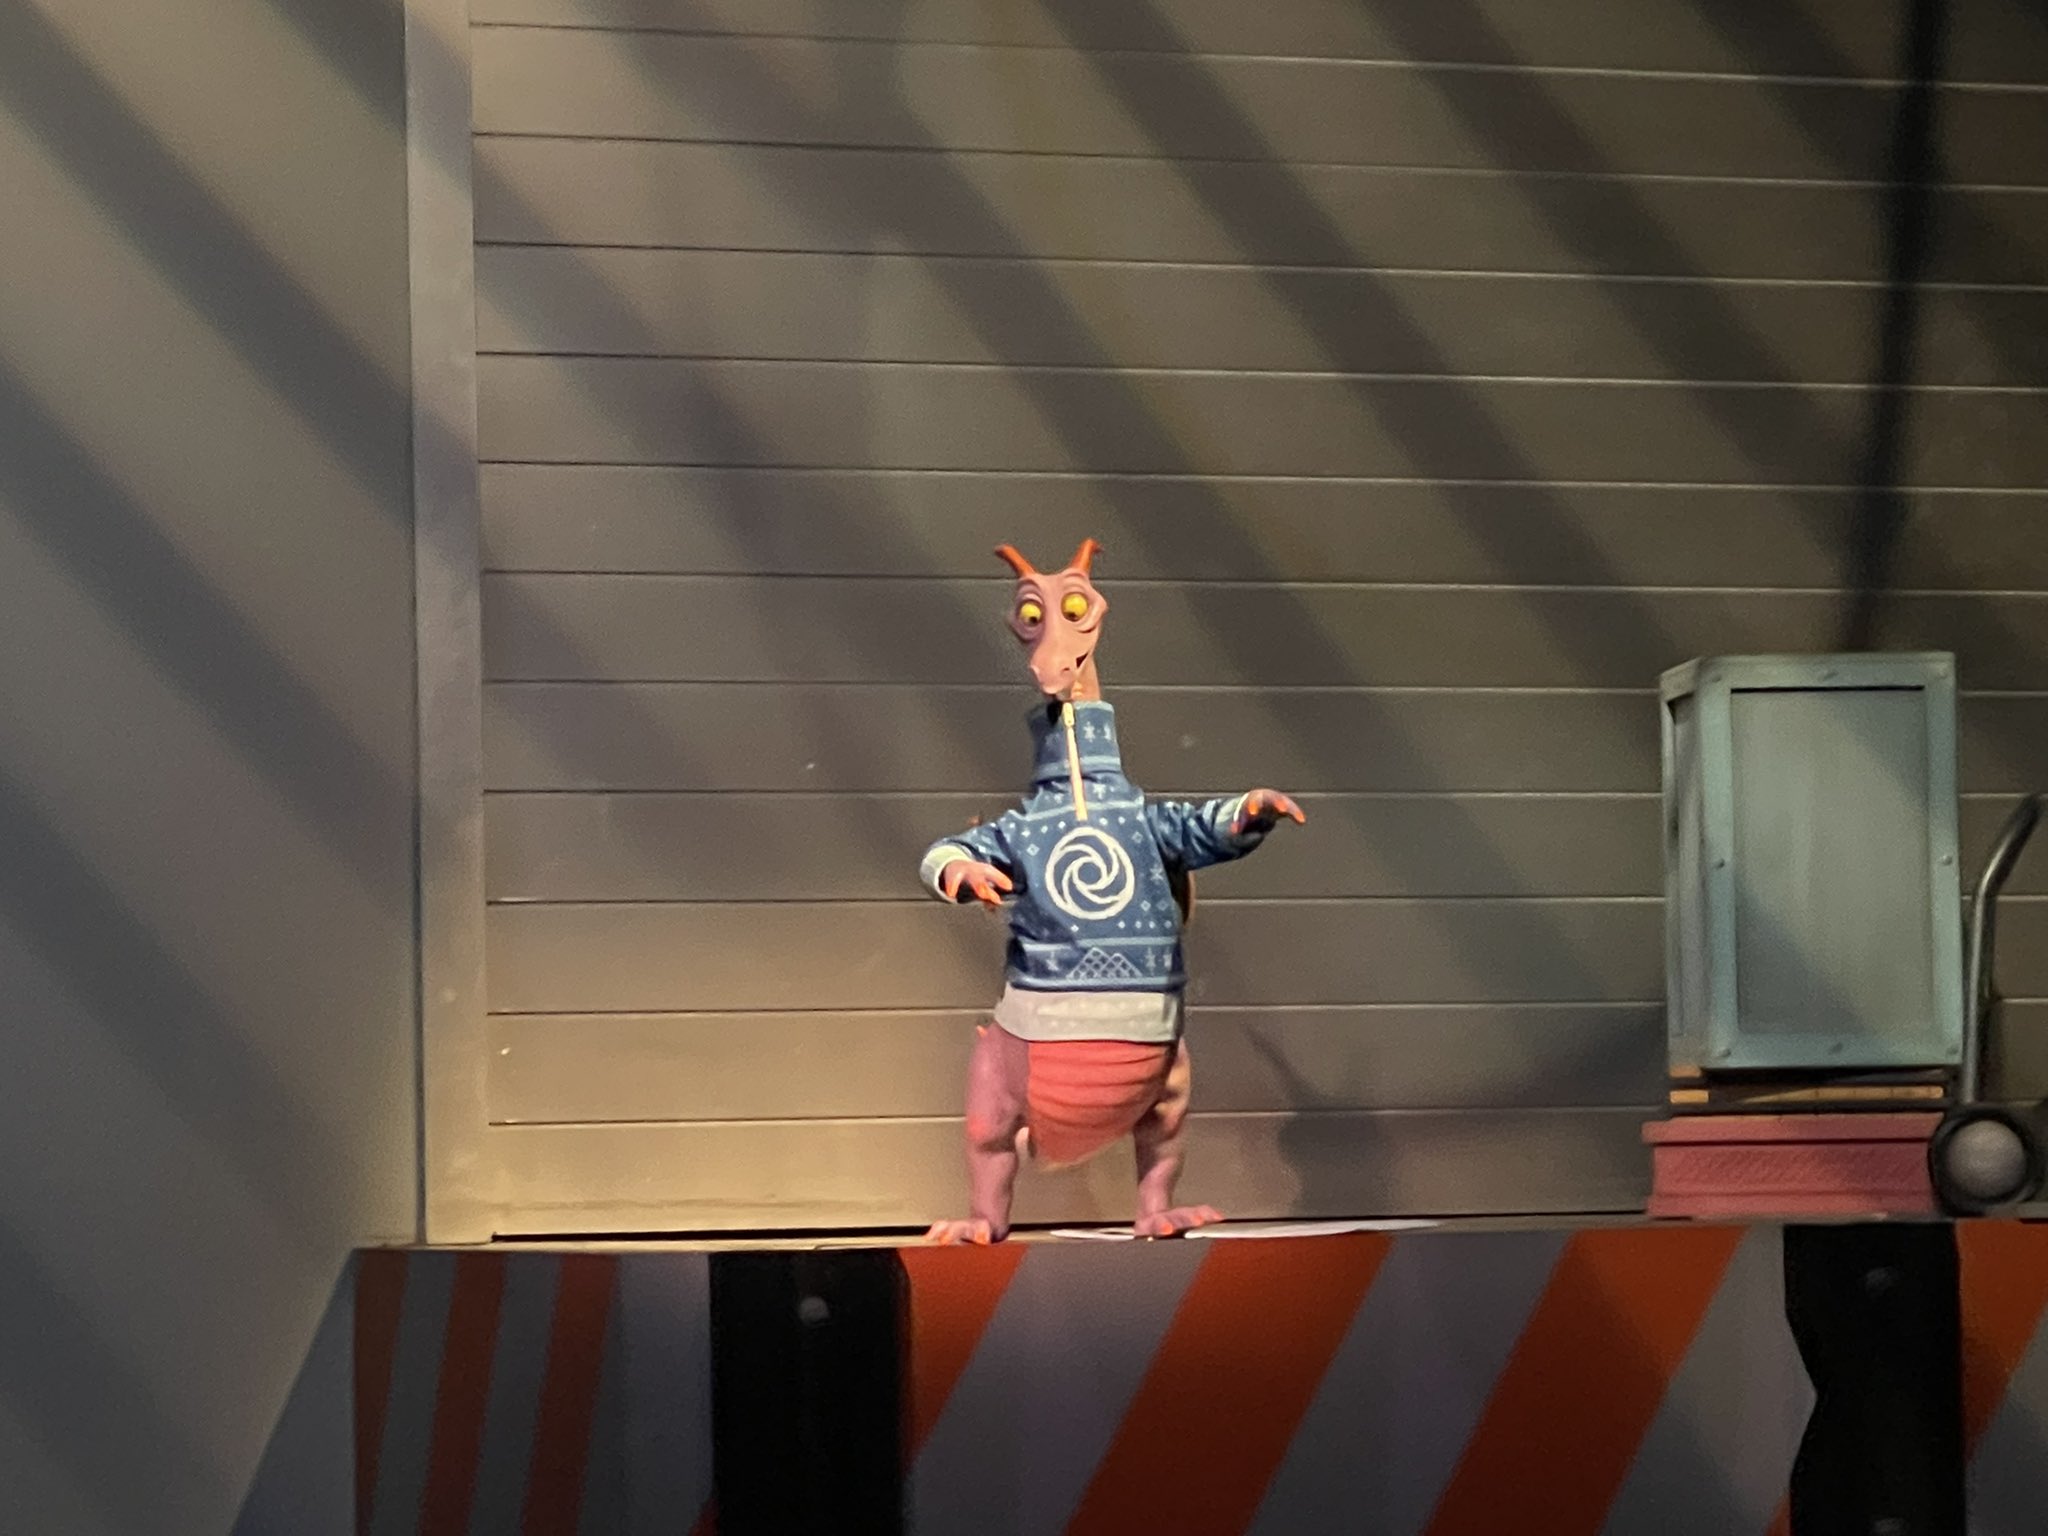
But the worst inflation offender for the past two weeks was Journey Into Imagination with Figment. At this one attraction, submitted actual wait times were only 32% of posted wait times in the past week. That means that if Figment had a 20 minute posted wait, you probably would have actually only waited 6. and a half minutes instead. Less than a third of what was posted! Remember to always check the Lines app for predicted actual waits instead of making decisions based on what is posted.
This Week’s Wait Time Rock Star
Between November 25th and December 1st, we had just under 900 timed actual waits submitted through the Lines app. The one person who recorded the most actual waits during that time was mobz555, with 23 overall timed waits – and it was in hard mode, with all standby waits! Thanks for all of that timing, mobz555! It unfortunately does not compete with the the 97 timed waits in a single week from our current timing champion, preef.
Looking Ahead: December 2 – 8
I write this article on Tuesday evenings so that you all have the very freshest of data on Wednesdays. That means the 2nd will already be in the past by the time you’ve read this, so you’ve made it to the future!
Party dates to consider: Jollywood Nights will be at Hollywood Studios on December 6th. We’re in the middle of a shift for which days of the week it is offered, so only one party date in this seven-day window. Much more importantly, Mickey’s Very Merry Christmas Party will mean Magic Kingdom closes early to guests on the 2nd, 4th, 5th, and 7th (plus the 9th). This should mean that the 3rd and 6th are especially crowded compared to surrounding days because they’ve each got three party days around them.
But otherwise, we’re in the “quiet” between-holiday season. It’s the calm before the chaos of winter break. If you’ll be in the parks next week, you should have relatively low wait times (if you avoid Magic Kingdom on non-party days) and an easy time getting dining reservations, etc.
The weather for this week is a little all over the place. Some warm and sunny days, and some cooler and rainy ones. Check on the forecast before you head to the parks, and make sure you travel to Orlando with umbrellas, rain jackets, sunscreen, and sweatshirts.
Were you in the parks this past week? Or are you headed to Orlando soon? Let me know in the comments below!
You May Also Like...
-

Welcome to June, and to the first full week of Cool Kid Summer at Walt Disney World! With new deals in…
-

For the first time ever, this week’s Data Dump comes to you from the back porch of Jambo House, with giraffes…
Love the analysis. The party season crowd patterns are so interesting to me. We were in the parks the week before Thanksgiving and a few days into Thanksgiving week. Utilizing some party day strategy during this time can really help to avoid the crowds, especially as we got closer to Thanksgiving. We only felt a slight impact of the incoming crowds by zigging while others zagged.
Love!! Glad it worked out for you and you were able to navigate the busy-ish season.