Disney Data Dump April 1 2026
If you were hoping for an April Fools’ joke where I tell you Spring Break crowds suddenly disappeared… I regret to inform you this is not that kind of post.
We are now fully in the peak of Spring Break season, and this past week shows the signs of things beginning to crest. Crowds didn’t spike out of nowhere. They built steadily. There are also some interesting wrinkles in this week’s data. One park saw wait times jump in a way that had more to do with downtime than demand, headliner reliability took a hit in a way we don’t often see, and the parks that typically struggle with capacity are starting to feel that pressure again in a big way.
Let’s dive into what actually happened this week, and what it tells us about the rest of Spring Break season.
Observed Crowd Levels March 24 – 30
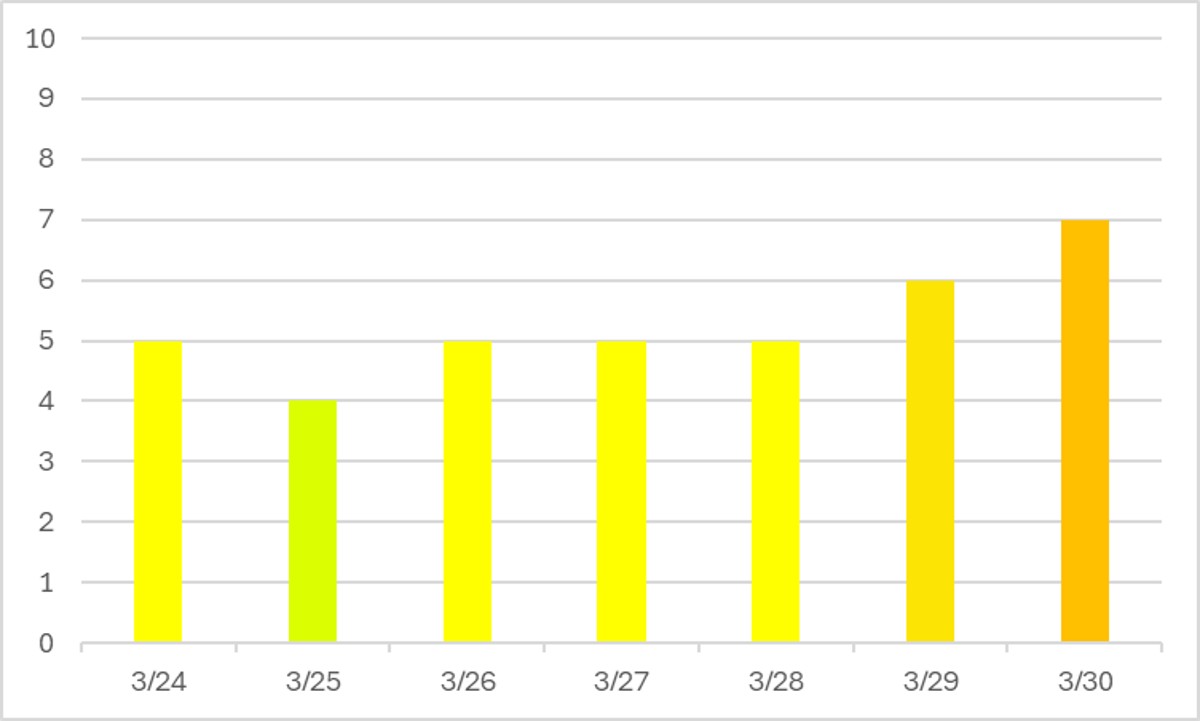
The last bit of March shows the gradual ramp up as Spring Break season peaks over Easter. One little minimum happened mid-week on the 25th, and then crowds started arriving again over the weekend as the week before April has the most Spring Breaks, nationally, of any week this year.
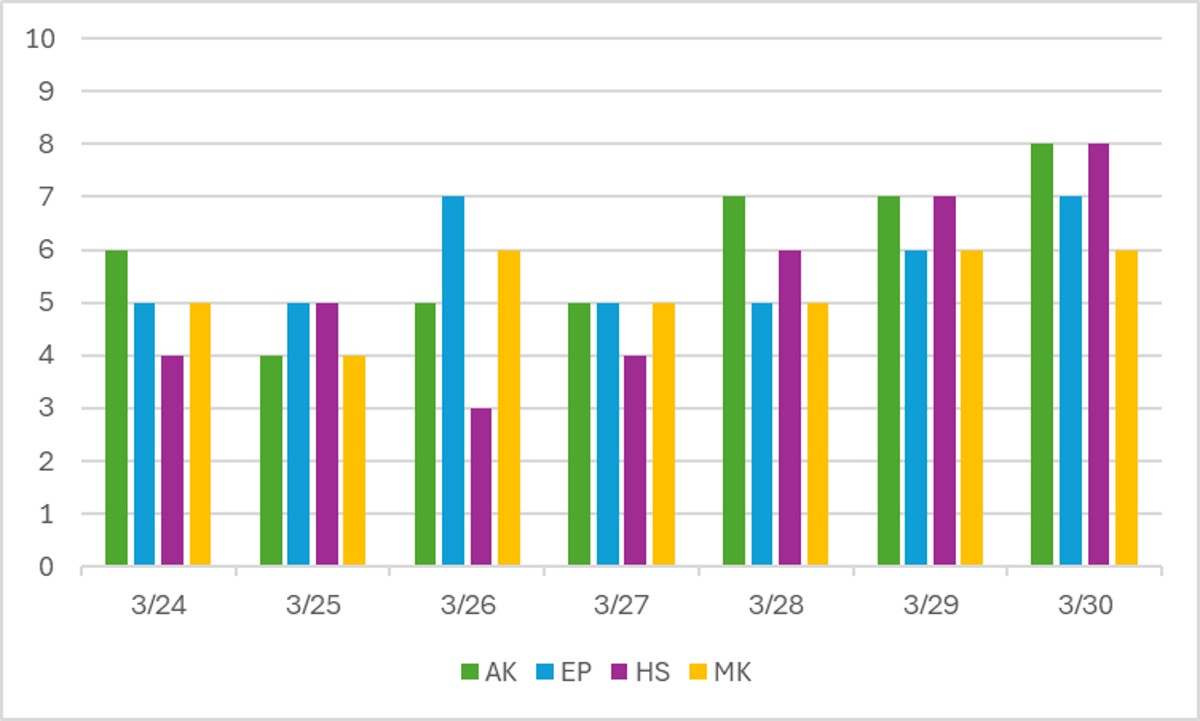
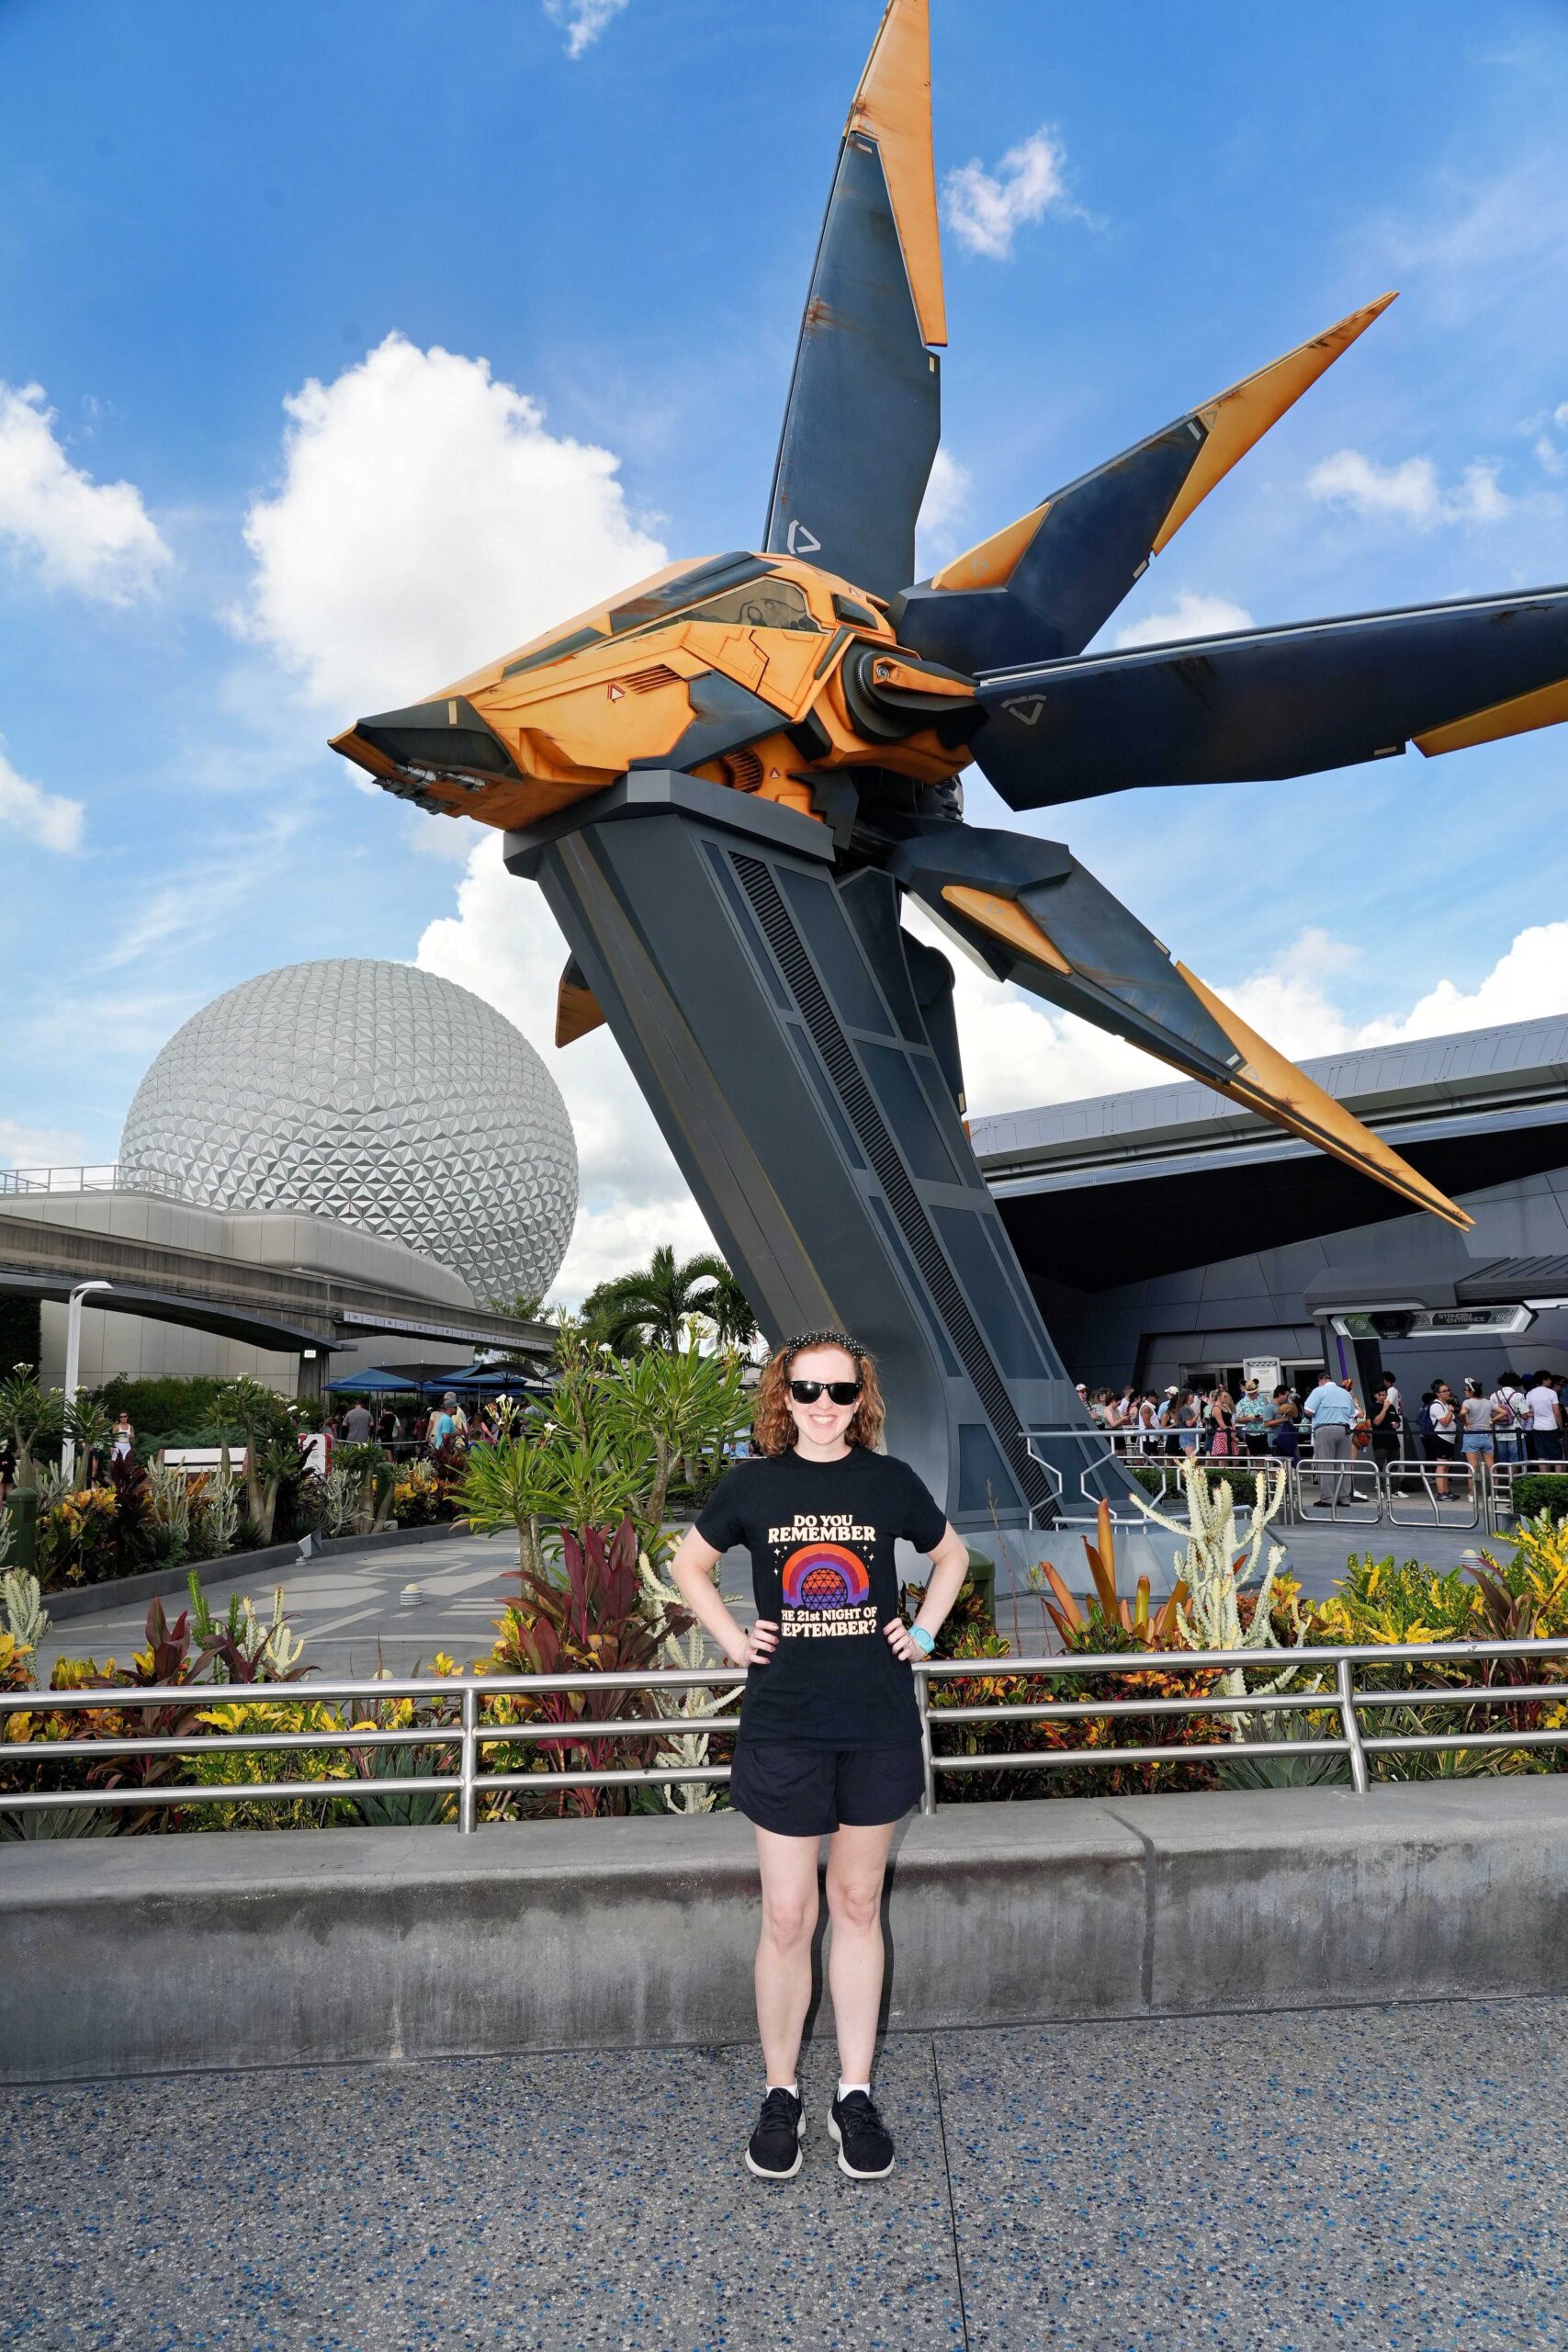
When we look park-by-park, we see a similar trend. One significant outlier is EPCOT, which had a whole bunch of unplanned downtime on the 26th, which resulted in much higher wait times than we otherwise would’ve seen. Magic Kingdom remains the park that absorbs crowds the easiest, while Animal Kingdom and Hollywood Studios don’t have enough attractions open to absorb crowds, so they see their wait times spike much faster.
Performance of Crowd Level Predictions
Each week, I give you a very transparent look into how the TouringPlans crowd level predictions performed. Each day at each park is one data point, so each week we have 28 different crowd level predictions to evaluate. Any time a prediction is within one or two crowd levels, things won’t really “feel” much different than what was predicted. Being off by 3 or more crowd levels is where you might feel that difference in wait times throughout the day.
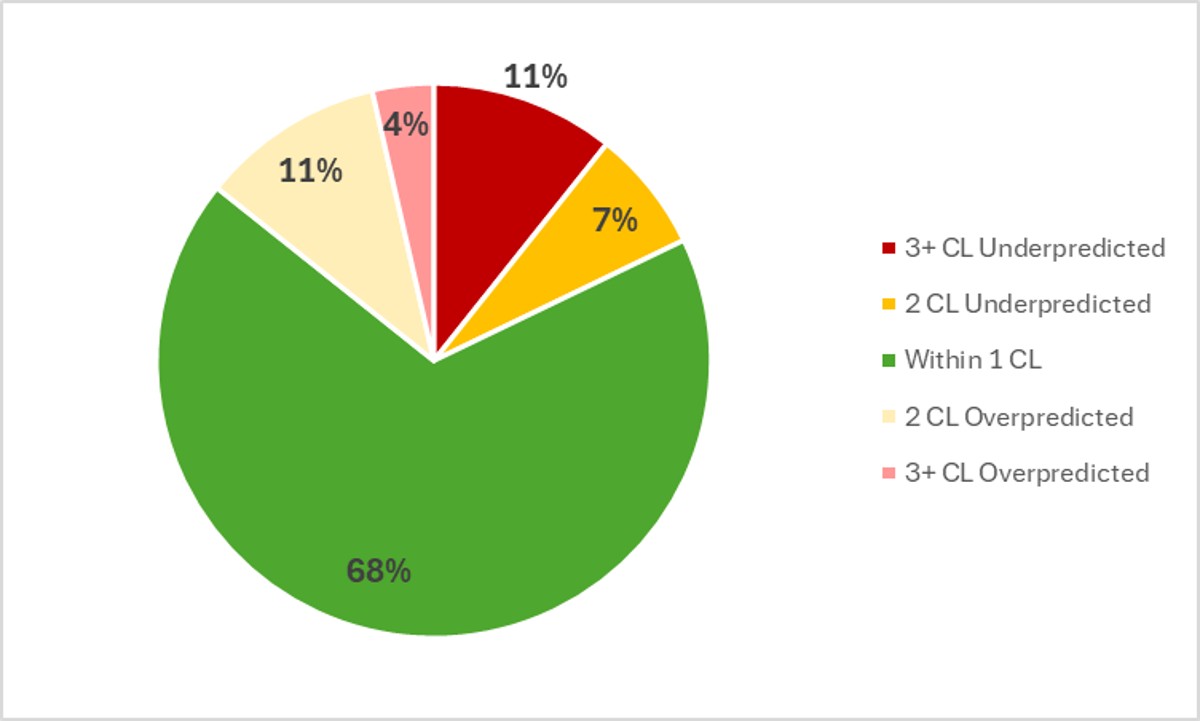
In the past week, Touring Plans predictions were either spot-on or within 1 crowd level 68% of the time, which is still lower than our average so far this year. And then 85% of the time Touring Plans predictions were within 2 crowd levels, so that means we get a B for our predictions in the past week. What may have been disappointing to those in the parks in the past two weeks is that a large number of misses were significant under-predictions. That means the parks were more crowded than predicted. Almost all of those underpredictions happened in the last two days of the week, which means we’re seeing more people come to the parks for the week before Easter than the model was accounting for. But this is the most popular Spring Break week of the year. The biggest miss of the week was an under-prediction by 4 crowd levels, which happened at Hollywood Studios on the 30th.
Attraction Downtime March 24 – 30
If we average all of the capacity lost due to unexpected downtime over the past week, it comes out to 4.4% of attractions unexpectedly being down. That’s thankfully back down from last week, although still slightly higher than what we expect during crowded seasons. Usually Disney works pretty hard to keep as much online as possible when crowds are high. In the past week, EPCOT was the park with the most overall downtime, averaging 6.6% of its capacity lost to downtime. That’s a lot lower than what we’ve seen for our highest downtime park for the past month or so, but still impactful.
The worst day for attraction downtime in the past week was on March 26th. On that day, 6% of all capacity at WDW was lost due to unexpected downtime. But the worst park-day of the was at EPCOT on March 26th, when 11% of that park’s capacity was lost due to unexpected downtime. EPCOT was open for 12 hours on the 26th, so 11% downtime is the equivalent of the entire park shutting down for just over 79 minutes. Even more unfortunately, almost all of that downtime was at big headliners. That caused a large spike in wait times at EPCOT that day.
Attraction Downtime Worst Offender
While this wasn’t a particularly bad week for overall downtime as far as the numbers show, it was a really bad week for multiple headliners. And that’s rare. In the past week, Cosmic Rewind was the WDW attraction with the worst overall unplanned downtime. Nooooooo! It was unexpectedly down for 21.5% of the past week. Almost a quarter of the week! That’s incredibly rare for this regularly-reliable attraction. The worst day at Cosmic Rewind over the last week was on March 26th, when it was down for 60% of the day. But it also broke down just after 2 pm on the 28th, and didn’t come back up until almost 1 pm on the 29th.
But Kali River Rapids also had 21% downtime this week, Rise of the Resistance had 17% downtime this week, and Tiana’s Bayou Adventure had 13% downtime this week. We sometimes see headliners with those numbers for rope drop downtime in a week, but overall downtime that high at that many headliners is rare.
Rope Drop Downtime
Here are problematic offenders from the past week, with the percentage of downtime during the first hour of the day in parentheses:
- Magic Kingdom: Country Bear Musical Jamboree (41%), Tiana’s Bayou Adventure (34%), Monsters Inc Laugh Floor (31%), Pirates of the Caribbean (25%), Mickey’s PhilharMagic (24%), Enchanted Tiki Room (23%), The Barnstormer (20%), Hall of Presidents (16%)
- EPCOT: Cosmic Rewind (29%), Frozen Ever After (21%), Spaceship Earth (10%)
- Hollywood Studios: Rise of the Resistance (47%), Star Tours (14%), Runaway Railway (11%)
- Animal Kingdom: Kali River Rapids (100%), Kilimanjaro Safaris (10%)
MAGIC KINGDOM. What in the world?! Seven different attractions that are missing at least 20% of their rope drop hours in the past week. That’s just too many. Thankfully, it’s not many headliners. But it still greatly reduces the amount of choice people should have at rope drop.
Hollywood Studios had a better week this week, other than Rise missing almost half of its rope drop time. Cosmic Rewind had a rare bad rope drop week too! And Kali River Rapids just threw in the towel and seemingly didn’t even attempt to wake up on time.
Wait Times March 24 – 30
Attractions with the Highest Average Posted Wait at Each Park: March 24 – 30
- EPCOT: Cosmic Rewind, average posted wait of 99 minutes (was 115 minutes last week)
- Hollywood Studios: Rise of the Resistance, average posted wait of 88 minutes (was 94 minutes at Slinky Dog Dash last week)
- Magic Kingdom: TRON, average posted wait time of 76 minutes (was 90 minutes last week)
- Animal Kingdom: Flight of Passage, average posted wait time of 70 minutes (was 90 minutes last week)
One outlier here is Rise of the Resistance suddenly having the highest posted wait at Hollywood Studios for the week. It’s almost always Slinky Dog Dash, and the only exception this year was the last week before Rock’n’Roller Coaster closed for retheming, when it took the top wait time spot. This upheaval is solely due to Rise having 17% downtime this week. That meant when it was open, wait times were driven higher. Otherwise, average waits were significantly down across the board at headliners. Those will bounce back up next week!
Parks with the Highest and Lowest Average Wait: March 24 – 30
- Highest: Hollywood Studios, average park-wide posted wait of 44 minutes (was 47 minutes last week)
- Lowest: Magic Kingdom, average park-wide posted wait of 24 minutes (was 27 minutes last week)
Last week, three parks had average posted waits of 45 minutes or more, and this week, no parks hit that number. Hooray! Once again, this will change in the upcoming week.
Most Inflated Posted Wait Times
We all know that Disney inflates their posted wait times on purpose. They have many reasons for doing this. Some are totally understandable, and some are potentially more problematic. We can figure out how much posted wait times are being inflated by comparing submitted actual wait times from the Lines App and the posted wait time when the person timing their wait entered the line.
Over the past week, actual wait times in the Lines App averaged 75% of what was posted. That’s well above our historical average in the era of Lightning Lanes, which means that posted waits were less inflated than normal. Hooray! Overall, if the posted wait time at a popular attraction was 60 minutes, you could’ve expected to wait 45 minutes instead.
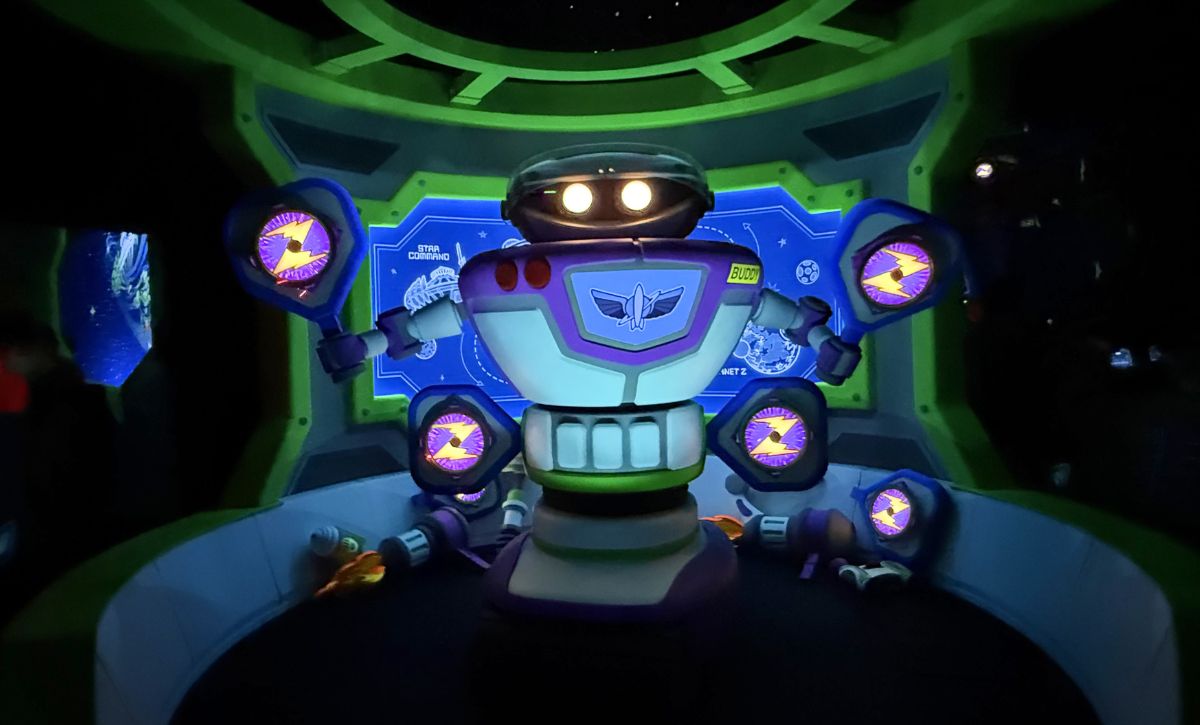
But the worst inflation offender for the past week was Buzz Lightyear. Surprise! It had an early soft opening, and Disney was clearly trying to discourage people from jumping into line by inflating what was posted. At this one attraction, submitted actual wait times were only 45% of posted wait times in the past week. That means that if Buzz had a 30 minute posted wait, you probably would have actually only waited less than 14 minutes instead. Less than half of what was posted! Remember to always check the Lines app for predicted actual waits instead of making decisions based on what is posted.
This Week’s Wait Time Rock Star: March 24 – 30
Between March 24th and 30th, we had just over 900 timed actual waits submitted through the Lines app. The one person who recorded the most actual waits during that time was Jrzylisah, with 25 overall timed waits – and it was in hard mode, with all standby waits! Thanks for all of that timing, Jrzylisah! It unfortunately does not compete with the the 97 timed waits in a single week from our current timing champion, preef.
Looking Ahead: March 31 – April 6
I write this article on Tuesday evenings so that you all have the very freshest of data on Wednesdays. That means the 6th will already be in the past by the time you’ve read this, so we’ve done some time travel!
Most Annual Passholders are now blocked out through April 9th. But we’re also in the very peak of Spring Break season, so wait times and crowd levels are going to be high through Easter. Don’t be surprised by long lines, especially at Hollywood Studios and Animal Kingdom. Disney clearly expects this, with longer park hours and plenty of nighttime entertainment on the schedule.
The week after Easter will still see some elevated crowds, but nothing as crazy as this week. After that, things should drop off pretty sharply as schools wrap up their year with plenty of standardized testing that keeps kids present, and rising temps that discourage families from braving the Orlando summer.
For now, temperatures remain moderate (or better than moderate, if you’re languishing in faux Spring in the Midwest like me). Rain showers are going to start sneaking into the forecast, especially on and after Easter. So make sure you bring some dry socks, umbrellas, and jackets or ponchos so you can weather those April showers while everyone else runs for cover.
Were you in the parks this past week? Or are you headed to Orlando soon? Let me know in the comments below!
You May Also Like...
-

March was surprisingly mild, and now April has entered the chat saying, “Hold my Dole Whip.” The first full week of…
-
Now this is the late winter/early spring that we know and love. After a couple of weeks of lingering long-weekend chaos,…