Disney Data Dump August 20, 2025
Another week, another round of Disney data to dissect! This one is a summer stunner. Crowd levels that barely made it above a 2, parties that flipped Magic Kingdom into ghost town mode (ooh spooky), and a WHOLE lot of downtime. It’s the kind of week that makes you want to target mid-August for your next Walt Disney World trip. As long as you can handle the heat. Let’s dive into what the numbers have to tell us.
Observed Crowd Levels August 12 – 18
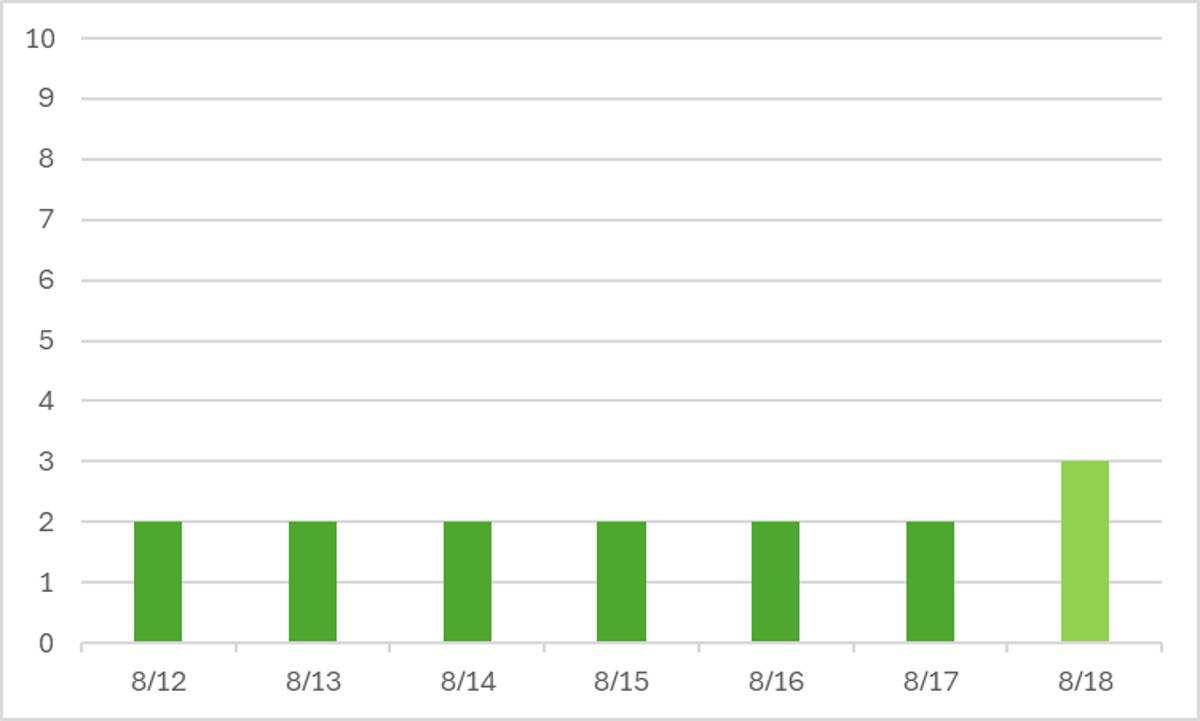
Oh hey there, end of summer slump! This is what near perfection in the parks looks like. Other than the temperatures nearing surface-of-the-sun levels, you couldn’t have asked for a better week as far as wait times are concerned. Only one day got above a crowd level 2?! And that’s thanks to Magic Kingdom party behavior – more on that below.
Mickey’s Not So Scary Halloween Party kicked off on August 15th – a glorious crowd level 1 day at Magic Kingdom. In fact, wait times were so low in MK that day that I went back and charted a course that would have accomplished 30 attractions between 7:30 am and 6 pm. That’s with a 45 minute break for lunch, bathroom and snack breaks, watching the parade, and accounting for major downtime at Space Mountain and Seven Dwarfs Mine Train throughout the day. Plus no purchases of Lightning Lane Multi-Pass or Single Pass. Wild.
But then on August 18th we see the other side of this coin. The 18th is between two party dates (on the 17th and 19th), and so most people visiting Walt Disney World in the beginning of the week will choose to go to Magic Kingdom on the 18th so they can see Starlight and Happily Ever After. So suddenly instead of pretty reliable crowd level 1 or 2 days, Magic Kingdom pops up to a 4 instead. Now, a 4 isn’t so bad. But this same behavior will continue into the fall when the parks get more crowded overall. So you’ll keep seeing crowd levels between 1 and 3 on party days, but those non-party days like the 18th will pop up to something more like a 7-9. BIG difference in wait times.
Elsewhere, Diet EPCOT is still in full force despite high waits at Test Track and Cosmic Rewind. That won’t last much longer, with the return of Food & Wine Festival on August 28th. Enjoy it while you can!
Performance of Crowd Level Predictions
Each week, I give you a very transparent look into how the TouringPlans crowd level predictions performed. Each day at each park is one data point, so each week we have 28 different crowd level predictions to evaluate. Any time a prediction is within one or two crowd levels, things won’t really “feel” much different than what was predicted. Being off by 3 or more crowd levels is where you might feel that difference in wait times throughout the day.
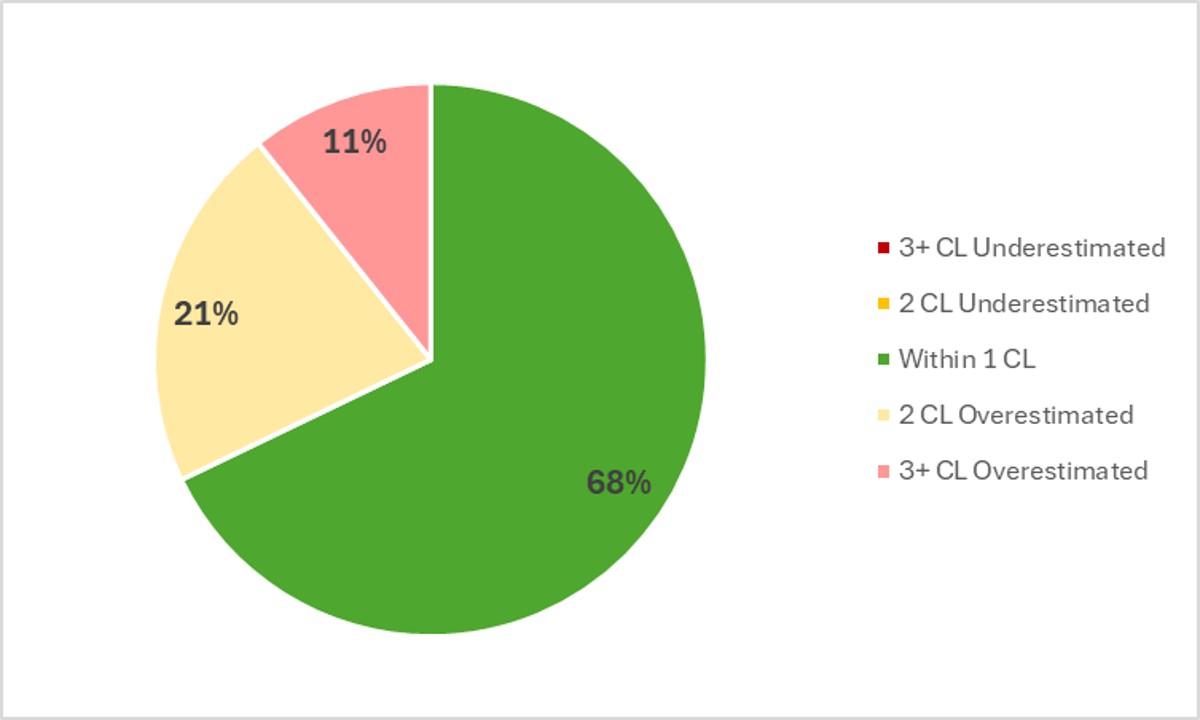
In the past week, Touring Plans predictions were either spot-on or within 1 crowd level 68% of the time, which is not too shabby! 89% of the time Touring Plans predictions were within 2 crowd levels, so that means we get a B+ for our predictions in the past week. That’s much higher than the average result for the year. On average, the crowd level at any park any day of the week was 1.2 crowd levels below prediction. That’s significantly lower than last week, but still within the margin of error. The biggest miss of the week was an overprediction by 4 crowd levels, which happened at Magic Kingdom on the 13th – Touring Plans predicted a 6, and the actual crowd level turned out to be a 2.
Attraction Downtime August 12 – 18
If we average all of the capacity lost due to unexpected downtime over the past week, it comes out to 6.6% of attractions unexpectedly being down. That’s significantly above our historical average, and higher than the highest park downtime last week. Not good. In the past week, Magic Kingdom was again the park with the most overall downtime, averaging 8.6% of its capacity lost to downtime throughout the week. To put that in perspective, Magic Kingdom was open for a total of 90 hours over the past week. But downtime was so bad that it’s almost as if the whole park randomly shut down for almost 8 hours. That’s almost a full park day on a party day!
The worst day for attraction downtime in the past week was on August 18th. On that day, 11% of all capacity at WDW was lost due to unexpected downtime. The worst park-day of the week was a nice predictable combination of the worst day and worst park – August 18th at Magic Kingdom. On that day, 16% of its attraction capacity was lost due to unexpected downtime. Magic Kingdom was open for 14 hours on the 18th, so 16% downtime is the equivalent of the entire park shutting down for 134 minutes. That’s like the entire park opening more than 2 hours late or closing more than 2 hours early!
Attraction Downtime Worst Offender
This is a Disney Data Dump first. History in the making, folks. I’m crowning two downtime losers this week. Because they had almost identical downtime percentages, and they’re both big headliners that have a large impact on in-park strategy. In the past week, Seven Dwarfs Mine Train AND Slinky Dog Dash were the WDW attractions with the worst overall downtime. They were both unexpectedly down for 25% of the past week. Think about that – the two biggest family coasters at Walt Disney World and they were both down for a quarter of the entire week! And it wasn’t all weather-related downtime either. The worst days at Seven Dwarfs Mine Trains were on August 15th and 18th, when it was down for 40% of the day. And the worst day for Slinky was on August 18th, when it was down for 50% of the day. Most of those terrible downtime days started in the morning – not during afternoon thunderstorms.
And if you think Test Track is off the hook after its terrible reliability last week … it’s not. It still had 21% downtime this week.

Rope Drop Downtime
Here are problematic offenders from the past week, with the percentage of downtime during the first hour of the day in parentheses:
- Magic Kingdom: Under the Sea (21%), TTA PeopleMover (20%), Haunted Mansion (18%), Seven Dwarfs Mine Train (18%), Space Mountain (16%), Magic Carpets (15%), Dumbo (15%), Winnie the Pooh (11%), Pirates of the Caribbean (10%)
- EPCOT: Test Track (21%), Remy’s Ratatouille Adventure (12%)
- Hollywood Studios: Slinky Dog Dash (29%), Runaway Railway (19%), Rise of the Resistance (13%)
- Animal Kingdom: No rope drop issues!
If I could insert a sobbing emoji for Magic Kingdom here, I totally would. What is happening?! Even Dumbo couldn’t open on time this week! It was just a terrible week for trying to rope drop anything at Magic Kingdom – except for maybe Peter Pan’s Flight, which is always a good choice.
EPCOT and Hollywood Studios don’t get to hide behind Magic Kingdom either. Test Track missing a fifth of its rope drop time is terrible, and any week that the Slinky/Rise combo shows up on the naughty list is a bad week.
Wait Times August 12 – 18
Attractions with the Highest Average Posted Wait at Each Park
- EPCOT: Test Track, average posted wait of 72 minutes (was 81 minutes last week)
- Animal Kingdom: Flight of Passage, average posted wait time of 63 minutes (was 75 minutes last week)
- Hollywood Studios: Slinky Dog Dash, average posted wait of 63 minutes (was 77 minutes at Rise of the Resistance last week)
- Magic Kingdom: TRON, average posted wait time of 59 minutes (was 69 minutes last week)
Oh heyyyyyyy reasonable waits at all headliners! Rise of the Resistance is finally back down off of its unusual highs from the past 3 weeks. It only had an average posted wait of 51 minutes over the past week. And Tron was under an hour! Thanks, party days. You’re the best.
Parks with the Highest and Lowest Average Wait
These parks likely won’t change week-to-week unless something ridiculous happens, but these data points will give us a high-level view of how wait times are trending from week to week.
- Highest: Animal Kingdom, average park-wide posted wait of 31.5 minutes (was 37 minutes last week)
- Lowest: Magic Kingdom, average park-wide posted wait of 19 minutes (was 21.5 minutes last week)
Animal Kingdom is back in charge of high wait times, mostly thanks to Hollywood Studios dropping back below 30 minutes as a park. Which is crazy, people. So many high wait attractions there, but fewer crowds. Animal Kingdom also doesn’t have crowds, but it only has a few attractions with posted waits.
Most Inflated Posted Wait Times
We all know that Disney inflates their posted wait times on purpose. They have many reasons for doing this. Some are totally understandable, and some are potentially more problematic. We can figure out how much posted wait times are being inflated by comparing submitted actual wait times from the Lines App and the posted wait time when the person timing their wait entered the line.
Over the past week, actual wait times in the Lines App averaged 70% of what was posted. That’s above our historical average, which means that posted wait times were more accurate than normal this week. Hooray! Overall, if the posted wait time at a popular attraction was 60 minutes, you could’ve expected to wait just 42 minutes instead.
But the worst inflation offender for the past week was The Barnstormer At this one attraction, submitted actual wait times were only 35% of posted wait times in the past week. That means that if The Barnstormer had a 15 minute posted wait, you probably would have actually only waited just about 5 minutes instead. Almost a third of what was posted. Remember to always check the Lines app for predicted actual waits instead of making decisions based on what is posted.

This Week’s Wait Time Rock Star
Between August 12th and 18th, we had almost 1500 timed actual waits submitted through the Lines app. The one person who recorded the most actual waits during that time was panbuck97, with 28 overall timed waits – 17 standby waits and 11 Lightning Lane waits. Thanks for all of that timing, panbuck97! It unfortunately does not compete with the the 97 timed waits in a single week from our current timing champion, preef.
Looking Ahead: August 19 – 25
I write this article on Tuesday evenings so that you all have the very freshest of data on Wednesdays. That means the 19th will already be in the past by the time you’ve read this, so welcome to your future!
First things first, let’s go over Magic Kingdom party dates! MK will close early to day guests on August 19th, 22nd, and 24th. That means those days will be pretty glorious and uncrowded if you’d like to visit with low wait times. What are the days to avoid? August 23rd and 25th. Each of those dates is a non-party day surrounded by party days. Guests will be disproportionately drawn to Magic Kingdom on those days.
Thankfully, it’s mid-to-late August and in a lull after most schools have headed back for the fall, but before big events like D23 and the kick-off of Food & Wine Festival. That means overall crowds and wait times should stay pretty low over the coming week.
What isn’t low? Temperatures. (See what I did there? Clever transition.) Highs will still be in the 90s this week, with plenty of reliable afternoon thunderstorms. Prepare for the heat and the rain!
Were you in the parks this past week? Or are you headed to Orlando soon? Let me know in the comments below!
You May Also Like...
-

Well, that Starlight Summer Surge was ... brief. It fizzled fast, and now we’re solidly in empty August territory. Blame school…
-

We’re still coasting through the calm of August, and if you can handle the triple-digit feels-like temps, this is prime park…
Well, the 23rd WILL be my Magic Kingdom day, but my optimized touring plan still shows I should have everything (26 items, including attractions and dining) done by 5:30pm, so that ain’t bad! Thanks for the data dump, this is great info for my trip!
It’ll still be August – so nothing crazy!
I (panbuck97) will try to do better next time. Lol
In my defense, I feel I was hampered by when the week was calculated. I was in park Sunday through Friday!
Hey, you won for the week! That’s a major accomplishment!
Hmm, I was at Animal Kingdom on the 18th and Everest was definitely down for the first two and half hours of the official 8AM park opening.
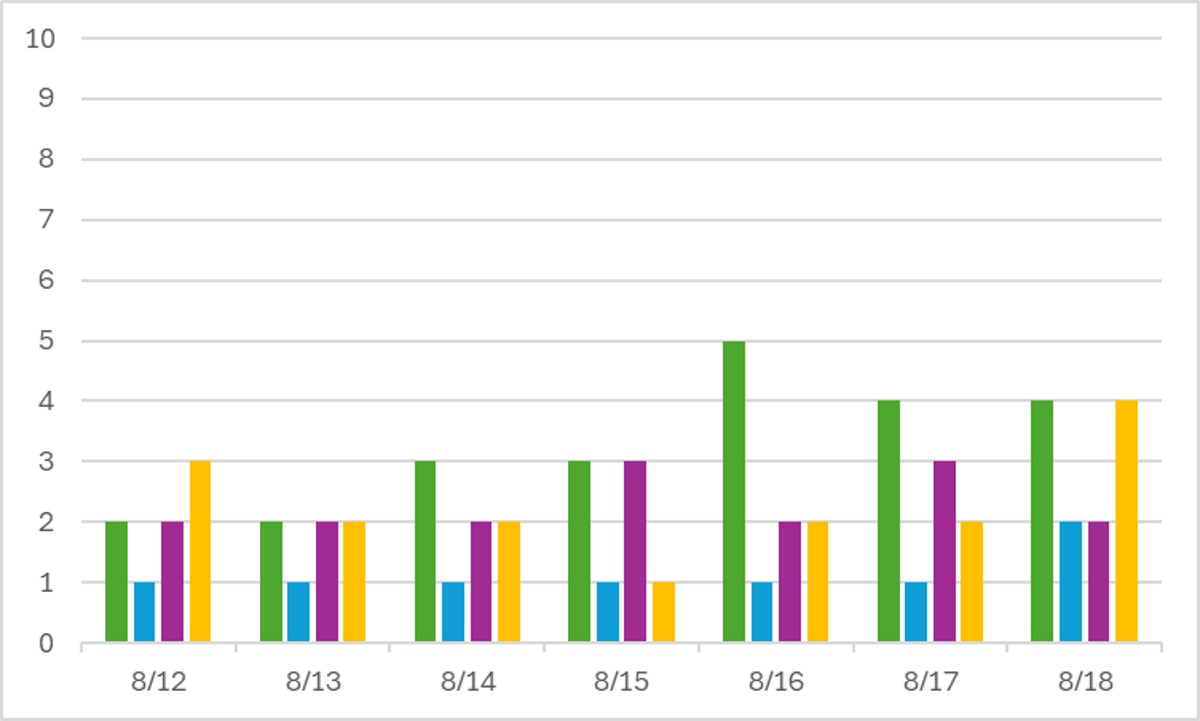
The Observed Crowd Levels by Park graph does not say which color is which park. Please correct.