
Disney Data Dump December 7 2022
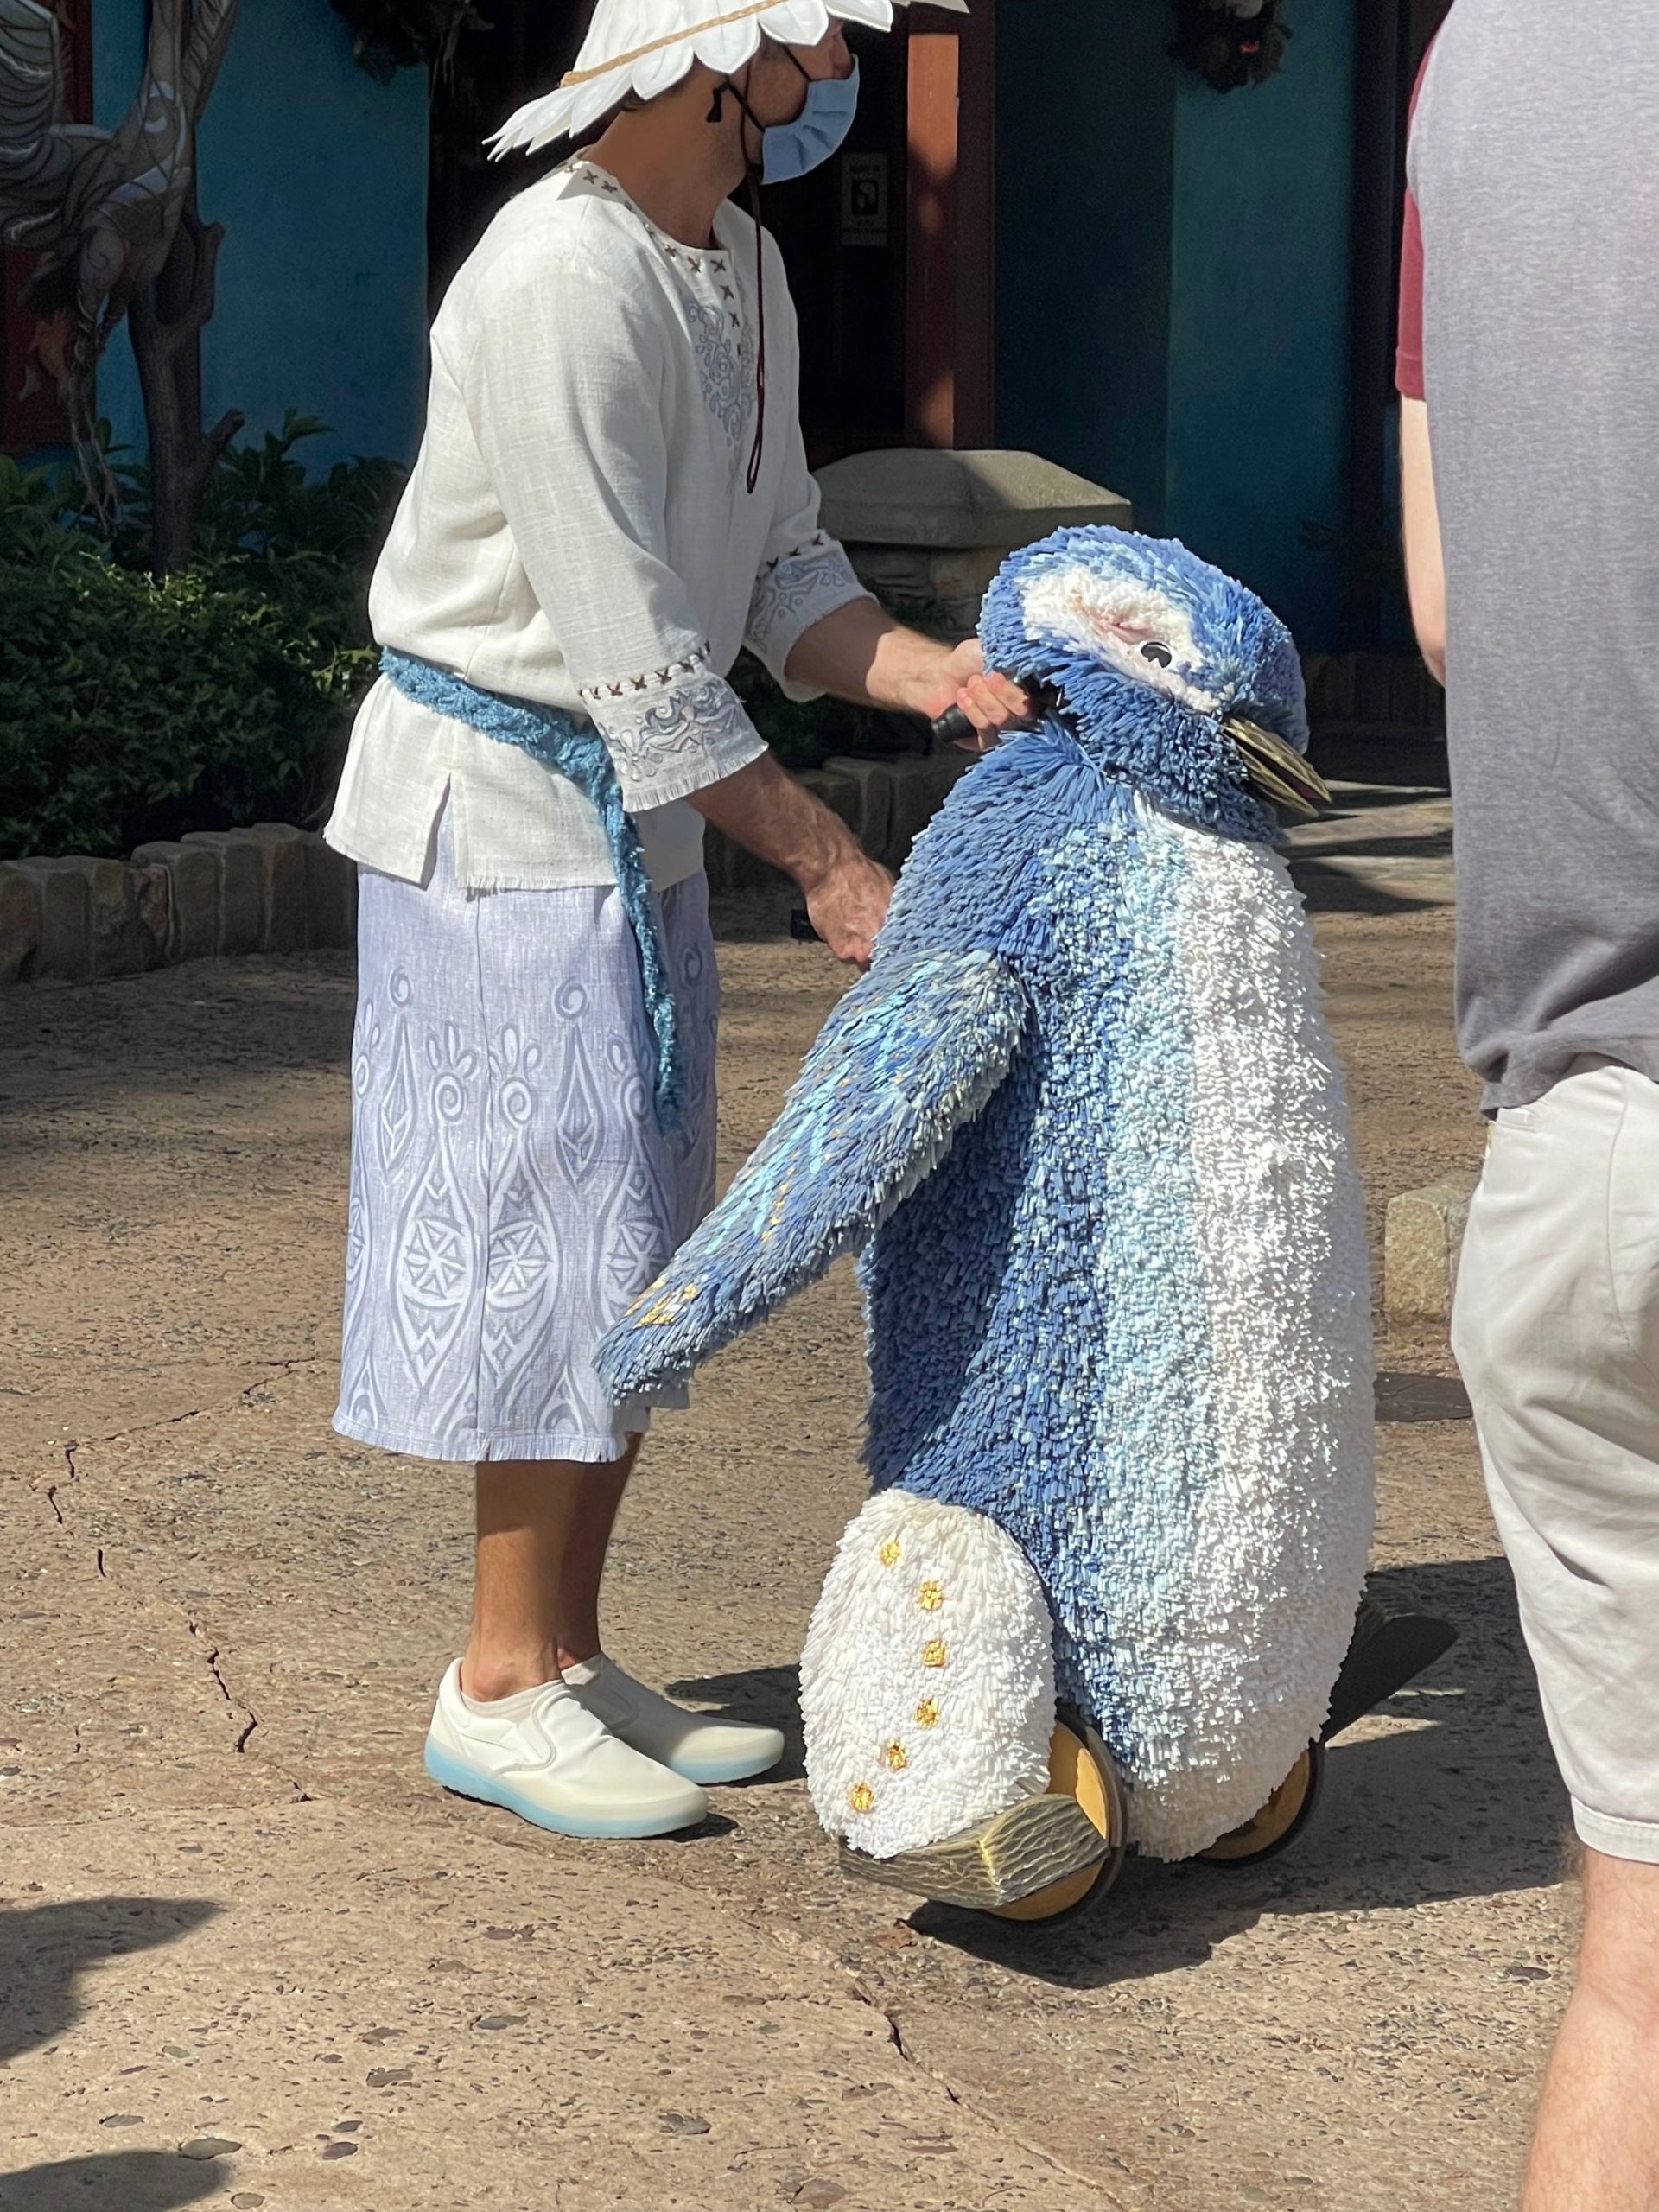
Welcome to December, Disney data friends! The Festival of Holidays is in full swing, along with the Candlelight Processional. Fantasmic continues to draw guests to Hollywood Studios in the evening. The Merry Menagerie is charming guests at Animal Kingdom, and Christmas parties continue to lead to large swings in crowd levels at Magic Kingdom. Let’s see just how lovely this first week of December is compared to the crazy of last week, and the crush of humanity that will descend upon the parks later this year.
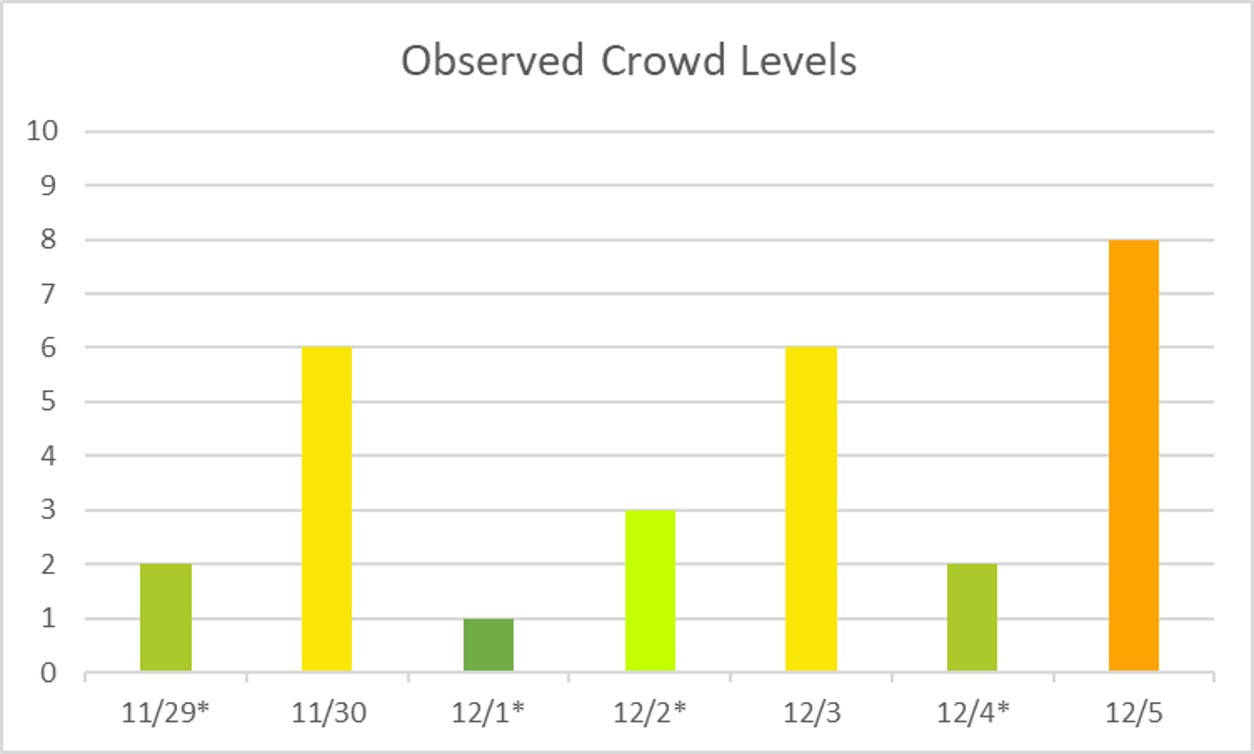
Observed Crowd Levels 11/29 – 12/5

Look at that lovely post-Thanksgiving lull! If you’ve ever questioned whether travelling to Walt Disney World the week after Thanksgiving is the right idea … it is. We haven’t seen crowd levels this lovely since September, which is my personal favorite month to visit Orlando. But things are starting to pick back up. I didn’t think we’d already see a crowd level 7 in the first week of December. It’s the start of a steady rise in crowds all of the way through the end of the year. More green bars will be rare.
Magic Kingdom is back to being a tale of two very different parks. If you visited Magic Kingdom on December 1st, I commend you and congratulate you on your most excellent day! We’re going to continue seeing holiday crowds “squished” into the remaining non-party days. And by the time the parties wrap up for the year, crowds will be so high that it won’t matter anyway. I fully expect to see at least a 3-5 crowd level difference between party and non-party days at the Magic Kingdom between now and December 22nd.
I know this “go to the Magic Kingdom on a party day” thing is totally my number one soap box. But let’s look at the practical implications of the difference between crowds on December 4th (party day, crowd level 2) and December 5th (non-party day, crowd level 8). The Magic Kingdom was open to non-party guests for 10 hours on the 4th and for 14 hours on the 5th. 4 hours is a lot of additional time – I won’t argue about that. But let’s take our 13 attractions that contribute to the crowd calendar predictions at Magic Kingdom.
If we go back and make optimized touring plans for those 13 attractions on each day, based on actual wait times that we saw on those days, you would have waited in line for 243 minutes (about 4 hours – leaving plenty of time for meals, bathroom breaks, and non-headliners) on the party day. That’s significantly less than an average wait time of 20 minutes per attraction. On the non-party day, an optimized touring plan still would have required 651 minutes of waiting (almost 11 hours, or an average of 50 minutes per attraction). So the park stays open 4 hours longer, but you’re spending SEVEN more hours in line than you would on the party day. You’ve totally eaten up your extra time, plus an additional 3 hours. And that’s with a “hindsight is 20/20” magically perfect touring plan. If staying late and seeing fireworks is worth over 400 minutes of additional waiting throughout the day … then so be it, but I’ve done my job by telling you the math. Ha!

Each week, I’m giving you a very transparent look into how our crowd level predictions performed. Each day at each park is one data point, so we have 28 different crowd level predictions to evaluate each week. Any time a prediction is within one or two crowd levels, things won’t really “feel” much different than what we predicted. Being off by 3 or more crowd levels is where we’d like to be more accurate because you might feel that difference in wait times throughout the day.
In the past week, our predictions were either spot-on or within 1 crowd level 71% of the time. This is down ever-so-slightly from last week, but still very accurate. 96% of the time we were within 2 crowd levels, and that means we earn an A for our predictions these past two weeks. This is a new all-time high!
Attraction Downtime 11/29 – 12/5
If we average out all of the capacity lost due to unexpected downtime over the past two weeks, it comes out to 3.3% of attractions unexpectedly being down. This is finally back down closer to a historical average, after a really difficult November. The park with the biggest issues was Hollywood Studios, with 5% of capacity its lost due to unexpected downtime. This is better than Magic Kingdom last week, which had 5.4% downtime. Things are trending better!
We have a tie for worst day for attraction downtime in the past week – and it happened on November 29th and December 1st. On those day, 5% of all capacity at WDW was lost due to unexpected downtime. The single worst park-day of the week was also on November 29th, at Hollywood Studios. On that day, 15% of the the capacity at that park was lost due to unexpected downtime. Hollywood Studios was open for 12.5 hours on that day since it was a party day, so 15% downtime is the equivalent of the whole park being down for almost 2 hours out of those 12.5 hours. Somehow, all of this downtime didn’t seem to have much of an impact on crowd level, which ended up being a reasonable 6.
Attraction Downtime

The worst offender was Tower of Terror, which was unexpectedly down for approximately 17% of the week. Its worst day was easily November 29th, when it was unavailable for 89% of the entire park day. We’ve been seeing increased downtime and incredibly high wait times from Tower Terror for the past couple of weeks, and that’s because one of the two elevator shafts is currently down. This happened earlier this year for planned maintenance, but it seems … ill-advised for Disney to cut capacity in half for this attraction during the busy holiday period. So this is probably just unfortunate lengthy downtime. Since the attraction is now fully dependent on half of its capacity, that means wait times will balloon, the ride will completely close when the one remaining shaft goes down, and Genie+ capacity will go down.
Rope Drop Downtime
Here are this week’s problematic offenders:
- Magic Kingdom: Pirates of the Caribbean (unavailable for 50% of its first hour of the day), Splash Mountain (unavailable for 25% of its first hour of the day), Seven Dwarfs Mine Train (unavailable for 20% of its first hour of the day), The Many Adventures of Winnie the Pooh (unavailable for 17% of its first hour of the day)
- EPCOT: Test Track (unavailable for 21% of its first hour of the day)
- Hollywood Studios: Tower of Terror (unavailable for 34% of its first hour of the day), Runaway Railway (unavailable for 19% of its first hour of the day), Rise of the Resistance (unavailable for 17% of its first hour of the day)
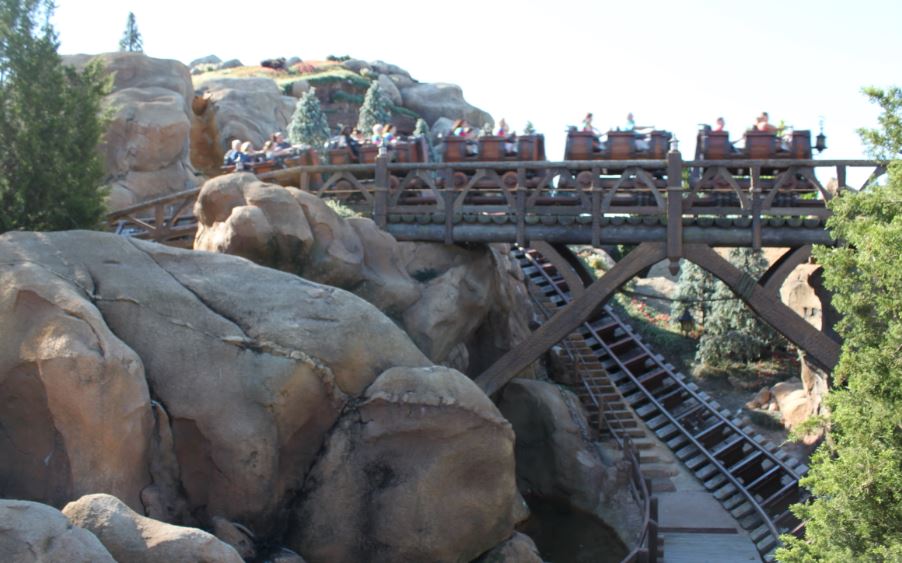
- Animal Kingdom: Expedition Everest (unavailable for 23% of its first hour of the day)
It’s an interesting week for downtime early in the day. Thankfully, Big Thunder Mountain got slightly more reliable and can be a decent first choice for “regular” rope drop if you don’t have early entry at Magic Kingdom. Unfortunately, Seven Dwarfs Mine Train makes it back to unreliable status. It had kept itself off the list for several weeks now. But I still recommend heading to Peter Pan’s Flight first, and then seeing if Seven Dwarfs Mine Train is open. Rise of the Resistance has also had a good run the past few weeks, but now is back to a slight concern during rope drop. If Rise is down when you arrive, head to Slinky Dog Dash instead.
Wait Times 11/29 – 12/5
Attractions with the Highest Average Wait at each park
- Hollywood Studios: Tower of Terror, average posted wait of 86 minutes (111 minutes last week)
- Animal Kingdom: Flight of Passage, average posted wait time of 92 minutes (123 last week)
- EPCOT: Remy’s Ratatouille Adventure, average posted wait time of 69 minutes (92 last week)
- Magic Kingdom: Seven Dwarfs Mine Train, average posted wait time of 61 minutes (81 last week)
If you could just have a picture of what these numbers mean, it would be a big sigh of relief. We’re seeing very significant decreases in average posted wait times across the board, and that’s definitely noticeable for all of these high-wait-time attractions. Average posted wait time was 31 minutes lower for Flight of Passage, 25 minutes lower for Tower of Terror, 23 minutes lower for Remy, and 20 minutes lower for Seven Dwarfs Mine Train.

Parks with the Highest and Lowest Average Wait
These parks likely won’t change week-to-week unless something ridiculous happens, but these data points will give us a high-level view of how wait times are trending from week to week.
- Highest: Hollywood Studios, average park-wide posted wait of 43 minutes (last week 51 minutes)
- Lowest: Magic Kingdom, average park-wide posted wait of 22.5 minutes (last week 29 minutes)
Thanks to those lower-crowd party days, Magic Kingdom continues to have the lowest average wait times. And having more party days compared to Thanksgiving Week means a much lower average. Those 6.5 minutes at every attraction adds up quickly throughout the day. And Hollywood Studios saw an even bigger drop – 8 minutes per attraction is a big deal.
Most Inflated Posted Wait Times
We all know that Disney inflates their posted wait times on purpose. They have many reasons for doing this. Some are totally understandable, and some are potentially more problematic. We can figure out how much posted wait times are being inflated by comparing submitted actual wait times from the Lines App and the posted wait time when the person timing their wait entered the line.
From November 29th through December 5th, actual wait times in the Lines App averaged 67% of what was posted. So if the posted wait time was 20 minutes, you could’ve expected to wait just about 13.5 minutes instead.
But the worst offender for the week was Buzz Lightyear’s Space Ranger Spin. At this one attraction, submitted actual wait times were 39% of posted wait times. A new weekly low! Not a record an attraction should want to hold. That means if Buzz Lightyear’s Space Ranger Spin had a 30 minute posted wait, you probably would’ve waited less than 12 minutes. Much less than half of what was posted. Remember to always check the Lines app for predicted actual waits instead of believing what is posted.

Looking Ahead: December 6th through December 12th
Since it takes time to pull data and write a post, you’ll be reading this on the 7th when the 6th is already in the past. But we’re staying as close to real-time as possible.
We’re in peak party season at the Magic Kingdom, which means that the next 7 days have 4 parties. Party days are the 6th, 8th, 9th and 11th. That means the 7th and the 10th are going to have especially ugly crowds at Magic Kingdom.
Otherwise, expect crowds to continue a slow and steady upward trend as we head to the all-crazy week of Christmas and the end of 2023. I’d expect more of the 6-7 range next week, and the 8-9 range the week after that. We’ll see if crowds descend early because they’re ready to celebrate, or if increasing respiratory illnesses keep families away. I suspect that those two factors will balance each other out.
You May Also Like...
-

Happy November! This change of month means that it is officially holiday season at Walt Disney World. Decorations are up, the…
-

New blog series, who dis? We know that you come to TouringPlans because of all of our data. And other than…
-

Holy crowds, Batman! Spiderman? Fall is here, and so are the beginnings of October crowds, ramping up into the holiday seasons…
-

How did park closures and airport shakeups impact crowds in the parks in the past week? And what can we expect…