Disney Data Dump July 23 2025
We’ve officially crossed the threshold into the “Starlight Summer” era … and so far, it’s more sparkle than surge. The parade debuted. Test Track reopened. But the crowd levels? Still pretty chill. There are a few signs of life! Hollywood Studios is creeping back into moderate territory instead of its rock-bottom summer. But we’re not seeing any big mid-summer swell. Let’s dig into the numbers to see what’s real, what’s rumor, and what’s just a bunch of locals camping out for parade curb space.
Observed Crowd Levels July 15 – 21
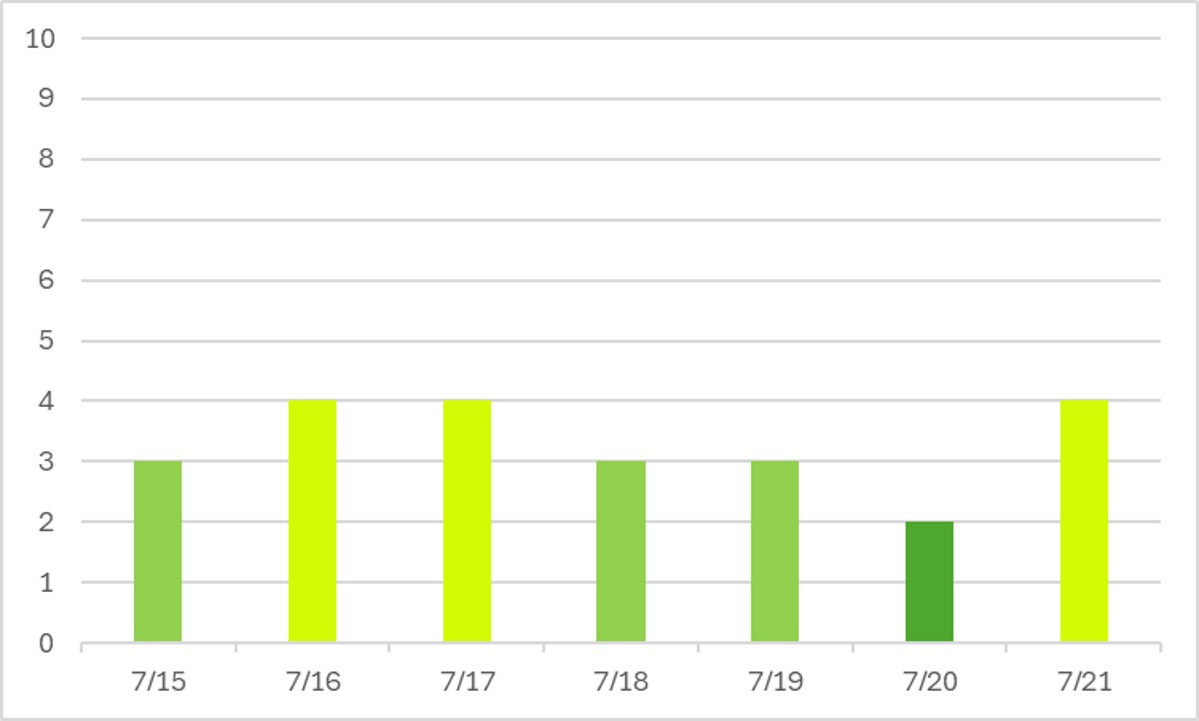
Aw, look at that gorgeous Starlight Summer Surge that I predicted last week! Is jokes. Hasn’t happened yet. But we are seeing more 3s and 4s, and fewer 1s and 2s compared to earlier in July. Sundays are always the lowest wait times of the week (this isn’t a new thing, or even a summer-specific thing), so that day specifically doesn’t mean that the debut of Starlight wasn’t successful or crowded. More about that below!
This is your friendly reminder that crowd levels are a representation of wait times during peak hours – generally, 11 am to 5 pm. Why is that important? You could look at crowd level 1 or 2 for Magic Kingdom on the 20th and 21st and think “oh boy, no one is going to watch the parade anyway, so it’s not crowded.” And that is lies. If locals are showing up for just the parade, they may not arrive to the park after 5 pm anyway. And all of those people wanting to see the parade aren’t in line for attractions. Instead, they’re congesting the parade route. So don’t be fooled – the parade is very very popular, and crowded. But it doesn’t have posted wait times, so you’re not going to see that reflected in the crowd levels.
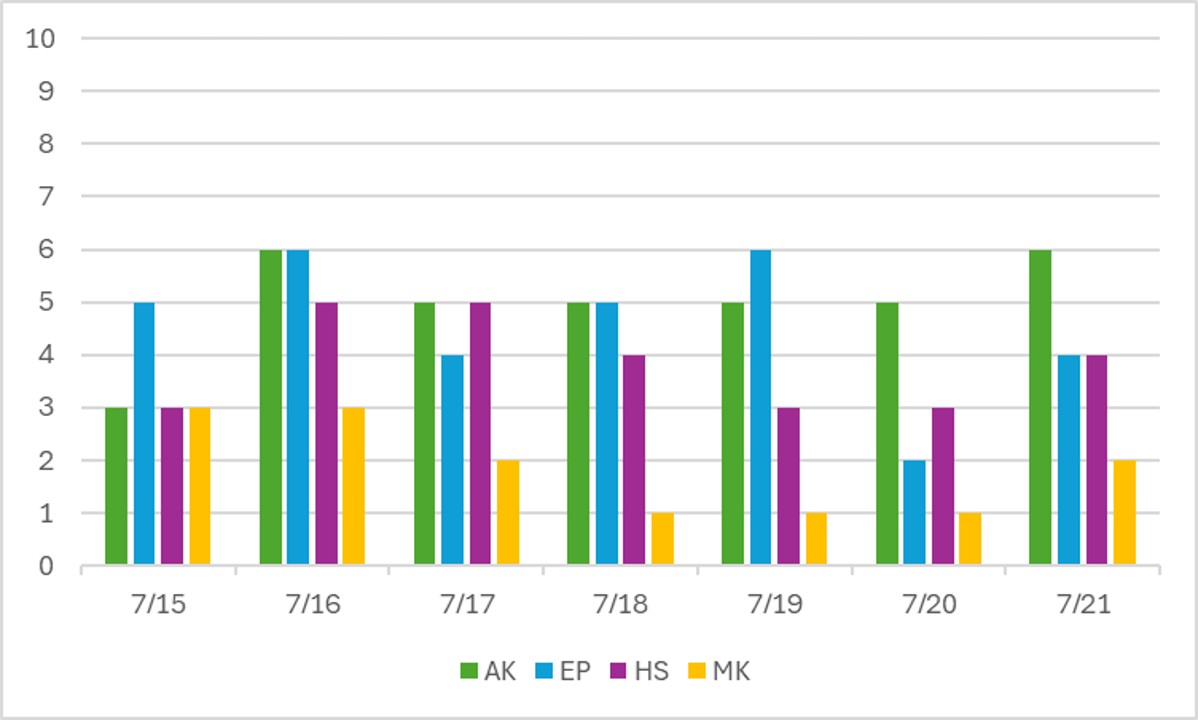
The “big” news here is Hollywood Studios bouncing back up to see some crowd level 4 and 5 days in the past week. It had been hovering in the 2-3 range for most of the summer, so there’s where we can see some of the later summer visitors starting to populate the parks.
Performance of Crowd Level Predictions
Each week, I give you a very transparent look into how the TouringPlans crowd level predictions performed. Each day at each park is one data point, so each week we have 28 different crowd level predictions to evaluate. Any time a prediction is within one or two crowd levels, things won’t really “feel” much different than what was predicted. Being off by 3 or more crowd levels is where you might feel that difference in wait times throughout the day.
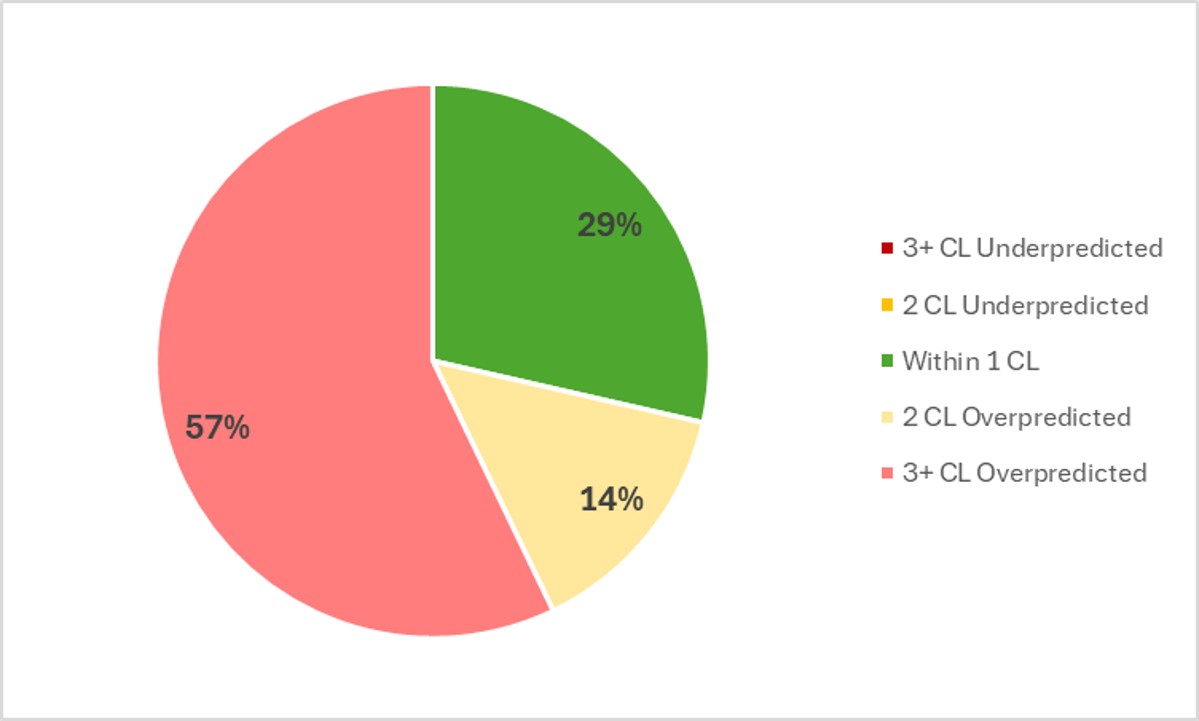
In the past week, Touring Plans predictions were either spot-on or within 1 crowd level 29% of the time. 43% of the time Touring Plans predictions were within 2 crowd levels, so that means we get an F for our predictions in the past week. But it’s still trending to a higher F! All misses were over-predictions, meaning that crowds came in lower than expected throughout the past week. On average, the crowd level at any park any day of the week was about 2.5 crowd levels below prediction. That means crowds were once again significantly, noticeably, below what was predicted. But for those of you who are going to run to the comments and ask about when the crowd calendar will finally be updated to account for these new trends, the answer is .. today! Fred will be posting all about that. The biggest miss of the week was an overprediction by 5 crowd levels, which happened at Hollywood Studios on July 15th. This is the 7th overprediction by 5 crowd levels for Hollywood Studios in just the first half of July. Wowzers.
Attraction Downtime July 15 – 21
If we average all of the capacity lost due to unexpected downtime over the past week, it comes out to 3.8% of attractions unexpectedly being down. Thankfully, that’s back down closer to our historical average for the summer. In the past week, Magic Kingdom was the park with the most overall downtime, averaging 4.7% of its capacity lost to downtime throughout the week.
The worst day for attraction downtime in the past week was on July 16th. On that day, 5% of all capacity at WDW was lost due to unexpected downtime. The worst park-day of the week was on July 16th at Animal Kingdom. On that day, 11% of attraction capacity was lost due to unexpected downtime. Animal Kingdom was open for 10 hours on the 16th, so 11% downtime is the equivalent of the entire park shutting down for 66 minutes.
Attraction Downtime Worst Offender
In the past week, Astro Orbiter was the WDW attraction with the worst overall downtime. It was unexpectedly down for 22% of the past week. That’s the second “win” in a row for Astro Orbiter, which literally just came back from an extended refurbishment. That’s a little worrying. The worst day at Astro Orbiter was on July 15th, when the attraction was down for 99% of the day. It actually went down mid-day on the 13th and didn’t come back up until midday on the 16th. Since then, it’s only had a few minor breakdowns.

Rope Drop Downtime
Here are problematic offenders from the past week, with the percentage of downtime during the first hour of the day in parentheses:
- Magic Kingdom: Astro Orbiter (27%), Tiana’s Bayou Adventure (20%), Seven Dwarfs Mine Train (14%), Barnstormer (13%), Space Mountain (13%), Mad Tea Party (13%)
- EPCOT: Cosmic Rewind (36%), Remy’s Ratatouille Adventure (18%), Frozen Ever After (14%)
- Hollywood Studios: Slinky Dog Dash (24%), Rock’n’Roller Coaster (14%)
- Animal Kingdom: Expedition Everest (15%)
That’s a bad rope drop week, especially for our friends who were touring EPCOT. At least the good news is that Test Track is now open in case the other three rope drop pulls are all broken? Ah, who are we kidding, I bet Test Track will be on this list soon too 😉
No gold stars this week for any park.
Wait Times July 15 – 21
Attractions with the Highest Average Posted Wait at Each Park
- EPCOT: Cosmic Rewind, average posted wait of 72 minutes (was 74 minutes last week)
- Hollywood Studios: Slinky Dog Dash, average posted wait of 67 minutes (was 63 minutes last week)
- Magic Kingdom: TRON, average posted wait time of 65 minutes (was 66 minutes last week)
- Animal Kingdom: Flight of Passage, average posted wait time of 61 minutes (was 70 minutes last week)
A couple of things are notable, here. Flight of Passage dropped to the bottom of the list of headliners, thanks to Animal Kingdom as a whole having fewer downtime issues this week. Slinky, on the other hand, was the only attraction that saw an increase in its average posted wait, and quite a bit of that was due to rope drop downtime issues that led to high posted waits as soon as it opened.
Parks with the Highest and Lowest Average Wait
These parks likely won’t change week-to-week unless something ridiculous happens, but these data points will give us a high-level view of how wait times are trending from week to week.
- Highest: Animal Kingdom, average park-wide posted wait of 33 minutes (was 35 minutes last week)
- Lowest: Magic Kingdom, average park-wide posted wait of 20 minutes (was 21 minutes last week)
This is still the least-crowded month we’ve seen since the pandemic era. Go take advantage of it if you can!
Most Inflated Posted Wait Times
We all know that Disney inflates their posted wait times on purpose. They have many reasons for doing this. Some are totally understandable, and some are potentially more problematic. We can figure out how much posted wait times are being inflated by comparing submitted actual wait times from the Lines App and the posted wait time when the person timing their wait entered the line.
Over the past week, actual wait times in the Lines App averaged 68% of what was posted. That’s pretty average for the Genie+ era, and back to our new normal average for the LLMP era. Overall, if the posted wait time at a popular attraction was 60 minutes, you could’ve expected to wait less than 41 minutes instead.
But the worst offender for the past week was Navi River Journey. At this one attraction, submitted actual wait times were only 44% of posted wait times in the past week. That means that if Navi River Journey had a 45 minute posted wait, you probably would have actually only waited less than 20 minutes instead. Less than half of what was posted. Remember to always check the Lines app for predicted actual waits instead of making decisions based on what is posted.

This Week’s Wait Time Rock Star
Between July 15th and 21st, we had over 1100 timed actual waits submitted through the Lines app. The one person who recorded the most actual waits during that time was adamstl4, with 30 overall timed waits – and it was in hard mode, with all standby waits. Thanks for all of that timing, adamstl4! It unfortunately does not compete with the the 97 timed waits in a single week from our current timing champion, preef.
Looking Ahead: July 22 – 28
I write this article on Tuesday evenings so that you all have the very freshest of data on Wednesdays. That means the 15th will already be in the past by the time you’ve read this, so welcome to the future!
Starlight has debuted! Test Track is open! Summer is finally in full swing at Walt Disney World. But so far that doesn’t mean the crowds have arrived to take advantage of the new parade or refreshed EPCOT headliner. I think things will still get up closer to the moderate range for the remainder of summer, but don’t expect the parks to be hopping again until the fall when temperatures cool off. No big news for park schedules other than Magic Kingdom regularly staying open later to accommodate Starlight.
As for the weather, it’s summer. Be prepared for the heat and the rain. Stay hydrated … and dry?
Bonus Content: Unofficial Guide Giveaway
Last week I offered a giveaway of the new, not-yet-published 2026 edition of the Unoffiicial Guide to Walt Disney World, in exchange for helpful reviews of dining locations, attractions, and resorts! You all didn’t let me down. And after inputting all of the entries into a random generator, the winner is Katie Sterczala. Congratulations, Katie!

Were you in the parks this past week? Or are you headed to Orlando soon? Let me know in the comments below!
You May Also Like...
-

For the first time ever, this week’s Data Dump comes to you from the back porch of Jambo House, with giraffes…
-

Spring Break crowds are officially behind us, and the parks are settling into their pre-summer rhythm. This past week marked what…