Disney Data Dump May 31 2023
Welcome to summer! All of the signs point to it being summer. Daily afternoon thunderstorms in Orlando, pools open across the country, school days consisting solely of movies and recess. And we just had a 3-day weekend, which always results in large crowds descending upon the parks to celebrate. But that doesn’t mean that the crowd levels at Walt Disney World look like summer just yet. Instead, Memorial Day only provided a slight bump up in crowds that was already quickly erased by Monday.
Observed Crowd Levels 5/23 – 5/29

Oh, hi, Memorial Day weekend! See that HUGE CRUSH of crowds that made things not-green? That’s the holiday weekend. I know, I know. Crowd levels of 5 and 6. Pretty crowded and miserable, right? Sarcasm! It’s all sarcasm. Last year, the Sat/Sun/Mon of Memorial Day weekend had crowd levels of 6/7/7. This year it was 5/6/4. Those crowd levels point to a nice influx of locals on Friday, Saturday, and Sunday and then a potential return to the lower crowds we’ve been seeing in May. We’ll see how this develops in the coming weeks as we hit more of the summer stride.

At least we’ve someone returned to normalcy with Hollywood Studios having the highest crowd levels out of any of the parks – and this is with Rock’n’Roller Coaster having a soft reopening that absorbed some of the crowds. The drop at Magic Kingdom on the 29th is especially interesting, especially considering that Mondays are generally pretty popular at Magic Kingdom.

Each week, I’m giving you a very transparent look into how our crowd level predictions performed. Each day at each park is one data point, so this week we have 28 different crowd level predictions to evaluate each week. Any time a prediction is within one or two crowd levels, things won’t really “feel” much different than what we predicted. Being off by 3 or more crowd levels is where we’d like to be more accurate because you might feel that difference in wait times throughout the day.
This continues to be ugly. It’s a little less ugly than the last two weeks though! In the past week, Touring Plans predictions were either spot-on or within 1 crowd level 39% of the time. That’s quite a bit above our all-time low of 21% the past two weeks. 60% of the time Touring Plans predictions were within 2 crowd levels, and that means we earn a D- for our predictions this past week. Same as last week. Predictions were, once again (broken record), just about as skewed as possible this week. We had only a single-park day that was under-estimated – on May 26th, Magic Kingdom was predicted to be a 4 and ended up being a 5. The biggest miss of the past week over-predicted crowds by 5 crowd levels. That happened on May 29th (Memorial Day) at Hollywood Studios, when Touring Plans predicted crowd level 10, and it ended up being a crowd level 5 day.
Attraction Downtime 5/23 – 5/29
If we average out all of the capacity lost due to unexpected downtime over the past week, it comes out to 3.9% of attractions unexpectedly being down. Slightly down from last week! The park with the biggest issues was Hollywood Studios, with 4% of its capacity lost due to unexpected downtime. If you can do math, that means a lot of the parks were pretty tightly packed around that 3.9% number.
The worst day for attraction downtime in the past week was on May 22rd. On that day, 7% of all capacity at WDW was lost due to unexpected downtime. The worst park-day of the week was at Hollywood Studios on May 23rd. On that park day, 9% of the capacity at the park was lost due to unexpected downtime. Hollywood Studios was open for 13 hours on the 23rd, so 9% downtime is the equivalent of the whole park being down for over 70 minutes. Boo.
Attraction Downtime
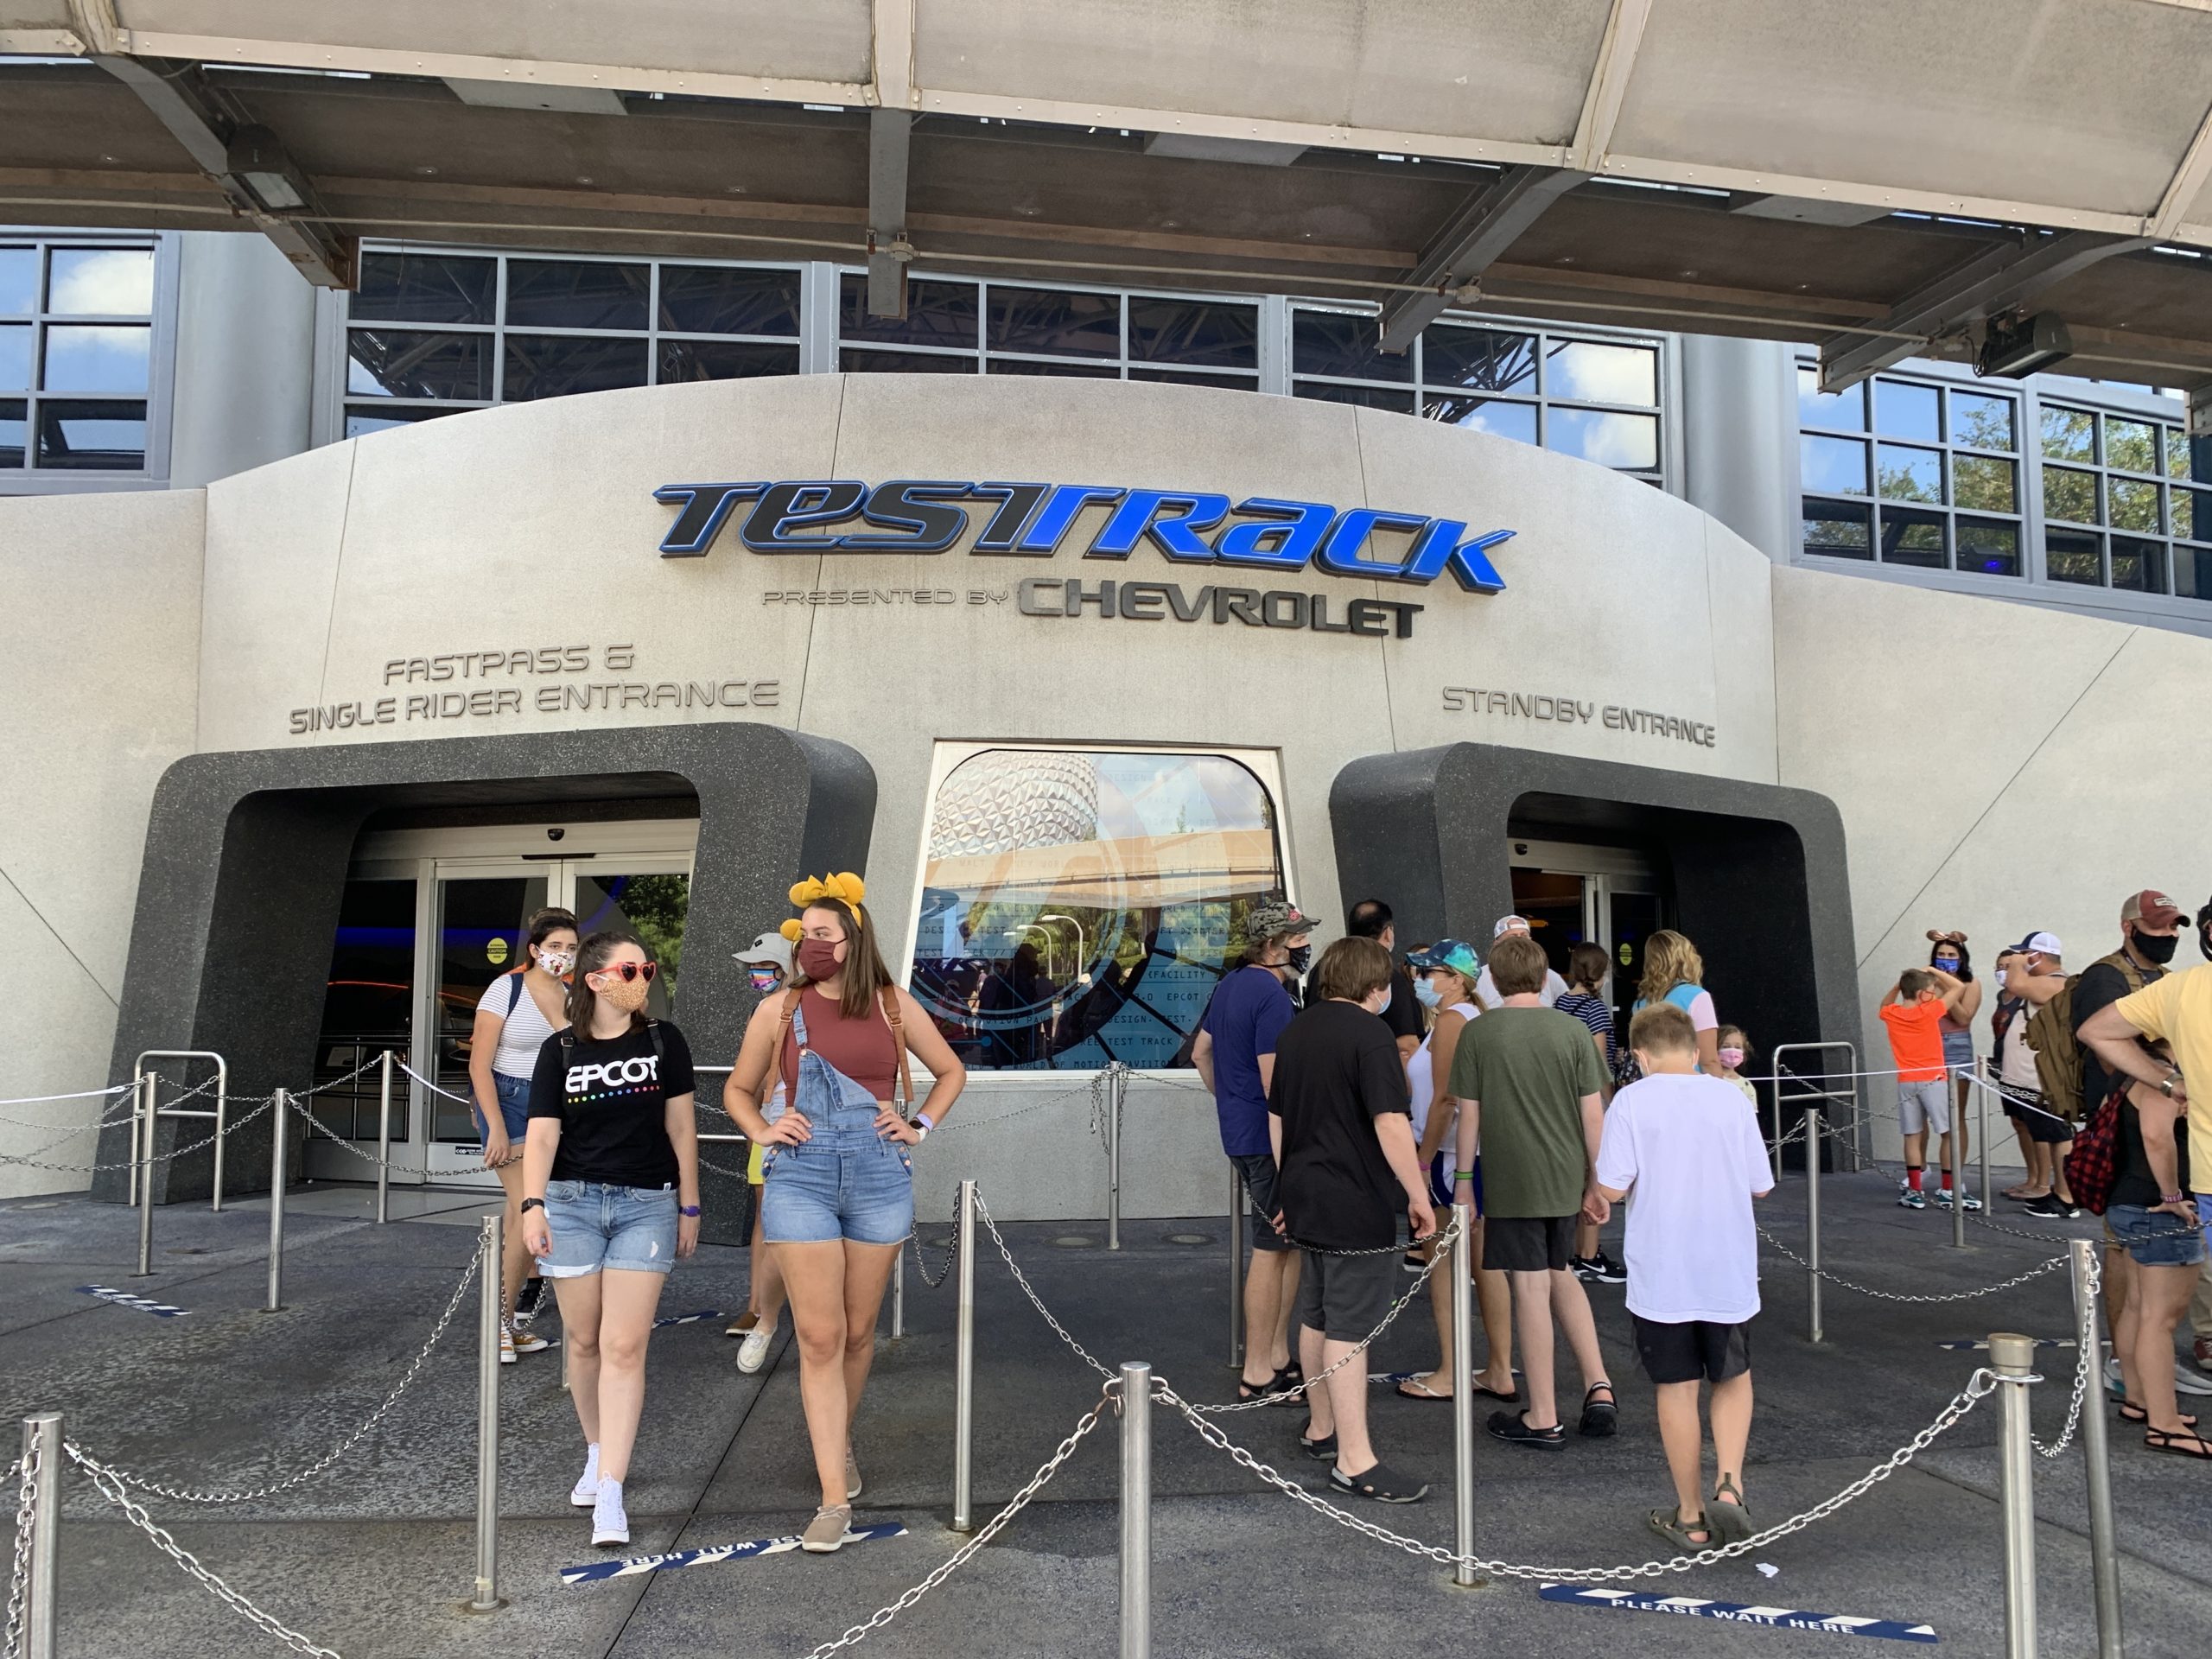
The worst offender of the past week is NOT Magic Carpets of Aladdin! Gasp! Instead, it was Test Track, which was unexpectedly down for approximately 14% of the past week. Seems like a breeze after Magic Carpets being down for 38%, 38%, 58% and 68% of the previous 4 weeks. The worst day for our the Carpets was on May 28th, when it was unexpectedly down for 29% of the day. Expect to see Test Track showing up more here as afternoon storms keep popping up in the hot summer weather.
Rope Drop Downtime
Here are this week’s problematic offenders:
- Magic Kingdom: Haunted Mansion (unavailable for 26% of its first hour of the day), Peter Pan’s Flight (unavailable for 19% of its first hour of the day), Space Mountain (unavailable for 16% of its first hour of the day)
- EPCOT: No rope drop downtime issues!
- Hollywood Studios: Runaway Railway (unavailable for 18% of its first hour of the day)
- Animal Kingdom: No rope drop downtime issues!
Now that’s a good rope drop week. Sure, Peter Pan’s Flight is an excellent rope drop choice. But otherwise, rope drop should have been a cake walk this week. Most of the downtime in the parks during the past 7 days was due to afternoon thunderstorms, and not at rope drop.

Wait Times 5/23 – 5/29
Attractions with the Highest Average Posted Wait at each park
- Hollywood Studios: Slinky Dog Dash, average posted wait of 77 minutes (63 minutes last week)
- Animal Kingdom: Flight of Passage, average posted wait time of 87 minutes (73 minutes last week)
- EPCOT: Frozen Ever After, average posted wait time of 61 minutes (57 minutes last week)
- Magic Kingdom: Seven Dwarfs Mine Train, average posted wait time of 74 minutes (63 minutes last week)
Wait times back up! But even the very highest posted average (at Flight of Passage) isn’t up to 90 minutes. This is still nice and low and should go up in the coming weeks, even with Memorial Day weekend being included in the past 7 days.
Parks with the Highest and Lowest Average Wait
These parks likely won’t change week-to-week unless something ridiculous happens, but these data points will give us a high-level view of how wait times are trending from week to week.
- Highest: Hollywood Studios, average park-wide posted wait of 35 minutes (29.5 minutes last week)
- Lowest: EPCOT, average park-wide posted wait of 23 minutes (21.5 minutes last week)
Hollywood Studios is finally back to an average posted wait time above half an hour. But all of the other parks stayed relatively low, with minor increases in their average posted wait time. Really the only bump here came from the Memorial Day semi-crowds.
Most Inflated Posted Wait Times
We all know that Disney inflates their posted wait times on purpose. They have many reasons for doing this. Some are totally understandable, and some are potentially more problematic. We can figure out how much posted wait times are being inflated by comparing submitted actual wait times from the Lines App and the posted wait time when the person timing their wait entered the line.
Over the past week, actual wait times in the Lines App averaged 67% of what was posted. This is well above our historical average, which means – hey, posted wait times are not quite as inflated as usual. If the posted wait time was 60 minutes, you could’ve expected to wait just over 40 minutes instead.
But the worst offender for the past week is Journey Into Imagination. At this one attraction, submitted actual wait times were 52% of posted wait times in the past week. Holy moly! That means that if Journey Into Imagination had a 15 minute posted wait, you probably would’ve waited less than 8 minutes instead. Remember to always check the Lines app for predicted actual waits instead of believing what is posted.

Actual Wait Time Rock Star
The Actual Wait Time Rock Star for the past week was … tkyllmann, who submitted 39 actual wait times through the Lines App over the last 7 days! This includes 21 Lightning Lane waits, 16 Standby waits, and 2 virtual queue waits. Thank you for all of that timing, tkyllmann! You came pretty close to the all-time record of 50 recorded waits times in a single week, currently held by shop.kgb and ccsademko.
Looking Ahead: May 30th through June 5th
It takes some time to crunch all of the numbers, so when you’re reading this article, May 30th will already be in the past. But we’re trying to stay as timely as possible. So let’s get along with our future-casting.
Now that Memorial Day is in the past, more and more school districts are hitting summer break, which means more families ready for their summer vacations. This is unlikely to lead to a rapid increase in crowds, but our days of all green crowd levels are probably in the past until we get closer to the fall. Disney already pulled one of its summer promotions, so they suspect that things will be picking up enough that they don’t need to offer reasons to entice people to the parks.
Still, this week should stay low-to-moderate. Gay Days happens in the next 7 days, so this will lead to a slight bump in crowds at Animal Kingdom on the 1st, Hollywood Studios on the 2nd, Magic Kingdom on the 3rd, and EPCOT on the 4th. Otherwise, no events to drive more park visits.
What will have more of an impact is the weather. Lots of afternoon thunderstorms are in the forecast. That means downtime of some outdoor attractions, but it generally also means the filtering out of people that aren’t prepared for the weather. If you can handle the rain, you should have some shorter waits during and immediately after the downpours.
You May Also Like...
-

In the world of Disney Data, this week was all good news. Wait times were the lowest we've seen since mid-September…
-

Just when you think we've made it through Spring Break season! The weather is getting warmer. The kids are getting antsy…
-

Anyone else ready for summer? If nothing else, we need something to shake up these Disney Data Dumps that have become…
-

What a busy week we've all had! May the Fourth, Cinco de Mayo, Revenge of the Fifth. Also important holidays like…
Off topic, but , Becky- will you be having new touring plans for the parks on YouTube.? The one’s last year were really great, and greatly appreciated. But could always use a recent update.
Which summer promotion did Disney take away?
It was the “early summer” savings with 25% off select resort stays. It was announced in January and was supposed to cover stays through July 10th, but was no longer available as of about 5 days ago.