
Disney Data Dump April 5 2023
Just when you think we’ve made it through Spring Break season! The weather is getting warmer. The kids are getting antsy about being in school all day every day. But … it’s not even Easter! And we’re seeing some pretty clear signs that all of these weeks of overpredictions of Spring Break crowds really mean that folks have been waiting until this week to visit. Our string of crowd level 6s and 7s and 8s suddenly popped up to a 9 this week, and it will probably stay high for a while. Let’s see what the data tells us to expect.
Observed Crowd Levels 3/28 – 4/3
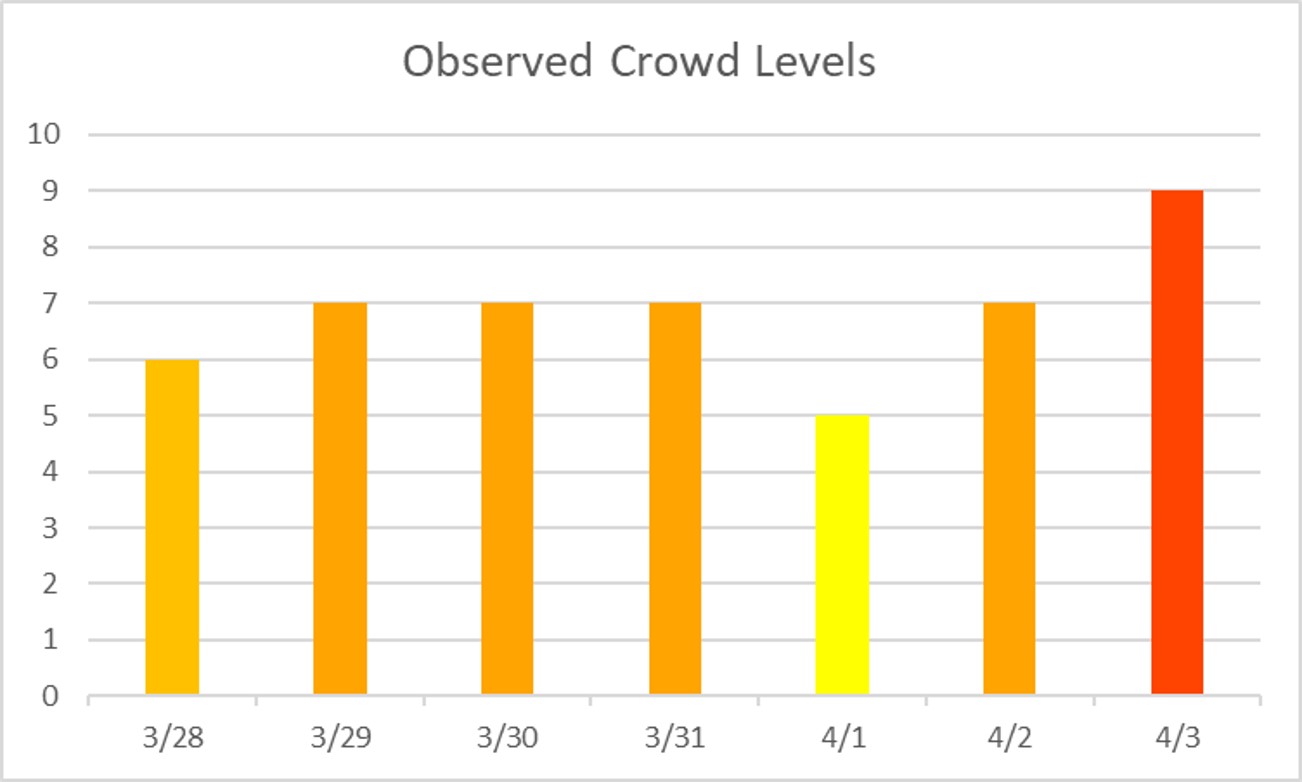
We’re finally seeing the tail-end of Spring Break season, but it’s determined to go out with a bang! Easter week is shaping up to be a crush of humanity in the WDW parks, and it’s just starting to show up on this chart. Here’s the big thing – April 3rd would have been a resort-wide crowd level 10 if it weren’t for Magic Kingdom yesterday. And while yesterday was the highly-anticipated return of Happily Ever After, that doesn’t necessarily impact wait times across the park. Beginning on the 4th, TRON will be officially open, and that will have an impact on wait times at the park. So that resort-wide crowd level 9 could get worse.

Each week, I’m giving you a very transparent look into how our crowd level predictions performed. Each day at each park is one data point, so this week we have 28 different crowd level predictions to evaluate each week. Any time a prediction is within one or two crowd levels, things won’t really “feel” much different than what we predicted. Being off by 3 or more crowd levels is where we’d like to be more accurate because you might feel that difference in wait times throughout the day.
So far this Spring Break Season, TouringPlans predictions have been generally over-estimating crowds, sometimes pretty significantly. The good news is that this week’s performance looks much better. The bad news is that this points to Easter week being much more crowded than expected. In the week, Touring Plans predictions were either spot-on or within 1 crowd level 79% of the time. This is close to an all-time high! 93% of the time Touring Plans predictions were within 2 crowd levels, and that means we earn an A- for our predictions this past week. The biggest miss of the week was on April 1st at EPCOT. On that day, crowds were 4 levels lower than expected.
Attraction Downtime 3/28 – 4/3
If we average out all of the capacity lost due to unexpected downtime over the past two weeks, it comes out to 3.1% of attractions unexpectedly being down. This is pretty typical downtime for really crowded times in the park. And the park with the biggest issues was Hollywood Studios, with 3.7% of its capacity lost due to unexpected downtime. This is once again one of the smallest “biggest” downtime numbers we’ve ever seen.
The worst day for attraction downtime in the past week was on April 3rd. On that day, 4% of all capacity at WDW was lost due to unexpected downtime. The worst park-days of the week were at Animal Kingdom on the April 1st, and at Hollywood Studios on March 29th. On those days, 8% of the capacity at each park was lost due to unexpected downtime. Animal Kingdom was open for 12 hours on the 1st, so 8% downtime is the equivalent of the whole park being down for almost an hour. Thankfully, this didn’t seem to have an impact on wait times and crowd levels, since Animal Kingdom was predicted to be an 6 and ended up being a 5. Hollywood Studios was open for 13 hours on the 29th, so 8% downtime there is the equivalent of the whole park being down for just over an hour. Once again, this may not have had an impact on wait times since Hollywood Studios came in at a crowd level 9, just as expected.
Attraction Downtime
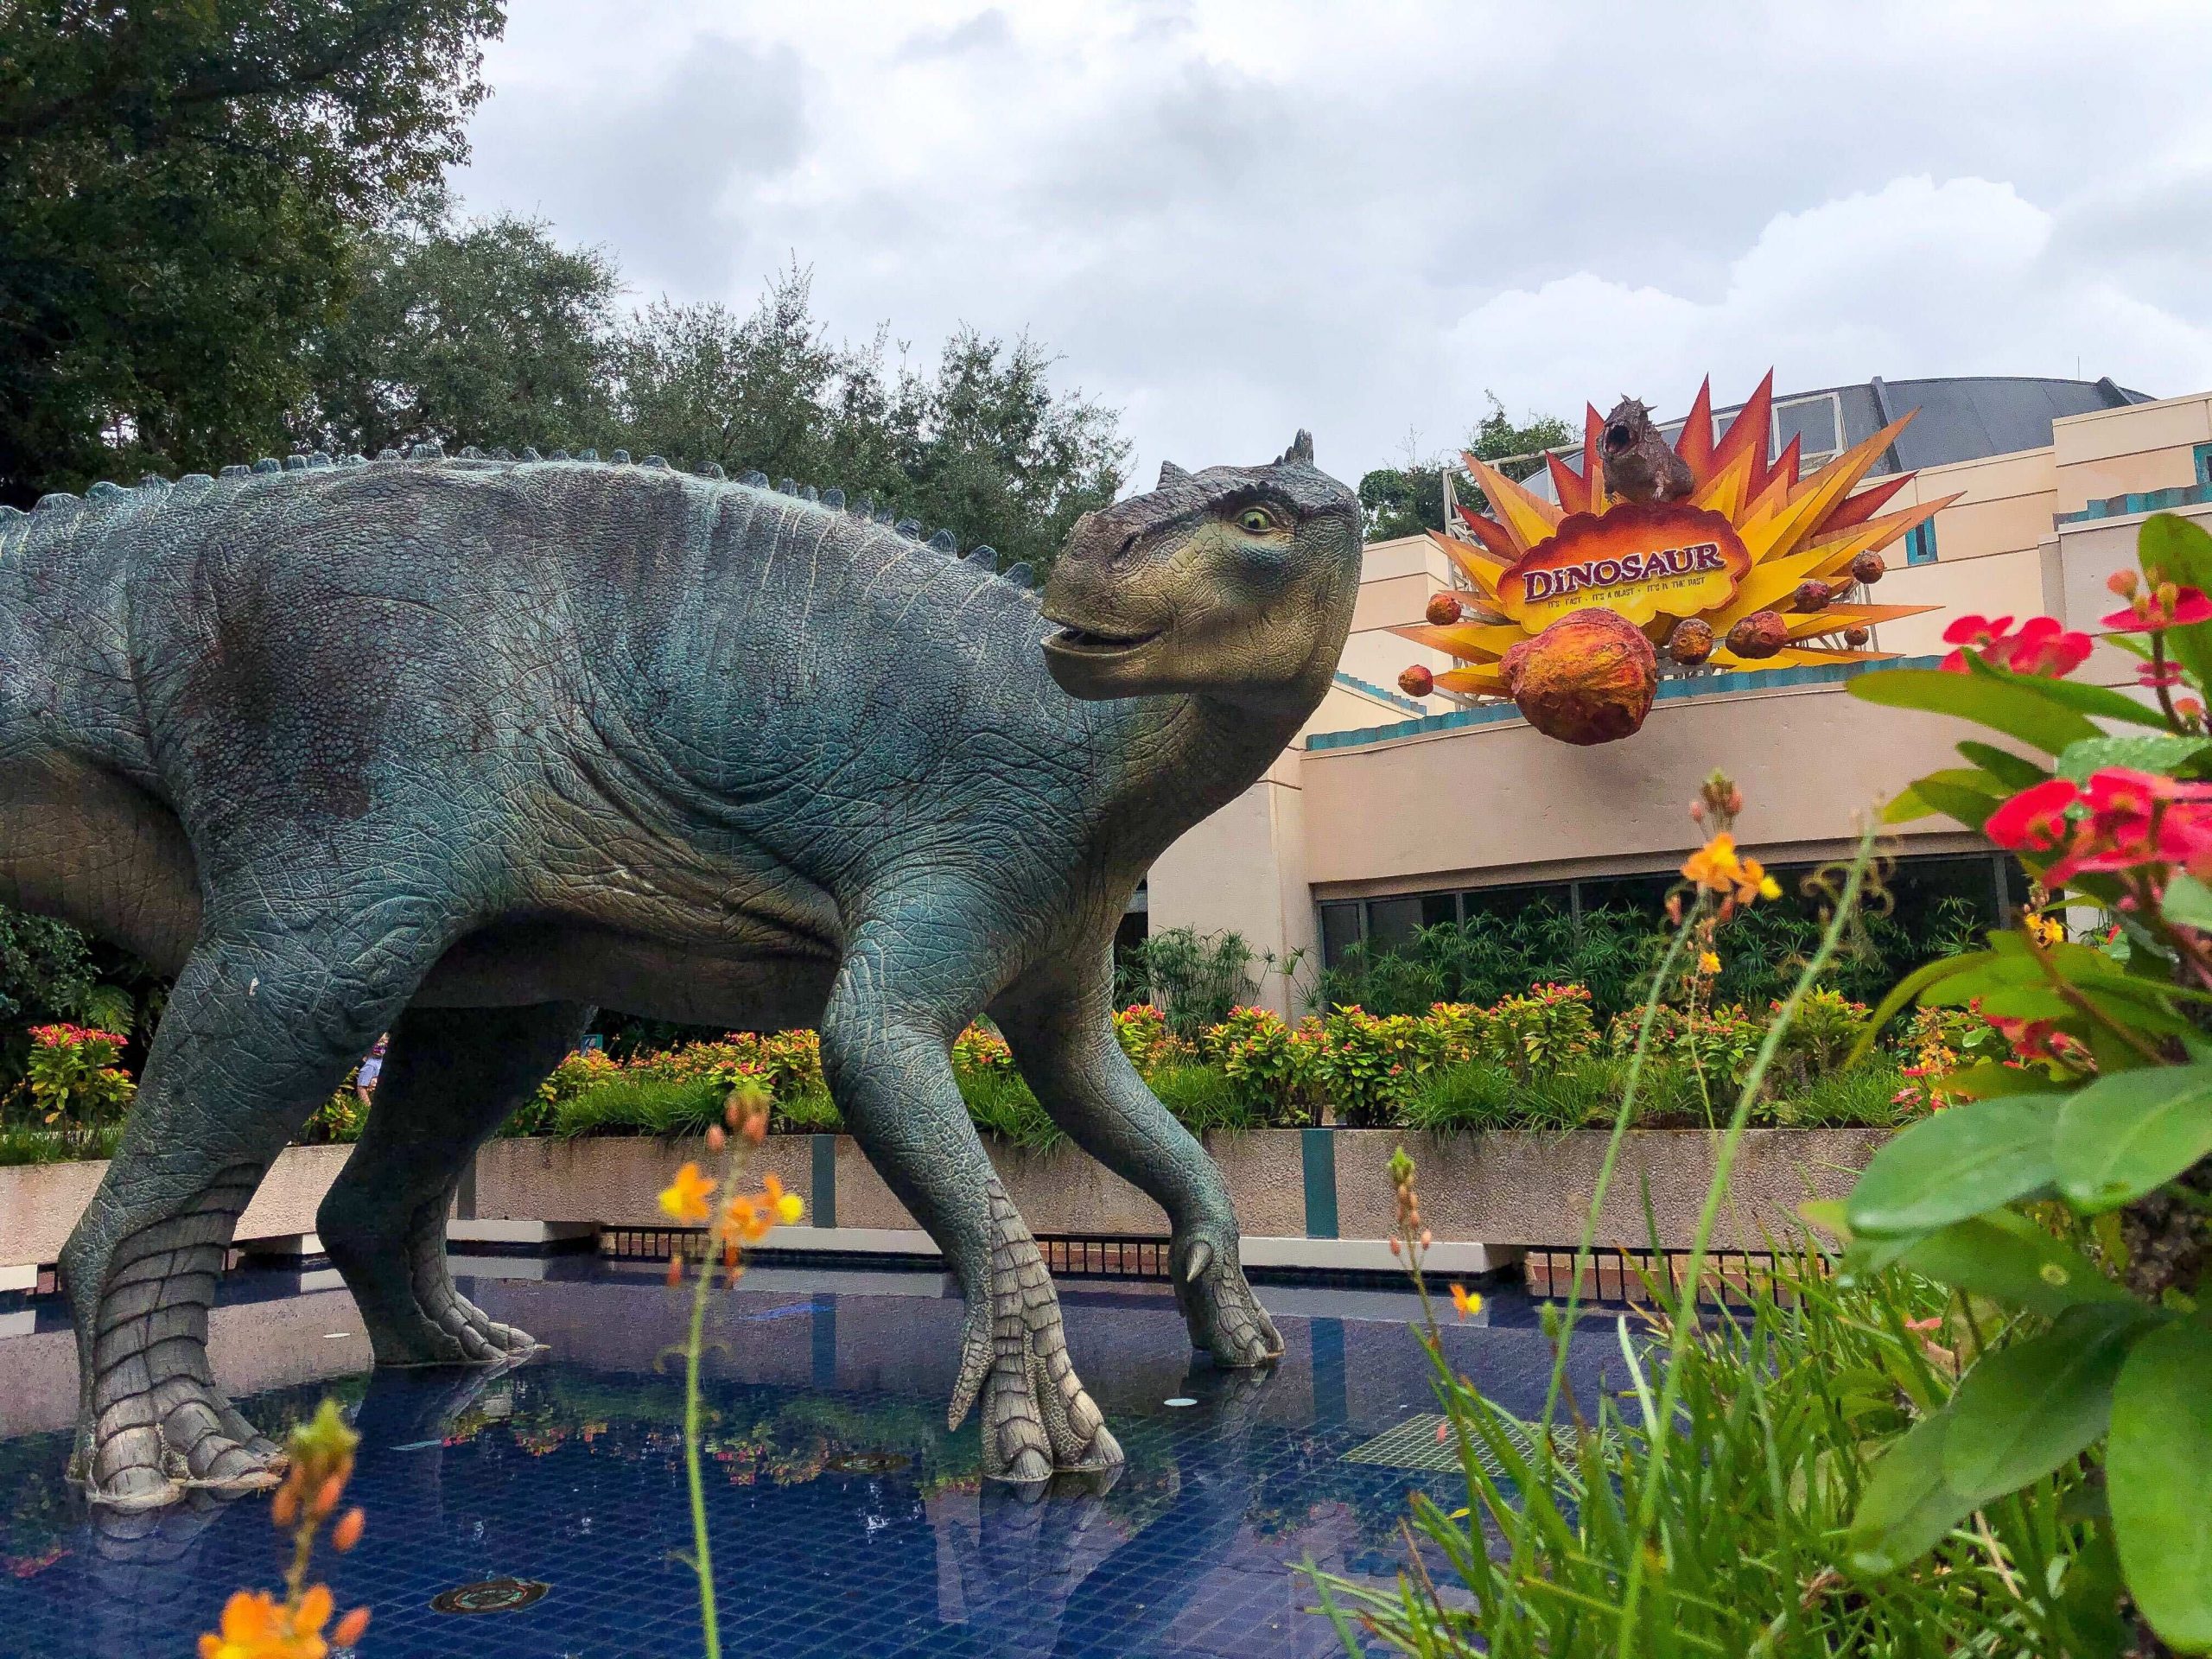
The worst offender of the past two weeks is a shared podium, with Rise of the Resistance and DINOSAUR, which were unexpectedly down for approximately 8.7% of the past two weeks. Rise is pretty expected at this point, but DINOSAUR is weird. Still … this is lowest “highest” downtime number we’ve seen since we started tracking this metric!
Rope Drop Downtime
Here are this week’s problematic offenders:
- Magic Kingdom: The Many Adventures of Winnie the Pooh (unavailable for 24% of its first hour of the day)
- EPCOT: Test Track (unavailable for 16% of its first hour of the day), Spaceship Earth (unavailable for 15% of its first hour of the day), Frozen Ever After (unavailable for 14% of its first hour of the day)
- Hollywood Studios: Rise of the Resistance (unavailable for 40% of its first hour of the day), Star Tours (unavailable for 17% of its first hour of the day), Runaway Railway (unavailable for 14% of its first hour of the day)
- Animal Kingdom: No rope drop downtime issues!
After having a stellar week last week, EPCOT is back on the rope drop naughty list this week. Test Track and Frozen Ever After both having significant rope drop downtime is very bad news, because it takes away 2/3 of the excellent rope drop options at that park. Rise of the Resistance being down for almost half of its first hour of the week is another huge deal. Thankfully, there are plenty of other wait-avoiding options at that park, and Slinky Dog Dash had good rope drop performance this week.
Wait Times 3/28 – 4/3
Attractions with the Highest Average Posted Wait at each park
- Hollywood Studios: Slinky Dog Dash, average posted wait of 109 minutes (106 minutes last week)
- Animal Kingdom: Flight of Passage, average posted wait time of 110 minutes (107 minutes last week)
- EPCOT: Remy’s Ratatouille Adventure, average posted wait time of 86 minutes (84 minutes last week)
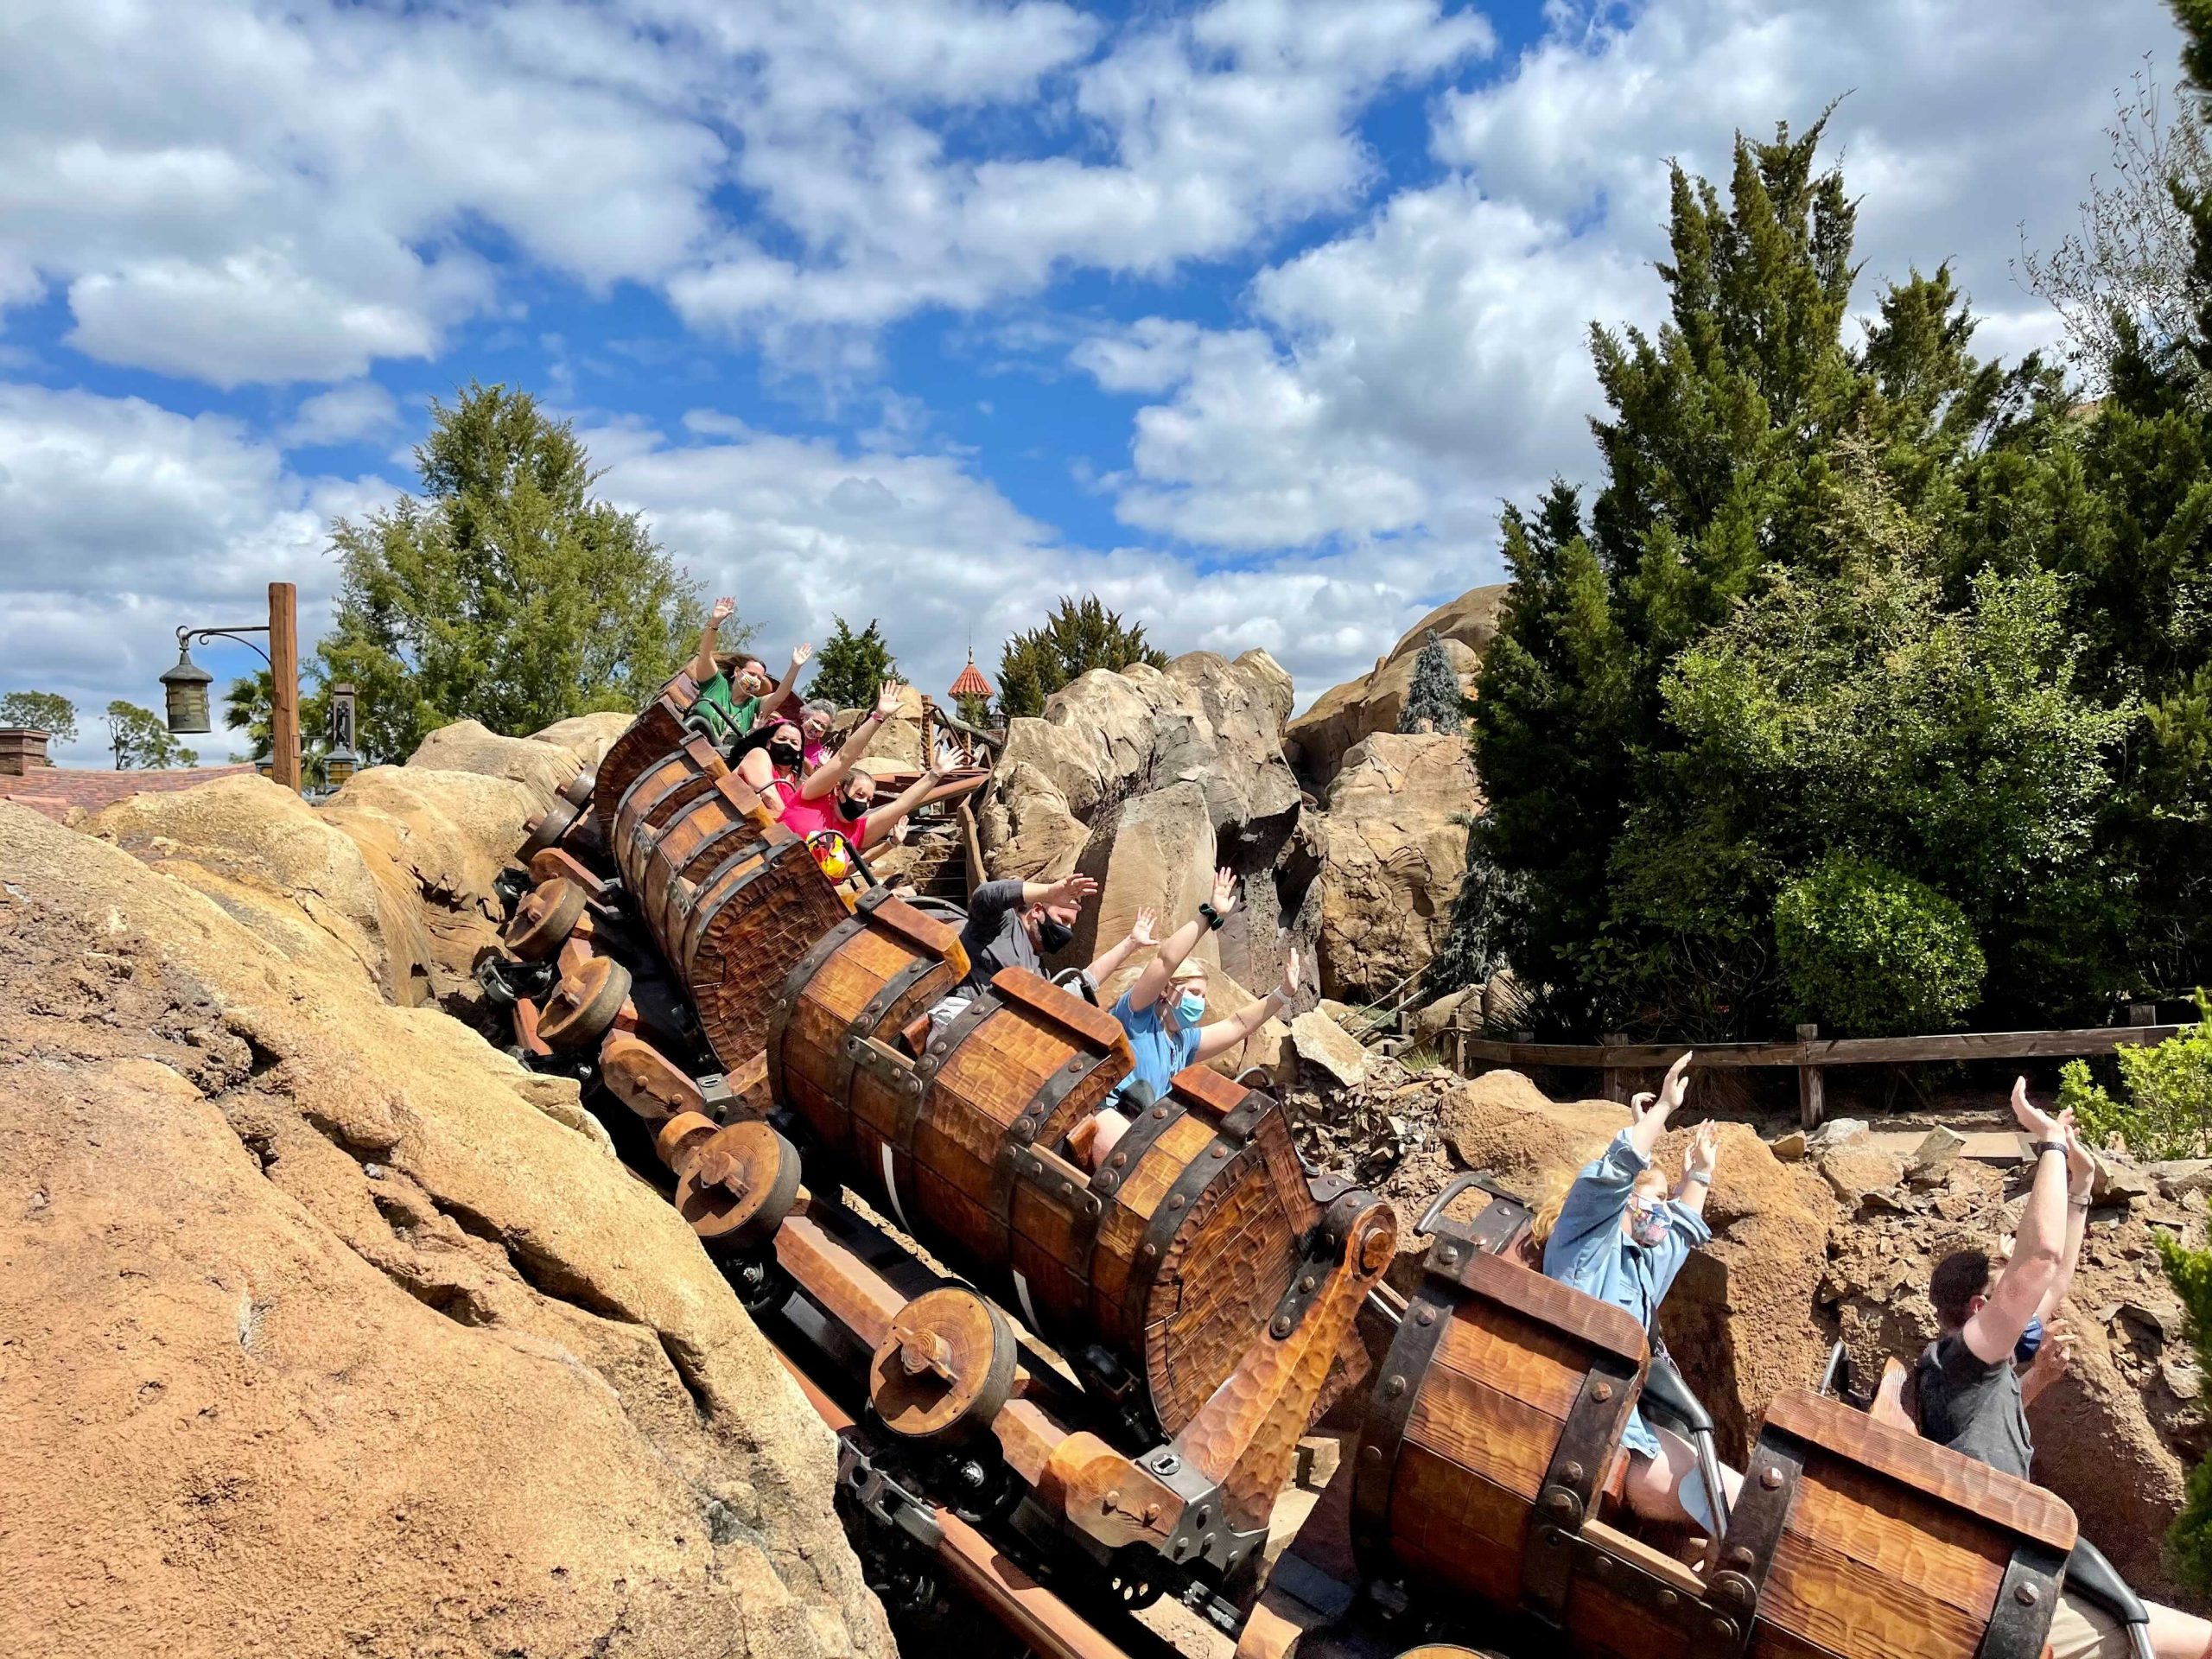
- Magic Kingdom: Seven Dwarfs Mine Train, average posted wait time of 89 minutes (90 minutes last week)
We’re seeing slight increases here over last week for the most part, but not many really appreciable differences. I would expect these numbers to inch even higher in next week’s review.
Parks with the Highest and Lowest Average Wait
These parks likely won’t change week-to-week unless something ridiculous happens, but these data points will give us a high-level view of how wait times are trending from week to week.
- Highest: Hollywood Studios, average park-wide posted wait of 48 minutes (45 minutes last week)
- Lowest: EPCOT, average park-wide posted wait of 30 minutes (28 minutes last week)
When we look at these park-wide averages we see the high-level impact of the continuing Spring Break crowds. Even EPCOT, with its more mild crowds, has an average wait time of half an hour throughout the day. And Hollywood Studios stays in major yikes territory with an average posted wait of 48 minutes.
Most Inflated Posted Wait Times
We all know that Disney inflates their posted wait times on purpose. They have many reasons for doing this. Some are totally understandable, and some are potentially more problematic. We can figure out how much posted wait times are being inflated by comparing submitted actual wait times from the Lines App and the posted wait time when the person timing their wait entered the line.
Over the past week, actual wait times in the Lines App averaged 63% of what was posted. This is back close to our historical average. If the posted wait time was 60 minutes, you could’ve expected to wait just under 38 minutes instead.
But the worst offender for the past week is … any guesses … Peter Pan’s Flight! It has now held this title for something like 8 out of the last 10 weeks. At this one attraction, submitted actual wait times were only 47% of posted wait times in the past week, which means that if Peter Pan had a 60 minute posted wait, you probably would’ve waited just over 28 minutes. Less than half of what was posted. Remember to always check the Lines app for predicted actual waits instead of believing what is posted.

Actual Wait Time Rock Star
The Actual Wait Time Rock Star for the past week was … msarna, who submitted 28 actual wait times through the Lines App over the last 7 days! This includes 27 Standby waits and 1 Virtual Queue wait. Thank you for all of that timing, msarna! But you didn’t claim the all-time record, which is still held by shop.kgb, with 50 recorded wait times in a single week.
In the next week, if you’re able to grab TRON virtual queue or lightning lane waits for us, that would be incredibly helpful! We’re trying to get an idea of what operations are like after “full” opening.
Looking Ahead: April 4th through 10th
Hello crazy Easter crowds! Don’t let predicted crowd levels fool you this week. Things are going to get very crowded. Disney knows it, because they’re charging an arm and a leg for Genie+. Even when they pushed an IT update that made it not work for a lot of users.
Park reservations for Magic Kingdom are pretty much booked up through April 12th, thanks to the official opening of TRON. Hollywood Studios also has limited availability most of the coming week. Now, just because park reservations are sold out doesn’t mean every park will hit crowd level 10. But it does mean that parks will feel crowded, and the potential for high wait times is there. There may also be thunderstorms rolling in over the upcoming weekend, which can make people stay out of the parks and cause downtime.
Pack your patience if you’re headed to Orlando this week. Budget a little (or a lot) extra if you plan to use Genie+, or hit those early entry or extended evening hours whenever you can.
You May Also Like...
-

We're officially in the period of the calm before all of the Spring Breaks. Since Easter is in April this year,…
-

Happy February, Disney Data fans! I have to start out this special February 8 post by giving a shout-out to my…
-

And we're back! It's been two whole weeks since you've gotten your dose of Disney data, and I know you've all…
-

Happy March! We made it through Festival of the Arts, Valentine's Day and President's Day, and all of those Mardi Gras…
I was at all of the parks March 25-31. We had Rise of the Resistance break down partway through our first time ever riding it.
Is it normal to have a long line for a boarding group? We had an early boarding group for GOTG on March 25 and there was maybe just five minutes of waiting. For Tron, we had a mid afternoon boarding group (so lucky!) but ended up waiting in a queue for maybe 20 minutes. Not terrible but I assumed it would be more like ILL and nearly walk on.
FYI – After Hours tickets for MK on March 29 were definitely worth it. My daughter and I walked onto Space Mountain. Walked miles through the standby queue and literally never paused for a second before getting in the car. About the only ride that had a wait was Haunted Mansion.
March 31 at HS was NOT. There were a relatively small number of rides open and those that were mostly had long lines (maybe not as bad as regular hours, but it still 30-45 minutes) even close to midnight so we didn’t get on many rides at all.
You got very lucky on GOTG – virtual queue wait times can be up to around 40 minutes!
“Even when they pushed an IT update that made it not work for a lot of users”. Becky, any insight or details regarding your statement you can share?
There was some update to the software the night before April 4th. I don’t know exactly what it was intended to accomplish, but it made some buttons nonfunctional and other random bugs.