Disney Data Dump November 12 2025
Late October at Walt Disney World has become the quiet pause between spooky season and Jersey Week. But this year brought a little plot twist. We started off with wonderfully low waits, then the East Coast made its annual pilgrimage south and nudged crowd levels just slightly upward. Things didn’t truly wake up until Veterans Day weekend, when holiday filming in Magic Kingdom and the long weekend pushed waits noticeably higher. The result? A surprisingly pleasant stretch as the parks made the transition from Halloween to Christmas.
Observed Crowd Levels October 28 – November 10
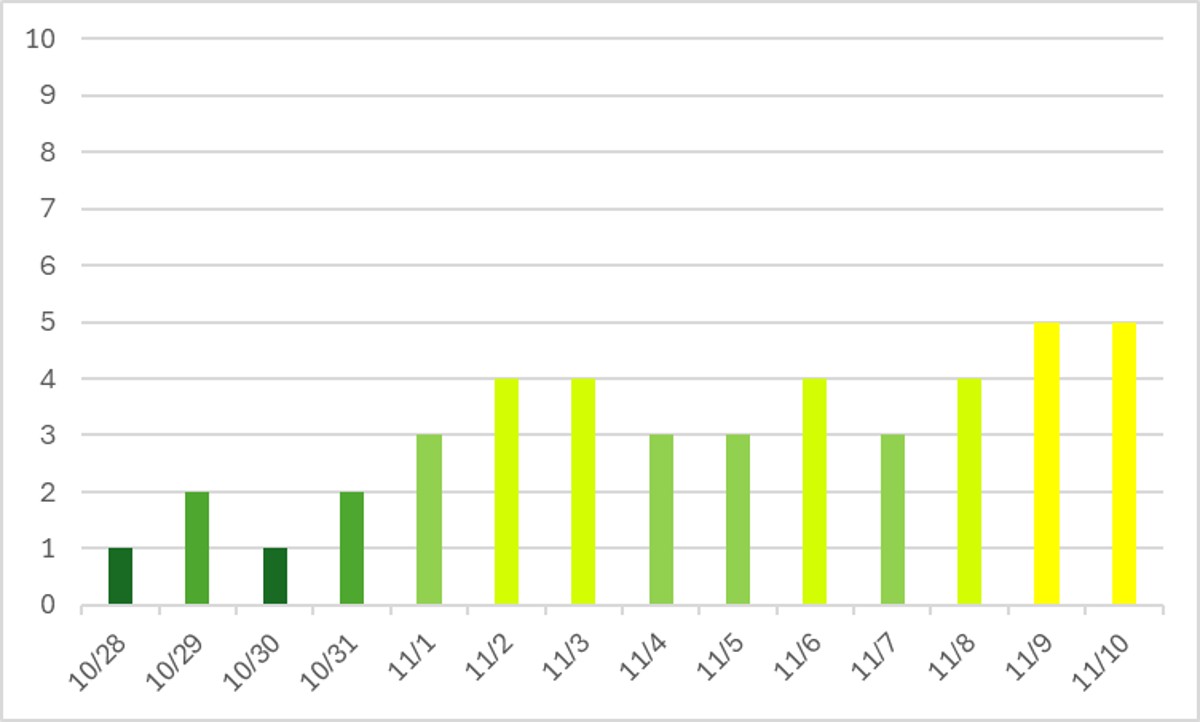
Now this is an interesting graph for late October and early November! Jersey Week, the time of year when many East Coast families journey down to Florida, at least dragged WDW out of the doldrums and into the 3-4 crowd level territory. But things didn’t really pick up until Veteran Day weekend. A lot of the Disney Christmas special was filmed in Magic Kingdom on the 9th and 10th, and it looks like there were plenty of people who were able to attend!
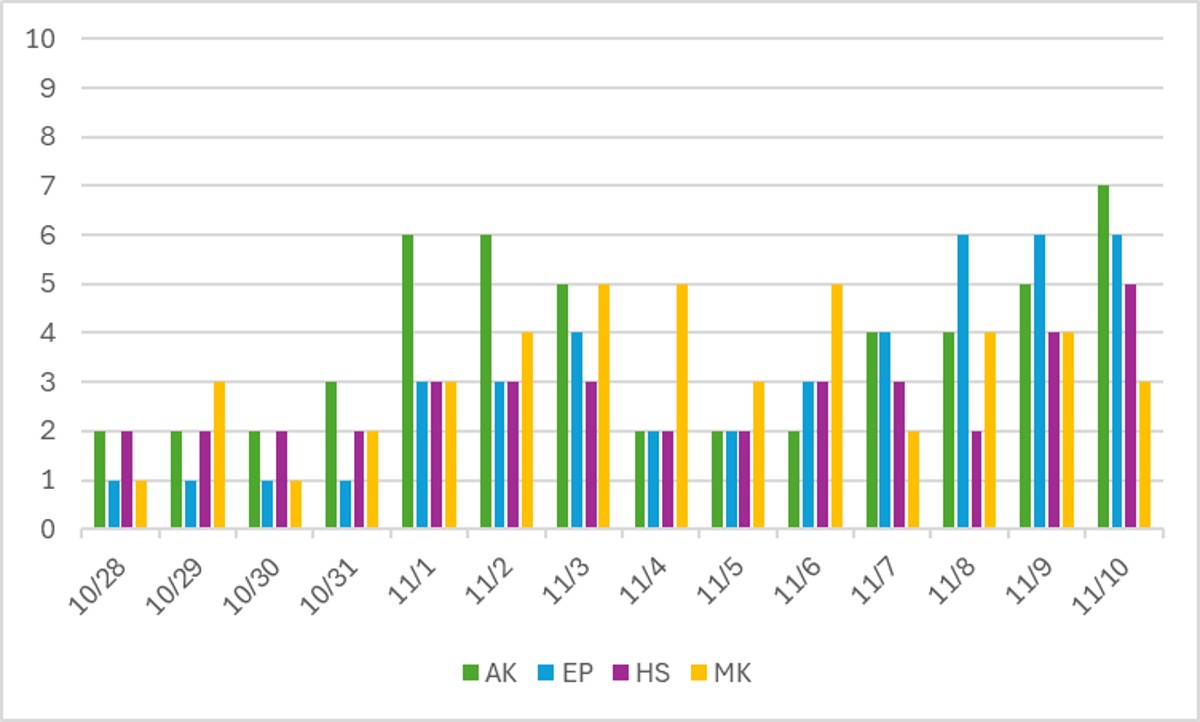
This graph is a little crazy with two weeks to cover, but stick with me.
First, let’s go over party behavior. The Magic Kingdom had parties on the 28th, 30th, and 31st, so we’ve got a small spike in crowds on the 29th. But all of the parks were SO empty at the end of October that it didn’t really matter. This continues a trend of very late October being a sweet spot for spooky season without scary crowds. Then the first Very Merry Christmas parties of the season were on the 7th and 10th. Crowd levels certainly dropped on the 7th, but not as much on the 10th. This could potentially be thanks to holiday filming still taking place and drawing more people to the park than would otherwise be there on a party day.
We’ve also got the first Jollywood Nights party in this graph, on the 8th at Hollywood Studios. Usually, Jollywood Nights has negligible impact on crowds because day guests still get almost a full park day, and they still get to watch Fantasmic. It’s not like Magic Kingdom where you’re losing the nighttime spectacular on a party day. But the 8th certainly was a pretty big drop in crowds compared to the surrounding days, so that’s something to keep an eye on over the next couple of weeks.
Otherwise, we’ve got an interesting trend of Animal Kingdom getting really packed on weekends, and wait times at EPCOT are nearly leading the pack as crowd levels rise.
Performance of Crowd Level Predictions
Each week, I give you a very transparent look into how the TouringPlans crowd level predictions performed. Each day at each park is one data point, so each week we have 28 different crowd level predictions to evaluate. Any time a prediction is within one or two crowd levels, things won’t really “feel” much different than what was predicted. Being off by 3 or more crowd levels is where you might feel that difference in wait times throughout the day.
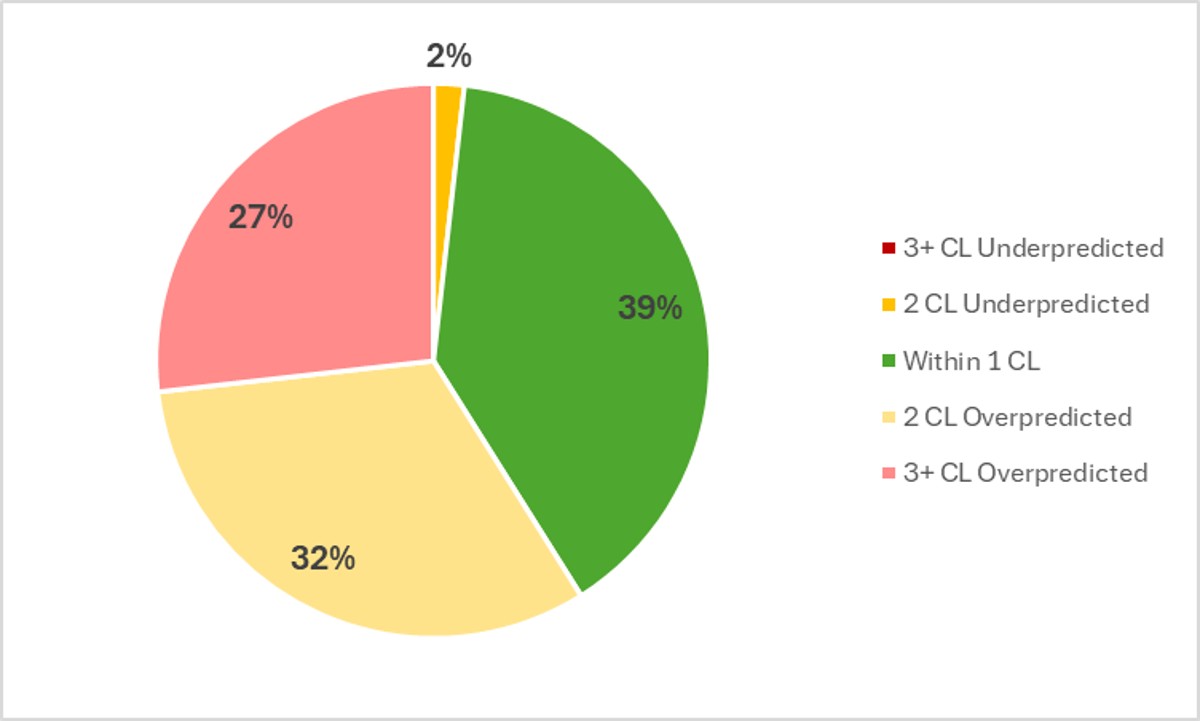
In the past two weeks, Touring Plans predictions were either spot-on or within 1 crowd level 39% of the time, which is ever so slightly higher than two weeks ago. 73% of the time Touring Plans predictions were within 2 crowd levels, so that means we get a C for our predictions in the past week. On average, any park you visited this week would’ve been 1.8 crowd levels below what was predicted. The biggest miss of the week was an overprediction of 5 crowd levels, which happened at Magic Kingdom on the 1st and Hollywood Studios on the 7th. Both of those park days were expected to be crowd level 8, and both ended up being just a 3 instead.
Attraction Downtime October 28 – November 10
If we average all of the capacity lost due to unexpected downtime over the past two weeks, it comes out to 4.9% of attractions unexpectedly being down. That’s close to our historical average. In the past two weeks, EPCOT was the park with the most overall downtime, averaging 6% of its capacity lost to downtime throughout that period. Once again, not a terrible “winning” number – all parks were pretty tightly clustered around the average.
The worst day for attraction downtime in the past two weeks was on October 29th. On that day, 9% of all capacity at WDW was lost due to unexpected downtime. And the worst park-day was a doozy. It happened at Animal Kingdom on November 10th. On that day, 22% of AK’s attraction capacity was lost due to unexpected downtime. Animal Kingdom was open for 10 hours on the 10th, so 22% downtime is the equivalent of the entire park shutting down for over 2 hours that day. Out of 10 hours! Most of that was due to Expedition Everest being down all day. With so few attractions open at Animal Kingdom, a high-capacity attraction like that being unavailable has huge impacts throughout the park. It’s a big part of why Animal Kingdom rocketed up to a crowd level 7 on the 10th. All of those displaced people had to get into other lines instead.
Attraction Downtime Worst Offender
In the past two weeks, Expedition Everest was the WDW attraction with the worst overall downtime. It was unexpectedly down for 14% of the past week. Thankfully, that’s a pretty low winning number compared to what we’ve seen in the past. But it’s at a park where any downtime makes a big difference. We’ve also been keeping track of downtime at Spaceship Earth (it was 11%, which still isn’t awesome) and Test Track (13%, below its average). Anyway, the worst day at Everest over the last two weeks was easily on November 10th, when it was down all the live-long day. A big bummer for anyone in the park that day who was excited to ride.

Rope Drop Downtime
Here are problematic offenders from the past two weeks, with the percentage of downtime during the first hour of the day in parentheses:
- Magic Kingdom: Tiana’s Bayou Adventure (25%), The Many Adventures of Winnie the Pooh (22%), Pirates of the Caribbean (18%), Haunted Mansion (17%), Seven Dwarfs Mine Train (11%), Jungle Cruise (10%)
- EPCOT: Spaceship Earth (29%), Living with the Land (18%), Remy’s Ratatouille Adventure (16%), Journey into Imagination (14%), Test Track (12%)
- Hollywood Studios: Rise of the Resistance (20%), Slinky Dog Dash (19%), Runaway Railway (12%)
- Animal Kingdom: DINOSAUR (12%)
Alas, no gold stars over the past two weeks. Dinosaur kept Animal Kingdom from that achievement.
Worth calling out here is the relatively bad two weeks for Magic Kingdom, with a wide variety of attractions having at least moderate trouble. And Hollywood Studios is predictably difficult, with Rise and Slinky both being down about a fifth of the time. That’s like opening 12 minutes late every day (almost half of early entry) or totally missing the first hour of the day once every five days. Not good odds for two very popular headliners.
And over at EPCOT, Spaceship Earth continues to struggle with waking up in the morning. Thankfully it probably shouldn’t be the attraction you rope drop there anyway.
Wait Times October 28 – November 10
For this section, we’re going to split all results up by week because really we’re reviewing two pretty different weeks
Attractions with the Highest Average Posted Wait at Each Park October 28 – November 3
- EPCOT: Cosmic Rewind, average posted wait of 64 minutes (was 65 minutes the prior week)
- Hollywood Studios: Slinky Dog Dash, average posted wait of 54 minutes (was 57 minutes the prior week)
- Magic Kingdom: TRON, average posted wait time of 50 minutes (was 52 minutes the prior week)
- Animal Kingdom: Flight of Passage, average posted wait time of 50 minutes (was 48 minutes the prior week)
What we see here is a tale of two Octobers. These highest average wait times were easily 15 or 20 minutes higher than what we’re seeing here. The first half of October was crazy crowds, and second half of October was relatively empty, especially in the last 4 days.
Attractions with the Highest Average Posted Wait at Each Park November 4 – 10
- EPCOT: Cosmic Rewind, average posted wait of 75 minutes (was 64 minutes the prior week)
- Hollywood Studios: Slinky Dog Dash, average posted wait of 61 minutes (was 54 minutes the prior week)
- Magic Kingdom: TRON, average posted wait time of 56 minutes (was 50 minutes the prior week)
- Animal Kingdom: Flight of Passage, average posted wait time of 54 minutes (was 50 minutes the prior week)
Two interesting things to note here. First, clearly a very different week from the previous one. Still not crazy crowds though. Second, it’s not obvious by what I listed, but three out of the top five average waits were at EPCOT this week. And four out of the top seven! Cosmic Rewind, Test Track, and Remy are all very difficult to plan for right now. Really hard to do all three efficiently. And Frozen is the fourth.
Parks with the Highest and Lowest Average Wait October 28 – November 3
These parks likely won’t change week-to-week unless something crazy happens, but these data points will give us a high-level view of how wait times are trending from week to week.
- Highest: Hollywood Studios, average park-wide posted wait of 30 minutes (was 29 the prior week)
- Lowest: Magic Kingdom, average park-wide posted wait of 18 minutes (was 17.5 the prior week)
Same story here. Almost every park had average posted waits under half an hour – and even Hollywood Studios barely squeaked past that mark.
Parks with the Highest and Lowest Average Wait November 4 – 10
- Highest: Hollywood Studios, average park-wide posted wait of 34.5 minutes (was 30 minutes the prior week)
- Lowest: Magic Kingdom, average park-wide posted wait of 21 minutes (was 18 minutes the prior week)
Here’s where we see the tide start turning at a higher level. Magic Kingdom didn’t have as many parties and was overall more crowded, so it pops up above 20 minutes, and every other park was up over the 30 minute mark.
Most Inflated Posted Wait Times
We all know that Disney inflates their posted wait times on purpose. They have many reasons for doing this. Some are totally understandable, and some are potentially more problematic. We can figure out how much posted wait times are being inflated by comparing submitted actual wait times from the Lines App and the posted wait time when the person timing their wait entered the line.
Over the past two weeks, actual wait times in the Lines App averaged 69% of what was posted. That’s back to our historical average. Overall, if the posted wait time at a popular attraction was 60 minutes, you could’ve expected to wait just over 40 minutes instead.
But the worst inflation offender for the past two weeks was back to Gran Fiesta Tour (old reliable). At this one attraction, submitted actual wait times were 41% of posted wait times in the past week. That means that if Gran Fiesta Tour had a 10 minute posted wait, you probably would have actually only waited just more than 4 minutes instead. Less than half of what was posted! Remember to always check the Lines app for predicted actual waits instead of making decisions based on what is posted.

This Week’s Wait Time Rock Star
Between October 28th and November 3rd, we had almost 900 timed actual waits submitted through the Lines app. The one person who recorded the most actual waits during that time was jimg1960, with 61 overall timed waits – 60 standby waits and 1 single rider wait. Thanks for that impressive amount of timing, jimg1960! You got the highest count we’ve seen in a very long time, but still not quite enough to dethrone our current timing champion, preef.
Between November 4th and November 10th, we had just over 1100 timed actual waits submitted through the Lines app. The one person who recorded the most actual waits during that time was QwertySC, with 43 overall timed waits – and it was in hard mode, with all standby waits. Thanks for all of that timing, QwertySC! Once again, it unfortunately does not compete with the the 97 timed waits in a single week from our current timing champion, preef.
Looking Ahead: November 11 – 17
I write this article on Tuesday evenings so that you all have the very freshest of data on Wednesdays. That means the 11th will already be in the past by the time you’ve read this, so we’re back to the future!
Party dates to consider: Jollywood Nights will be at Hollywood Studios on the 15th and 17th. Based on the little dip we got during the first event night, this could mean that more guests are “pushed” to the 16th, so it’s potentially worth trying to avoid that date. But even more importantly, Mickey’s Very Merry Christmas Party will mean Magic Kingdom closes early to guests on the 11th, 13th, 14th, AND 16th. Yikes. The 12th and 15th will probably be quite crowded.
Otherwise, I don’t expect crowd levels to keep climbing all of the way through Thanksgiving. They should calm back down a little as we head through the next week instead. Weekends should be slightly more crowded than weekdays.
Like most of the rest of the country, Orlando is unseasonably chilly right now. But things will gradually warm up over the coming days. You should get plenty of sunshine, but be prepared for breezy morning that might make you want to wear a sweatshirt or jacket.
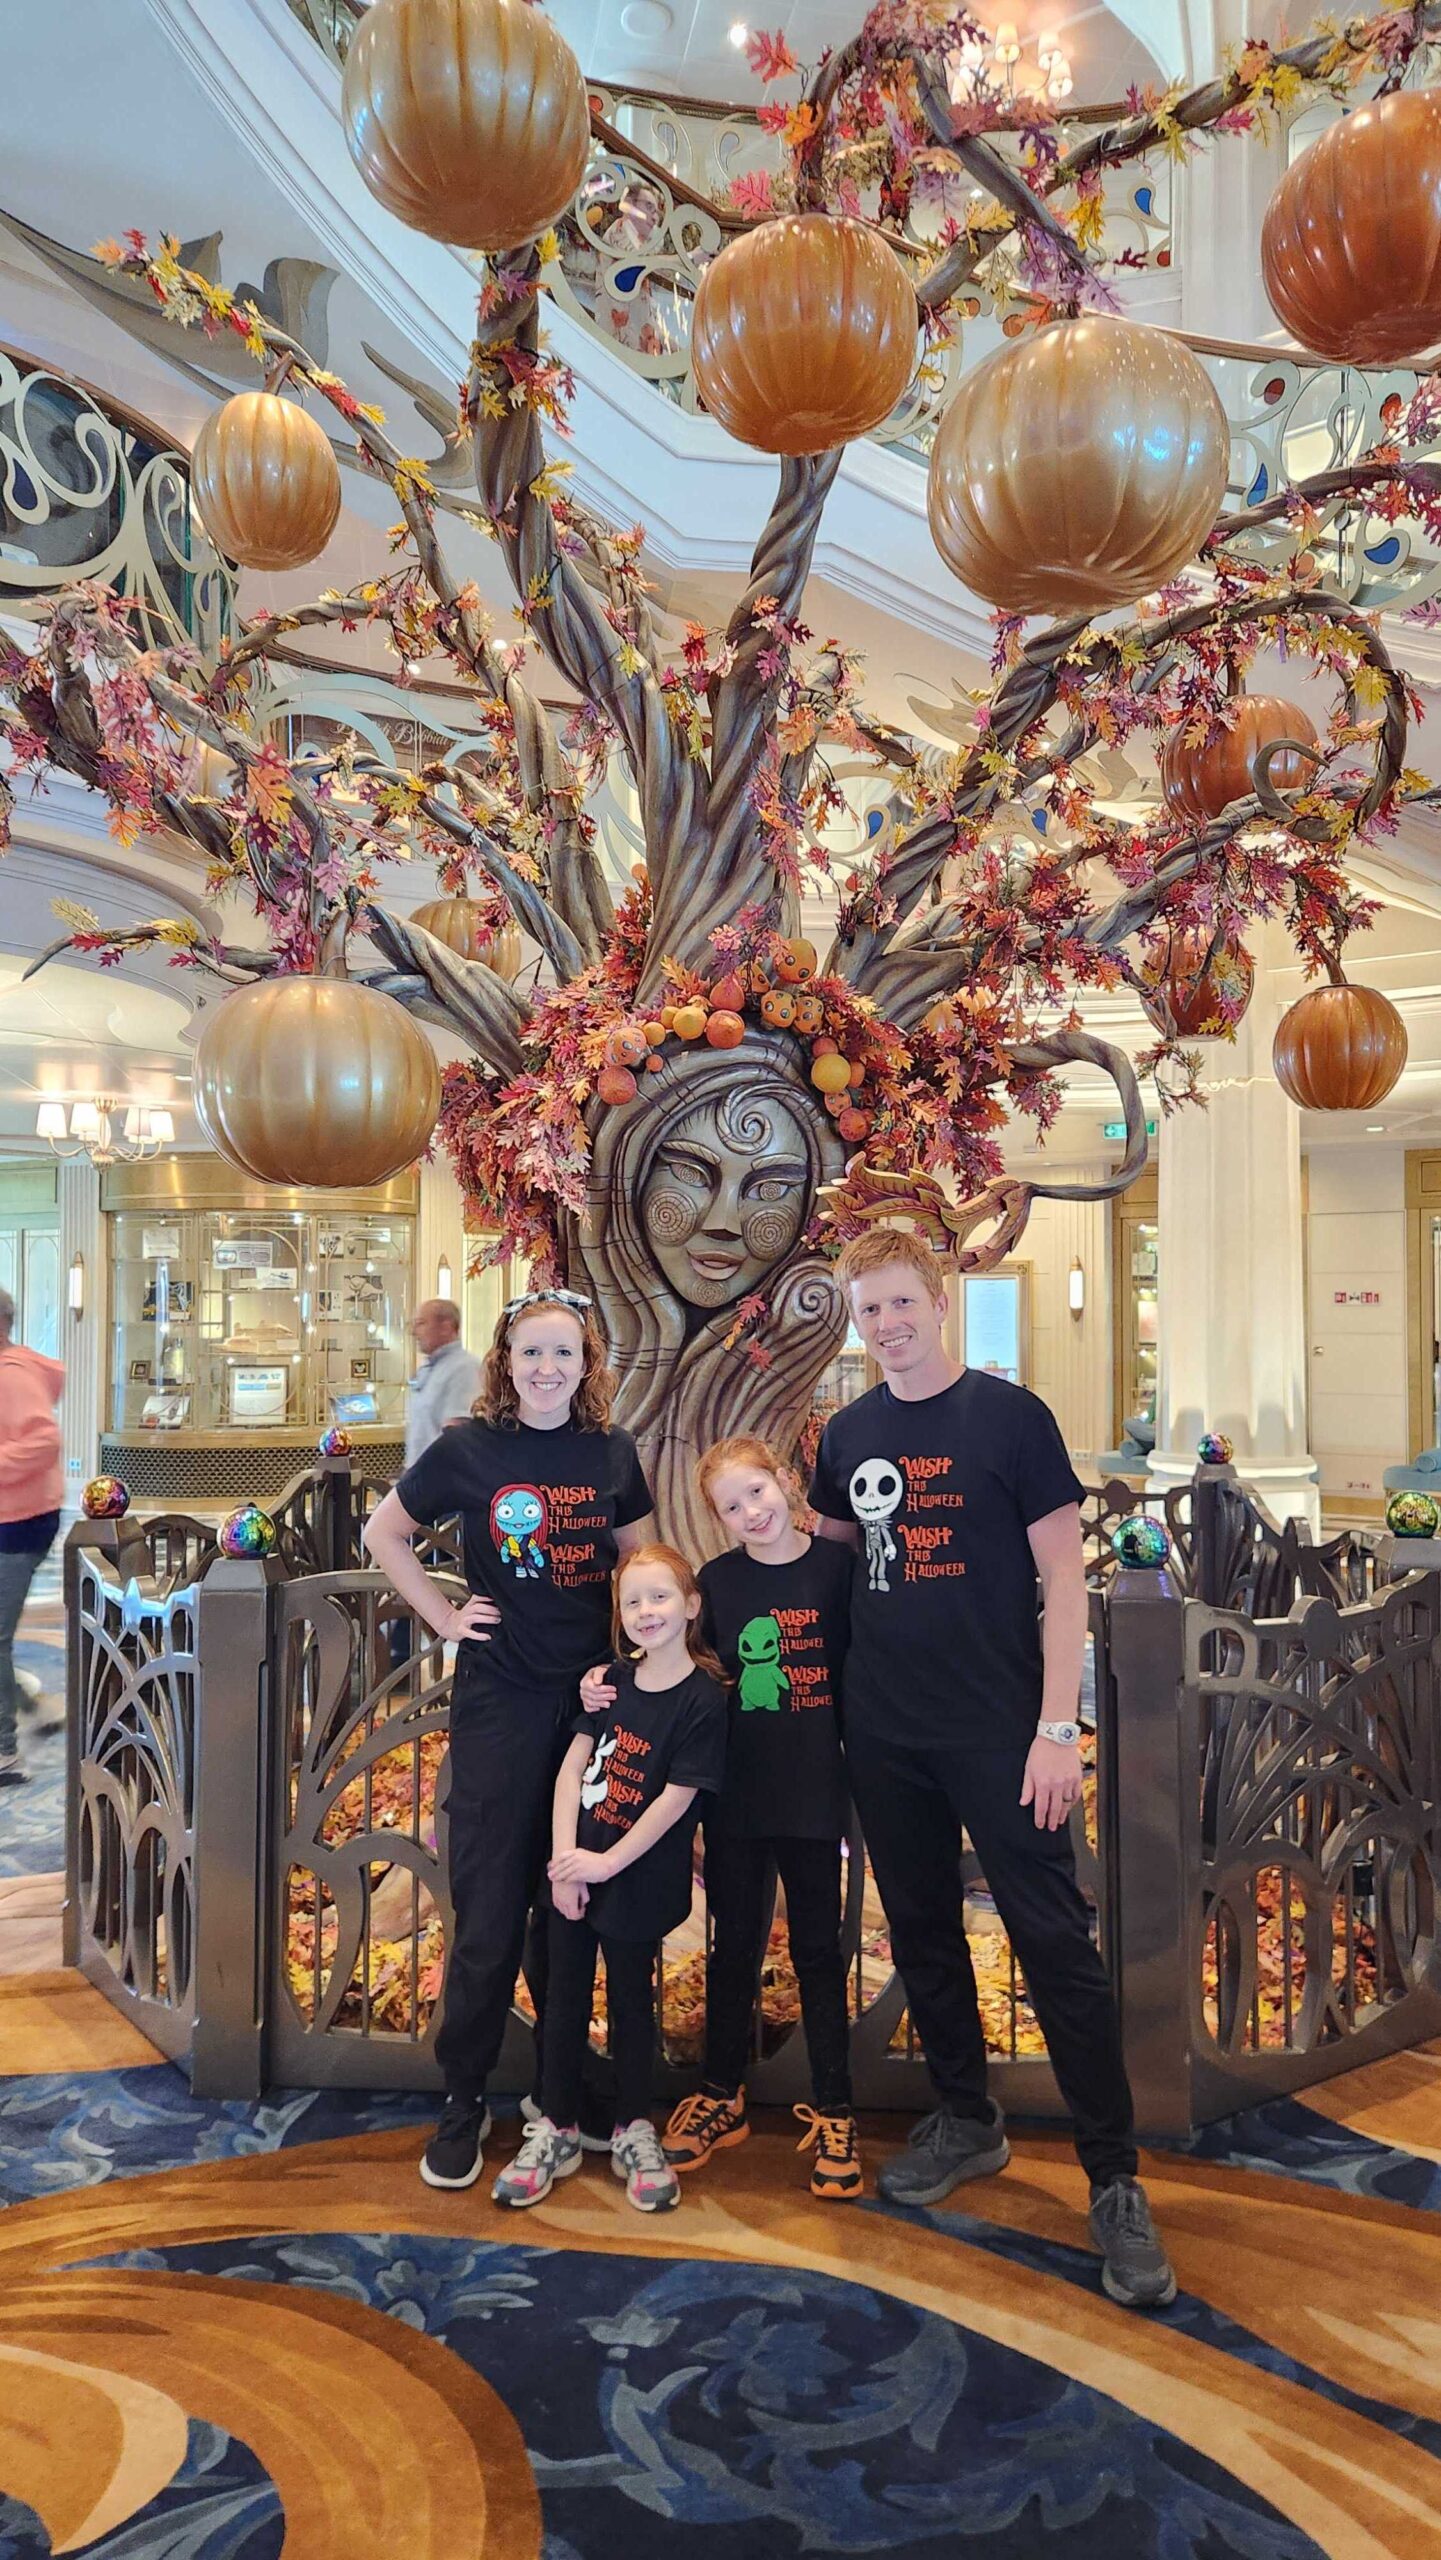
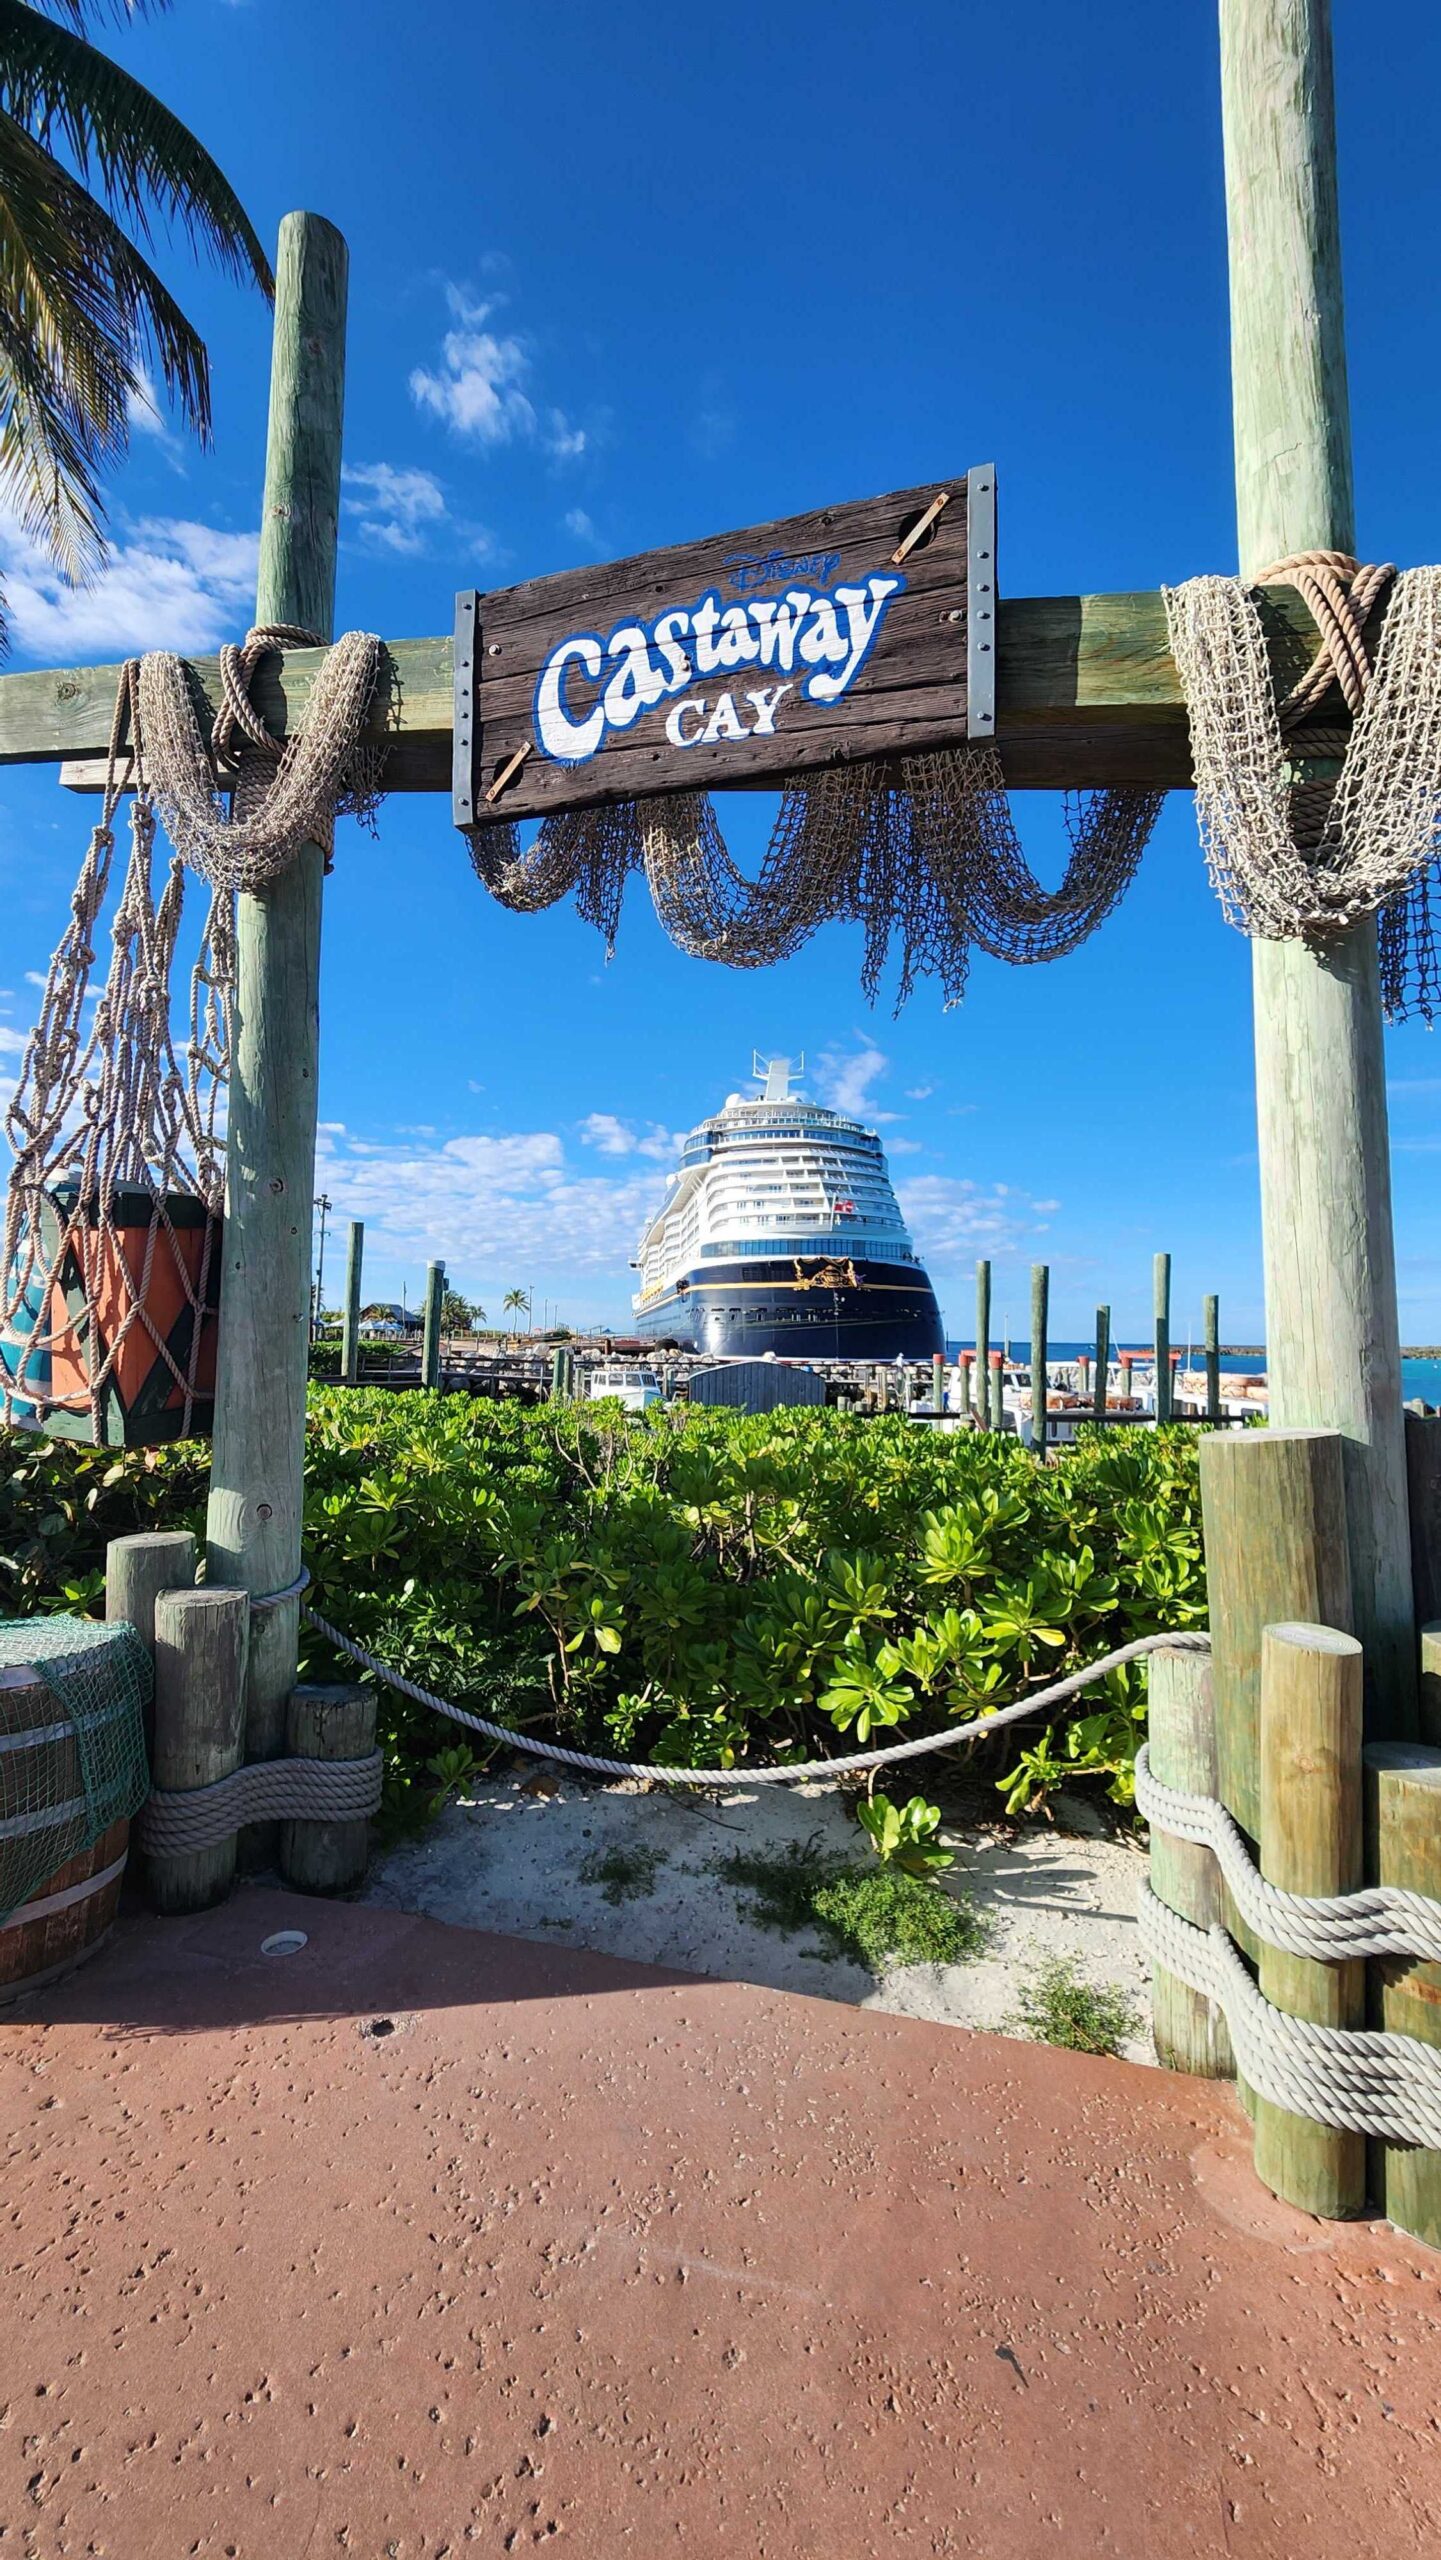
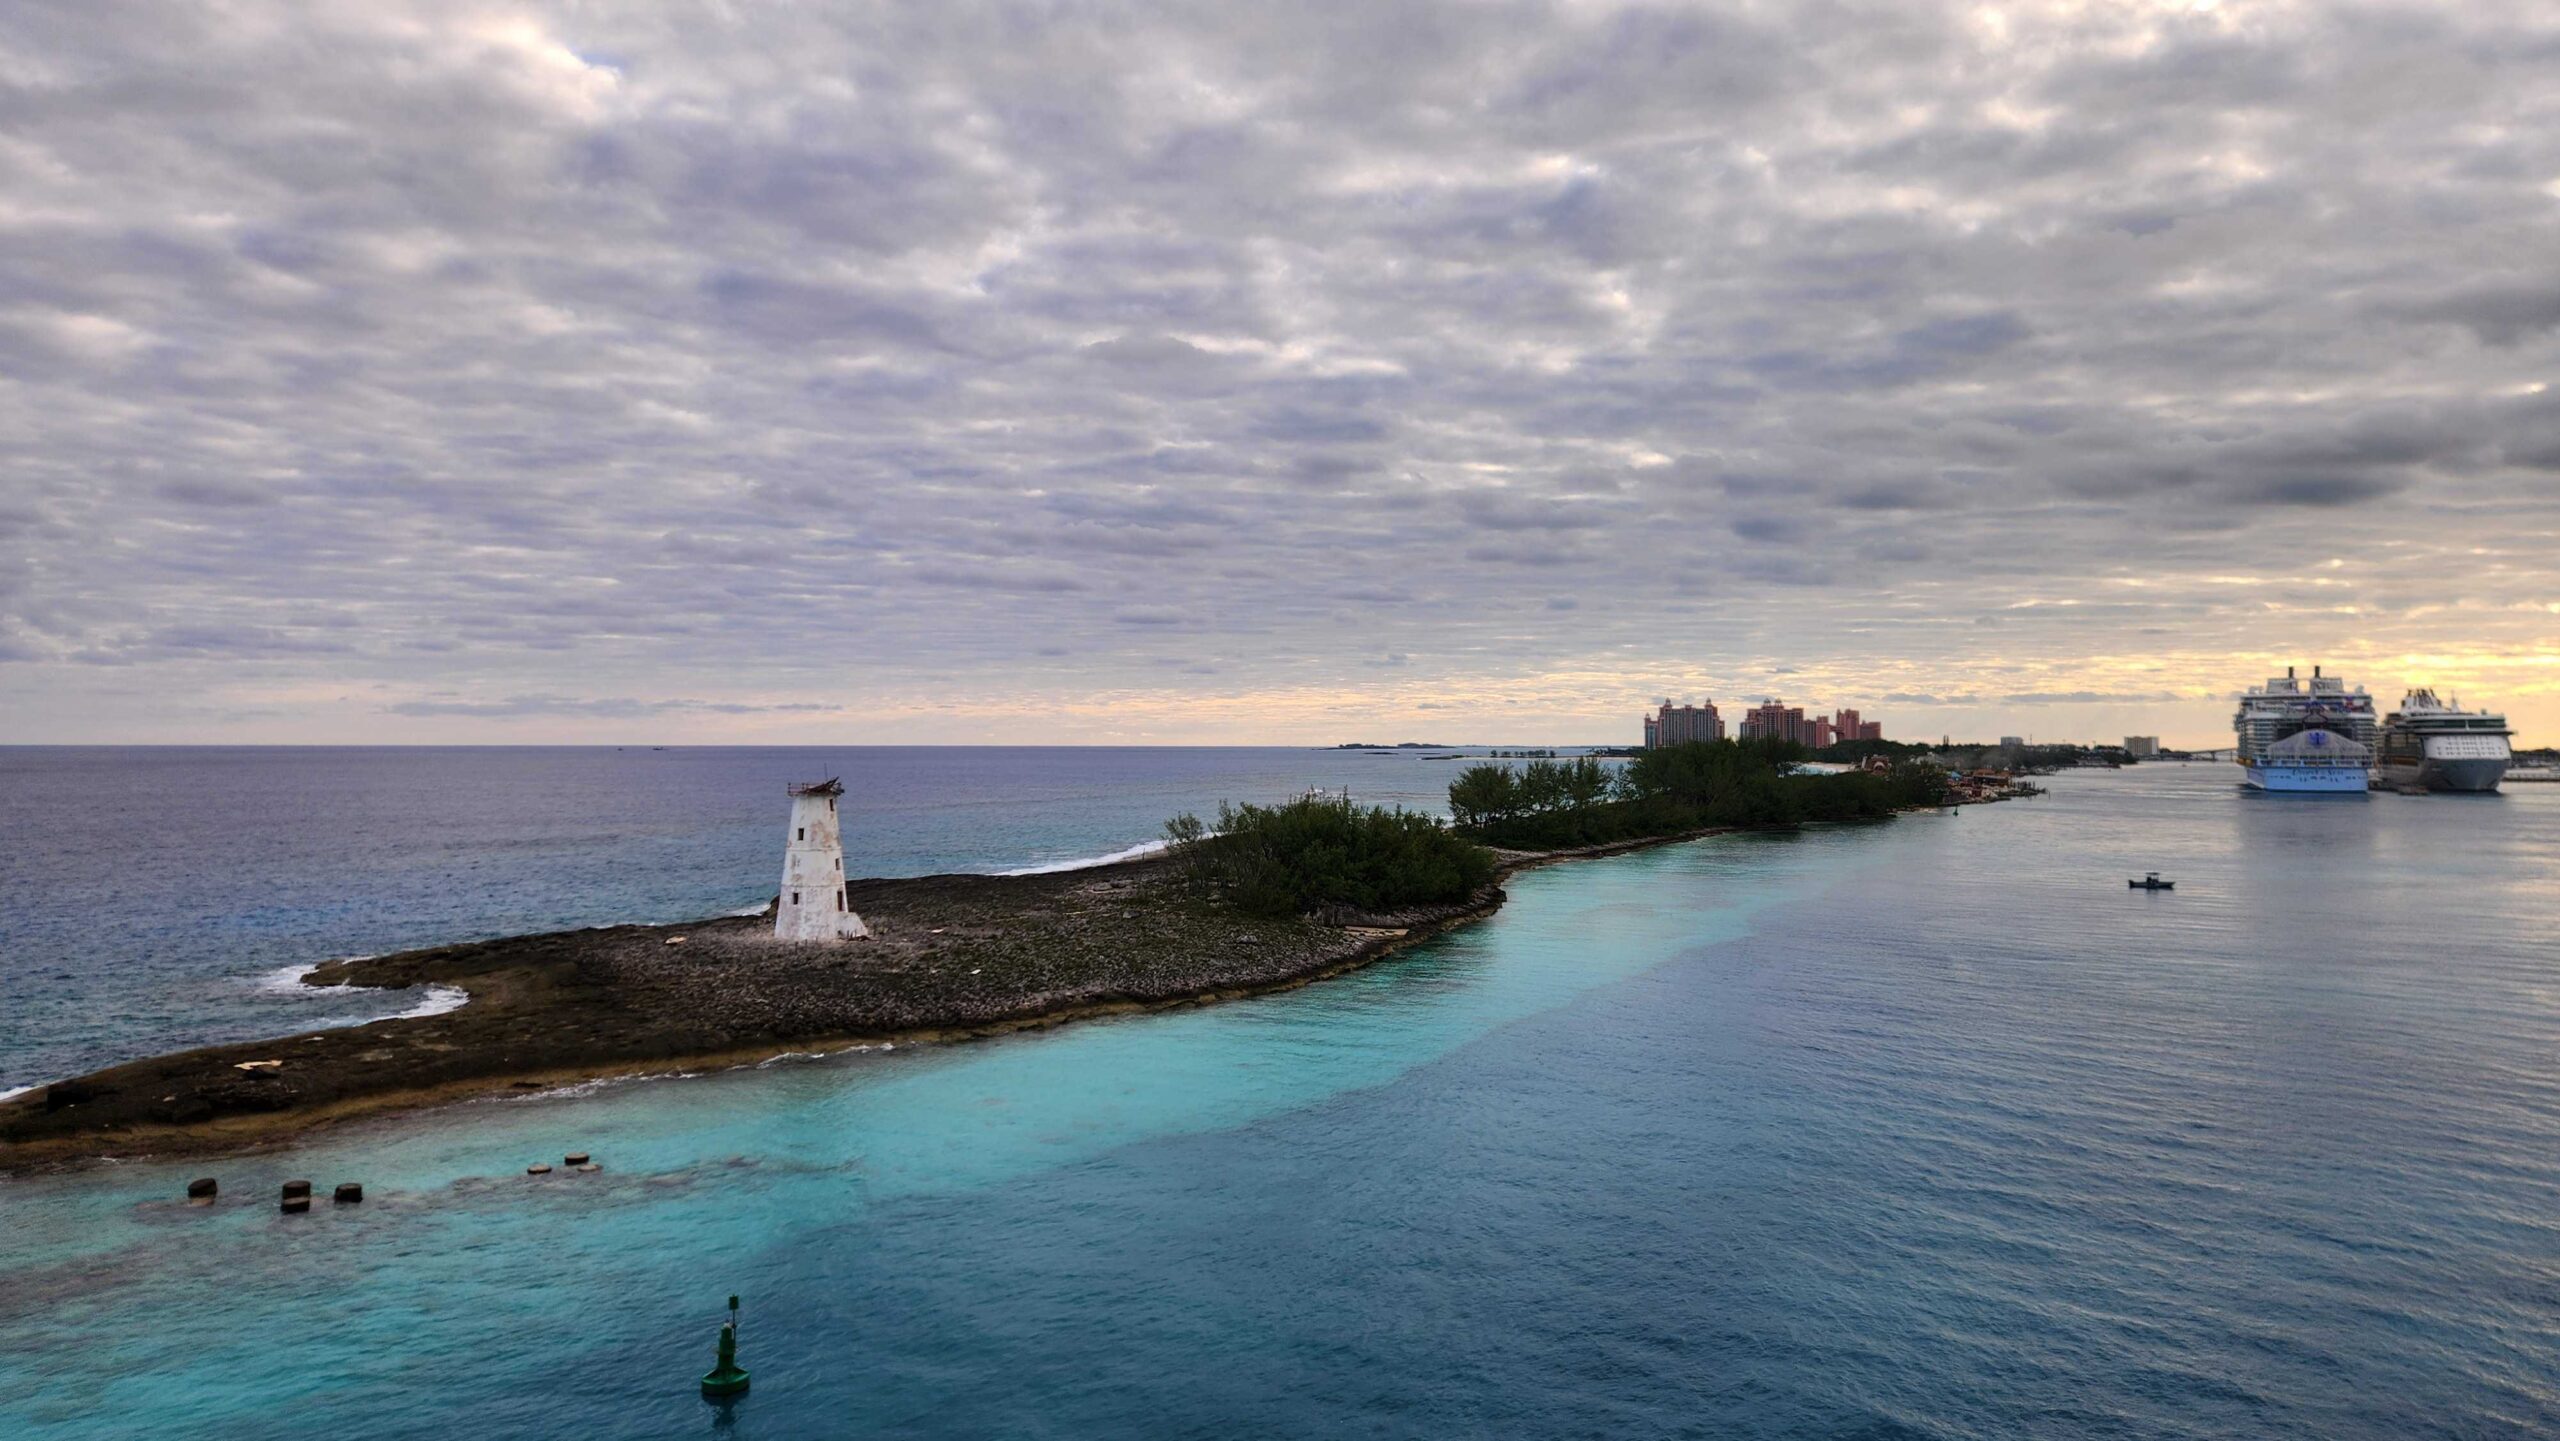
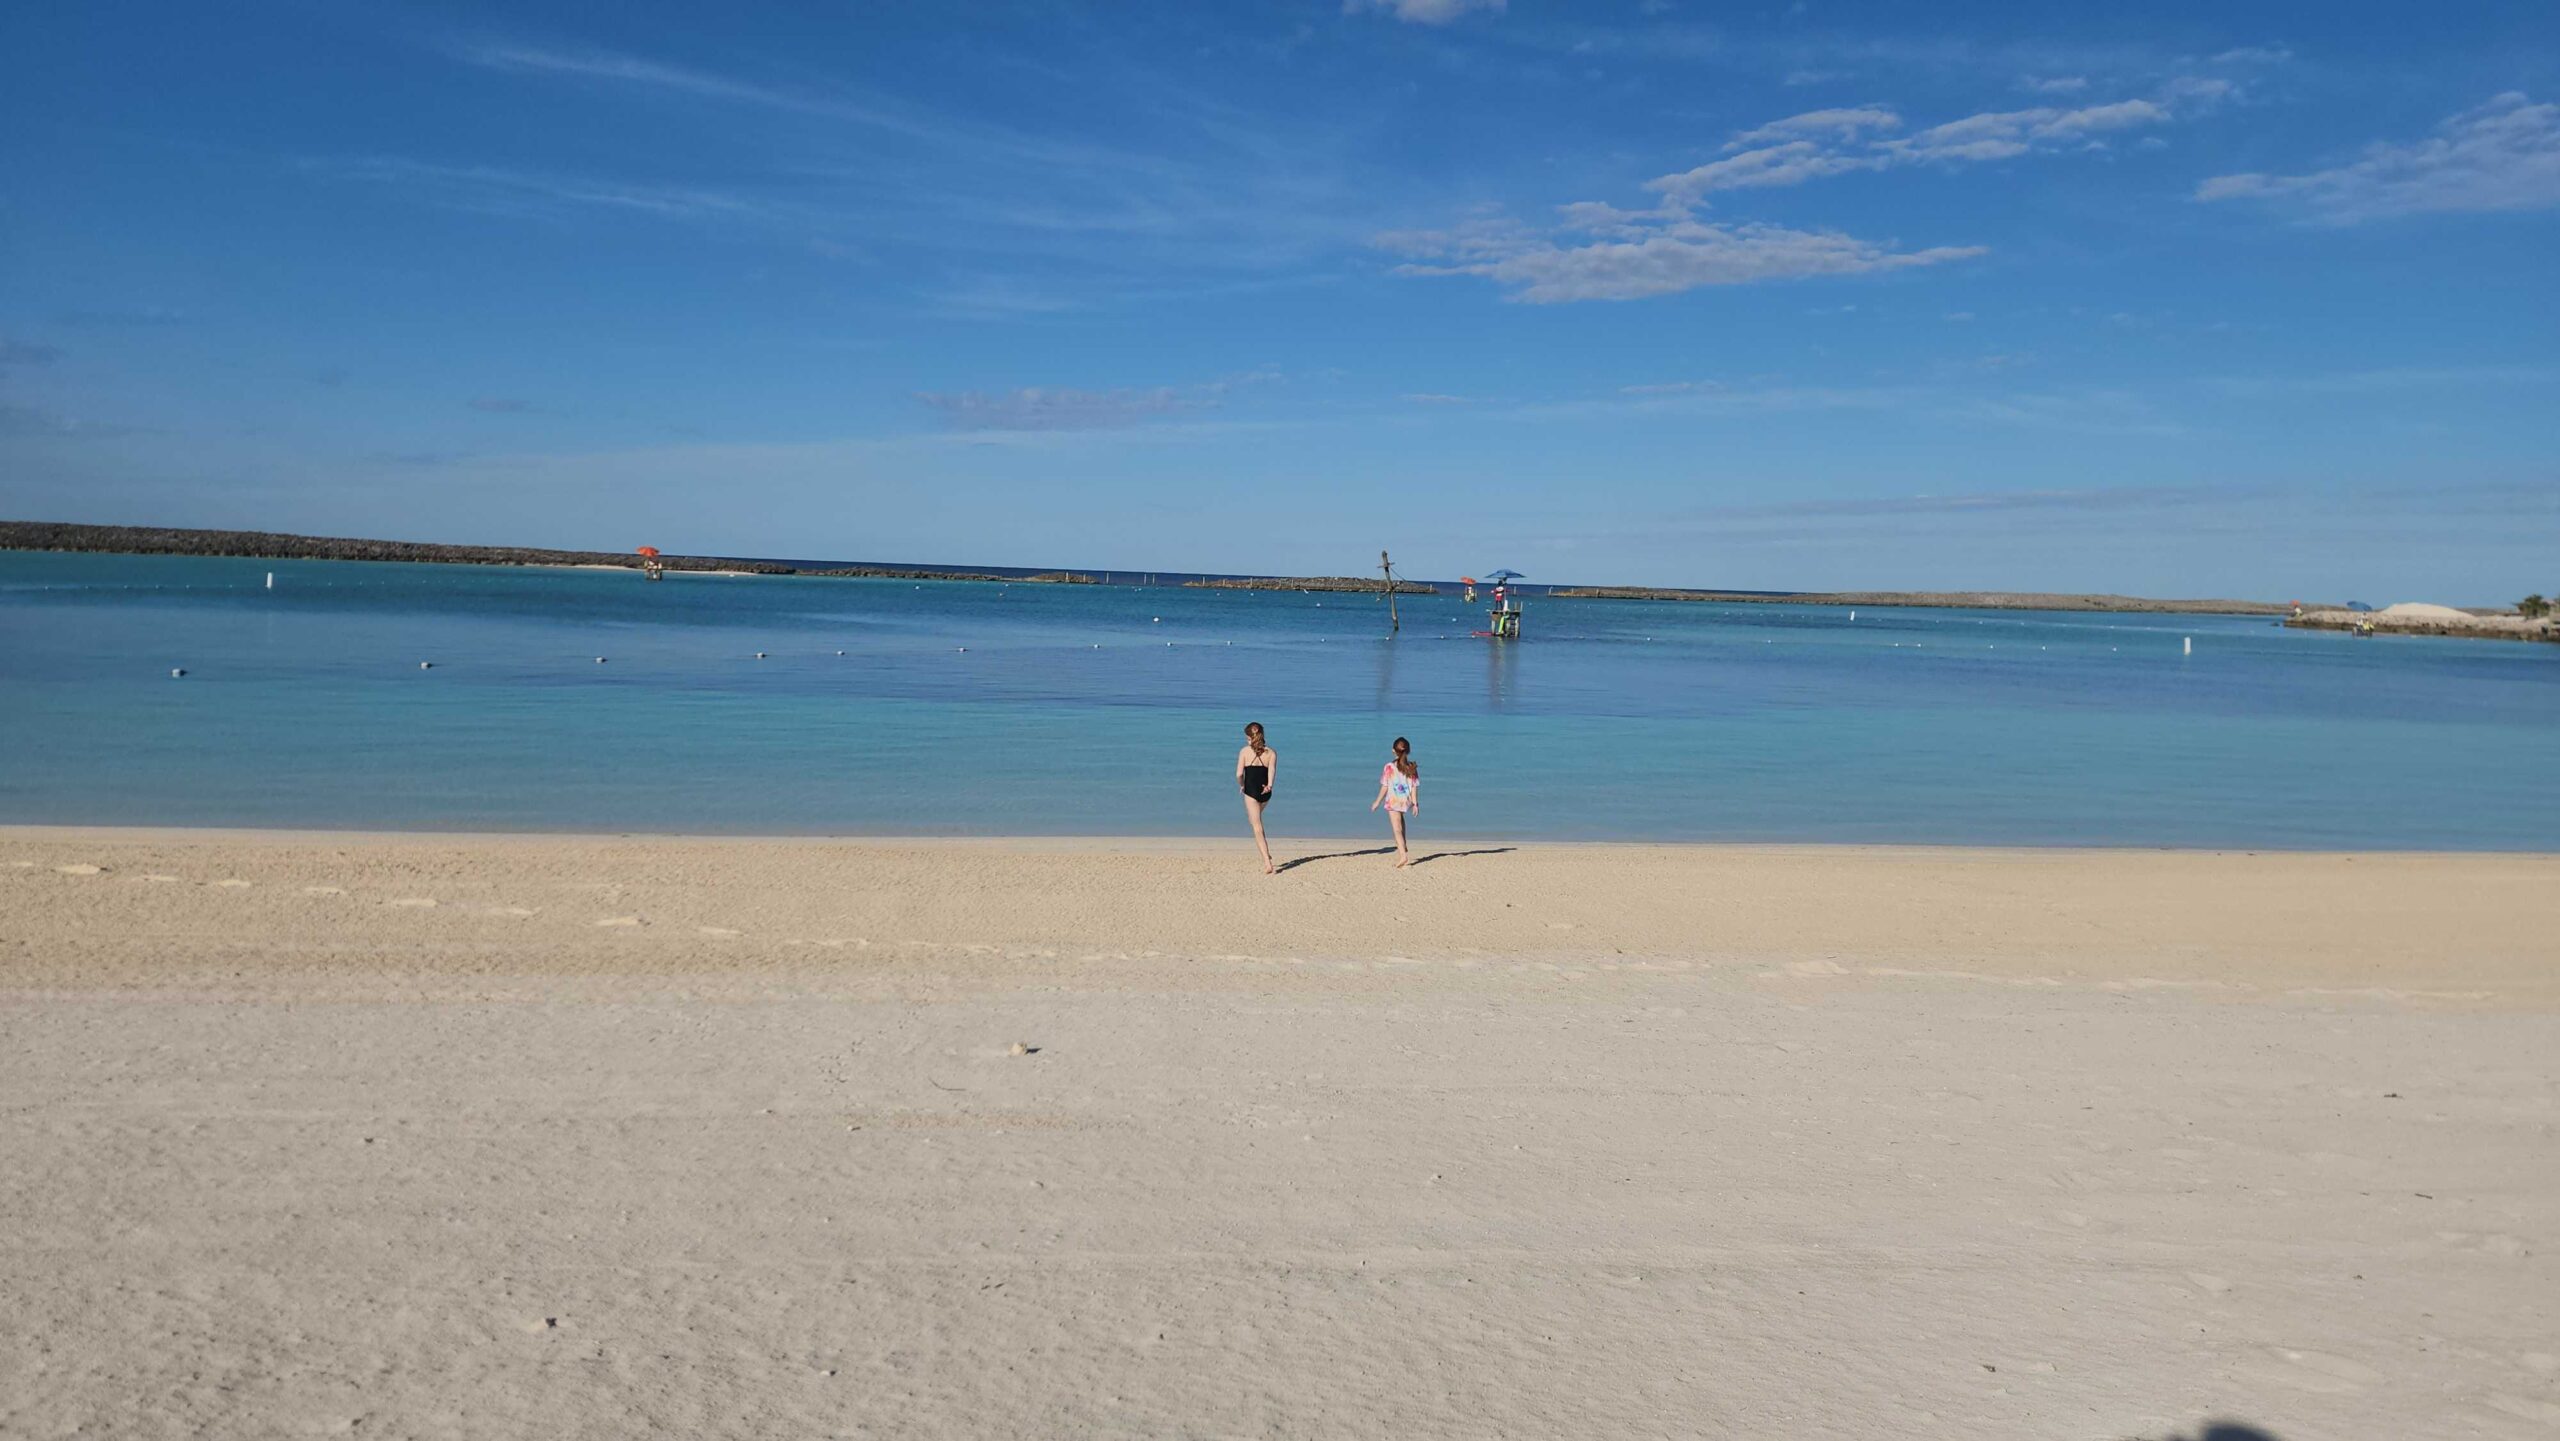
Bonus for following along this far: some cruise pictures from our family’s Halloween cruise on the Wish!

Were you in the parks this past week? Or are you headed to Orlando soon? Let me know in the comments below!
You May Also Like...
-

Hello to all of you wise folks who, unlike me, avoided the parks last week, knowing the large crowds who were…
-

For the first time ever, this week’s Data Dump comes to you from the back porch of Jambo House, with giraffes…
Great costumes and I hope the trip was magical!
Did you get wait times for the slides? Gotta work on the updated lines app for the cruiseline! HaHa!
Ha! The best question. And we did, in fact, get one AquaMouse wait time. 44 minutes at 3 pm on Nassau day 😉 Big kid is a water slide enthusiast, so hopefully we’ll gather more data on our longer cruise in March.