
Disney Data Dump October 12 2022
Holy crowds, Batman! Spiderman? Fall is here, and so are the beginnings of October crowds, ramping up into the holiday seasons through the end of the year. As we move out of the ghost-town part of the year, having data to make the right decisions about your vacation is going to be even more important! So let’s get into our quick review of timely Disney Data so that you can see things that happened in the Disney World parks in the past week. And then, we can take a look forward at things you need to know for the upcoming week if you have a trip planned.

Observed Crowd Levels 10/4 – 10/10

Well, hello there fall colors. Isn’t that appropriate? This is the first time that we haven’t had any below-average (5 or lower) crowds in a week. And it’s also our first park-wide crowd level 8 that we’ve seen. Don’t go into the parks without a plan and expecting low crowds!

Magic Kingdom is the only park that saw any crowd levels below 5 over the past week. And those were on … (say it with me) … party days! We’re not seeing crowd level one on those party days. BUT. The difference between a crowd level 8 (on, say, October 9th) and a crowd level 4 (on, say, October 10th) is over 4.5 hours of wait time during peak hours just for a selection of 11 popular attractions. That a big difference.

Each week, I’m giving you a very transparent look into how our crowd level predictions performed. Each day at each park is one data point, so we have 28 different crowd level predictions to evaluate each week. Any time a prediction is within one or two crowd levels, things won’t really “feel” much different than what we predicted. Being off by 3 or more crowd levels is where we’d like to be more accurate because you might feel that difference in wait times throughout the day.
In the past week, our predictions were either spot-on or within 1 crowd level 64% of the time. Yay! That’s the same as last two non-hurricane weeks! Consistency. And 92% of the time we were within 2 crowd levels. That means this week we earn an A- for our predictions. On two park days, we were off by 3 or more crowd levels.
Looking forward to next week, expect remarkably high crowds in the Magic Kingdom on October 12th. There are two party days immediately before the 12th, and two party days immediately after the 12th. So ~80% of people there for that set of 5 days is going to opt to go to Magic Kingdom on the 12th. Recipe for misery. Otherwise, crowd levels should be easing up ever-so-slightly as we move into next week since a lot of fall-break-ers travelled this week.
Attraction Downtime 10/4 – 10/11
If we average out all of the capacity lost due to unexpected downtime over the past week, it comes out to 3.6% of attractions unexpectedly being down. This is significantly better than last week (6.6%) thanks to no hurricane blowing through, and is roughly equivalent to the pre-hurricane week (3.1%). The park with the biggest issues was Magic Kingdom (4.1% of capacity lost), which is the same as last week. Lots of reliability issues still plaguing Magic Kingdom, so last week wasn’t just an anomaly.
The single worst day for attraction downtime in the past week was October 4th. On that day, 6% of all capacity at WDW was lost due to unexpected downtime. That’s not great, but it’s not the 11% that we saw on September 30th. And the single worst park-day of the park week was the predictable (yay data!) combination of our worst day and worst park – Magic Kingdom on October 4th. On that day, 10% of the park’s capacity was lost due to unexpected downtime. All of that downtime almost certainly had a big impact on wait times (Magic Kingdom was predicted to be a 3 and ended up a 5 – on a party day!
Attraction Downtime
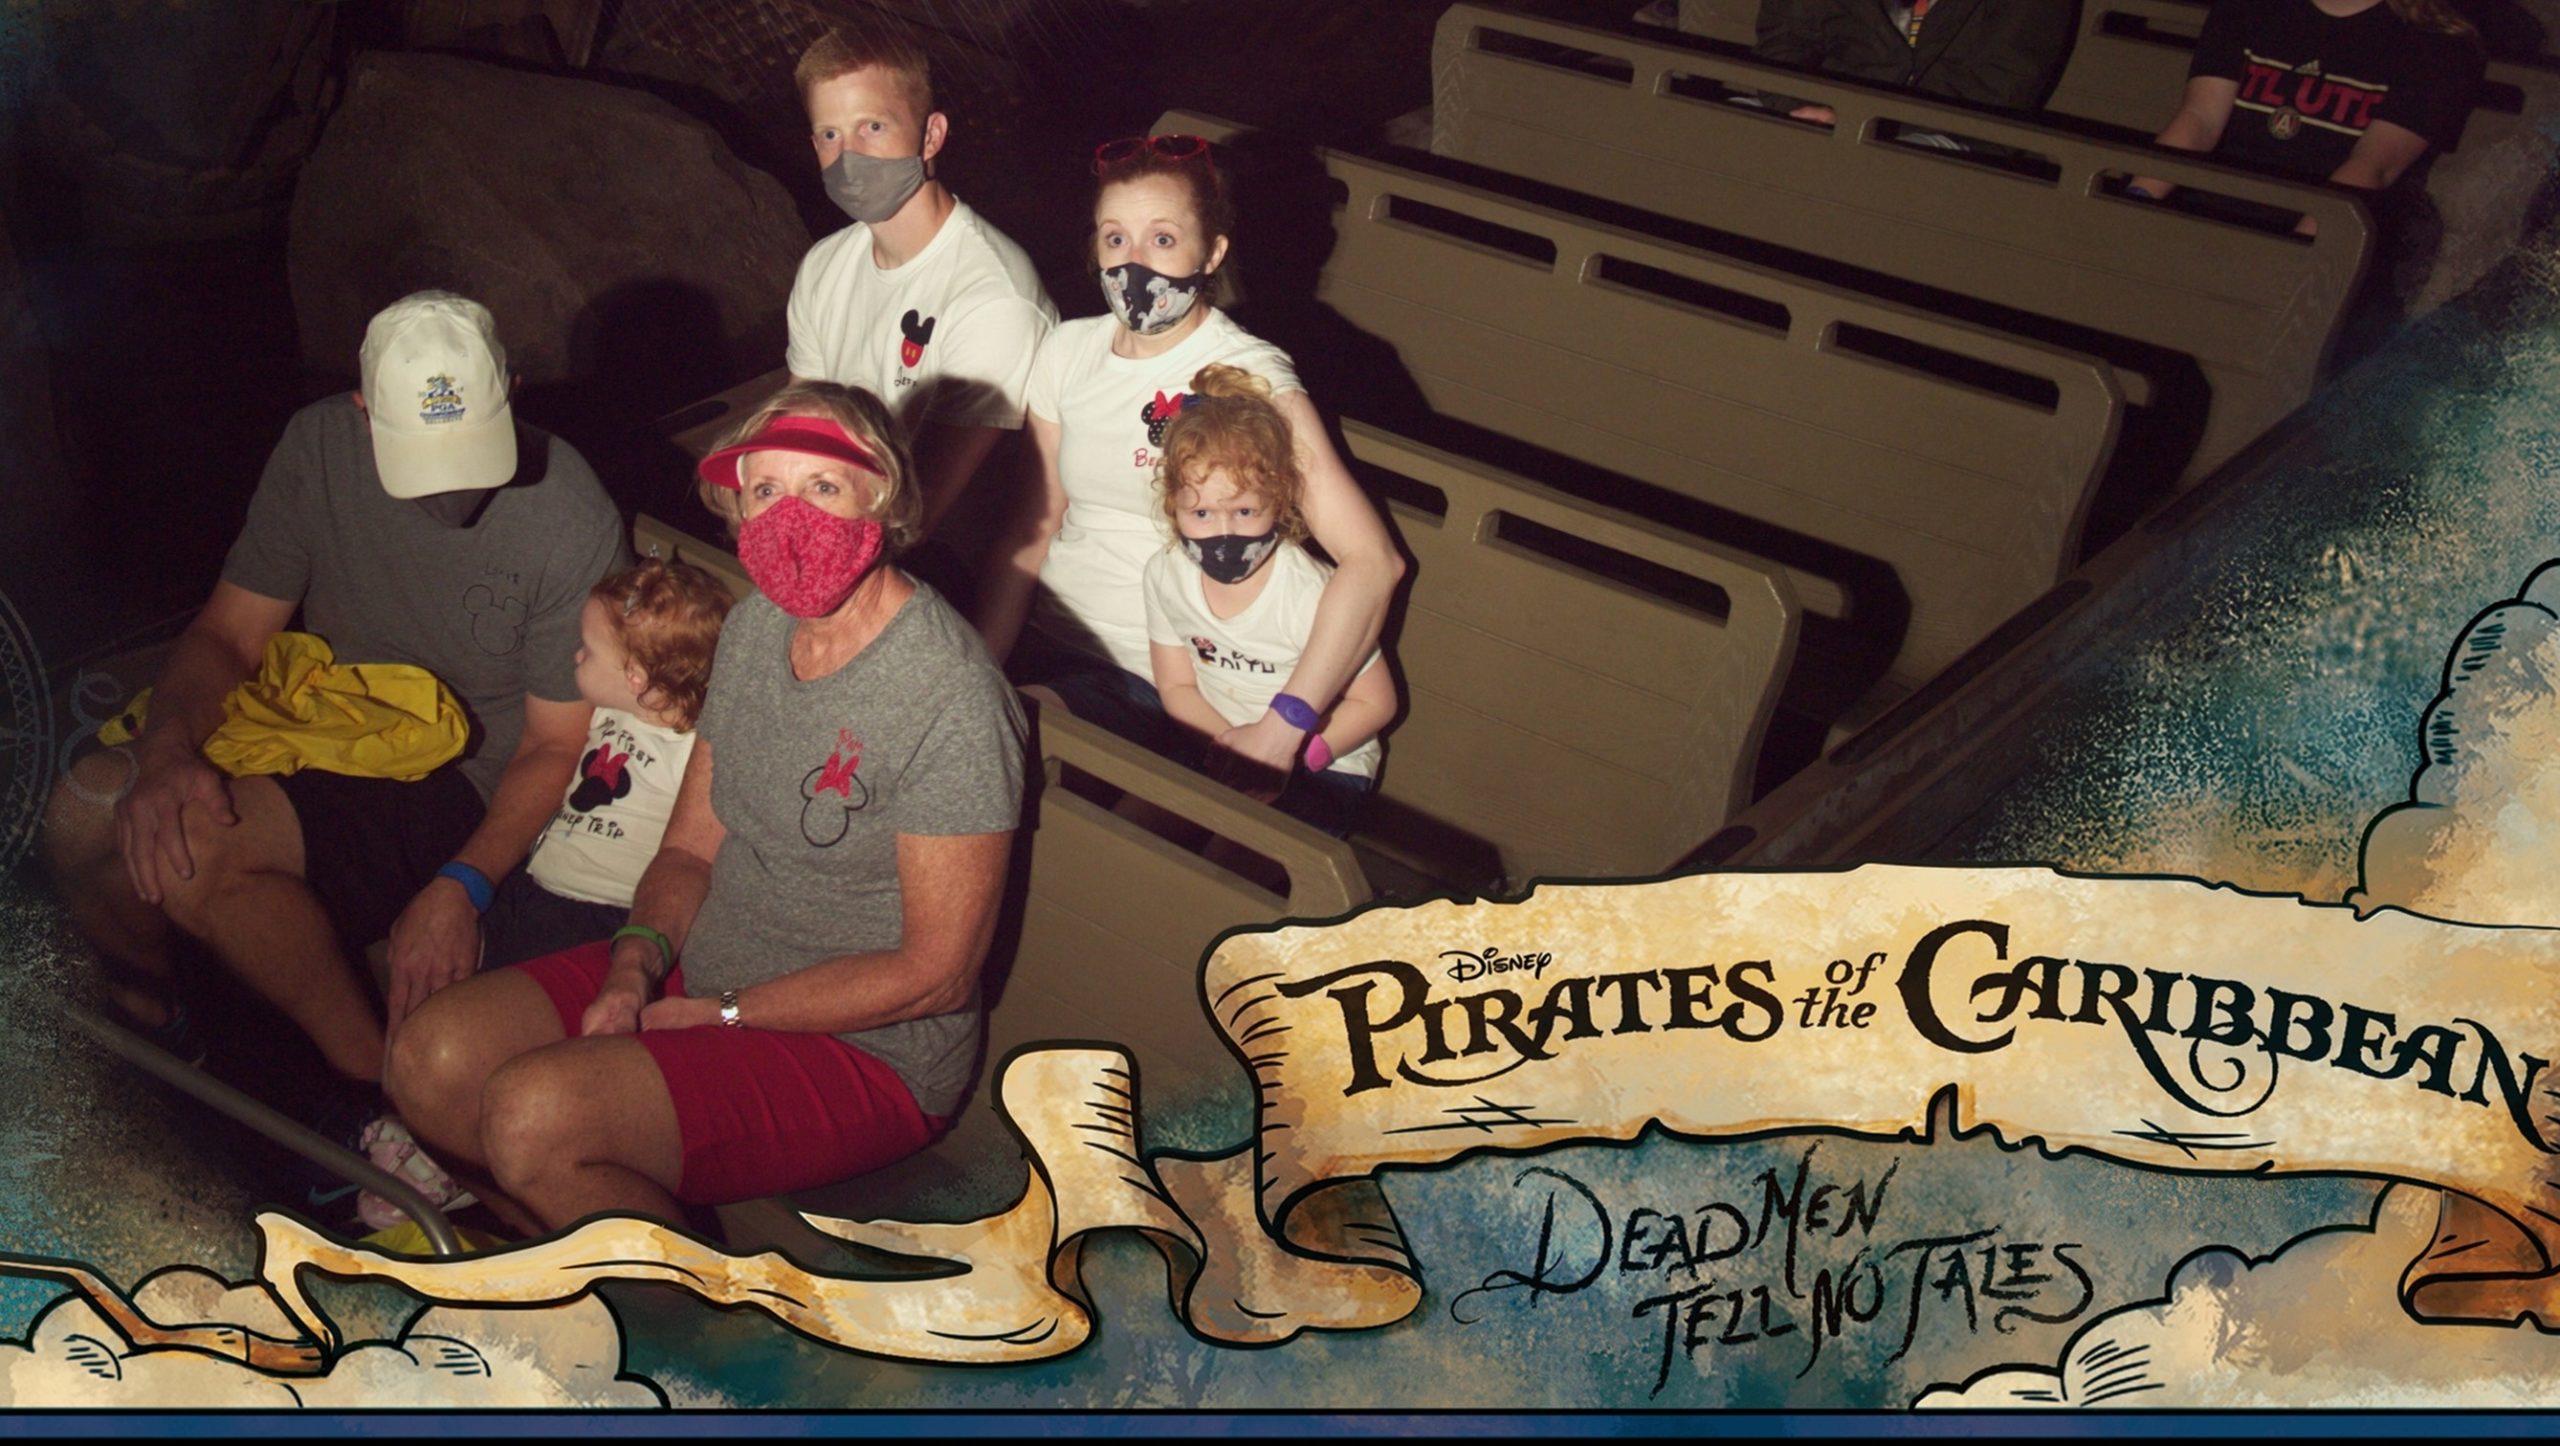
The worst offender was Pirates of the Caribbean, which was unexpectedly down for over 18% of the week, including being down 62% of the day on October 4th. Oof. Not far behind was Splash Mountain, which was offline for almost 16% of the week. On its worst day – once again, October 4th, it lost 47% of its capacity. The “most unavailable” attraction that isn’t at Magic Kingdom was Rise of the Resistance, which was only down 10% of the week, which isn’t terrible compared to its history.
Rope Drop Downtime
Here are this week’s problematic offenders:
- Magic Kingdom: Splash Mountain (unavailable for 60% of its first hour of the day), Pirates of the Caribbean (unavailable for 57% of its first hour of the day), and Seven Dwarfs Mine Train (unavailable for 27% of its first hour of the day)
- EPCOT: Frozen Ever After (unavailable for 27% of its first hour of the day), and Test Track (unavailable for 21% of its first hour of the day)
- Hollywood Studios: Tower of Terror (unavailable for 27% of its first hour of the day), and Rise of the Resistance (unavailable for 18% of its first hour of the day)
- Animal Kingdom: Expedition Everest (unavailable for 14% of its first hour of the day)
This was a bad week for opening hour at Seven Dwarfs Mine Train. A lot of our touring plans and strategies recommend rope-dropping that attraction … it having a 1-in-4 chance of being down in that first hour is really bad. Have a back-up plan. EPCOT is similar – Frozen Ever After and Test Track are both really excellent rope-drop choices. But not when they’re unreliable and frequently down. I’m not quite as concerned about Hollywood Studios or Animal Kingdom.

Wait Times 10/4 – 10/11
Attractions with the Highest Average Wait at each park
- Hollywood Studios: Rise of the Resistance, average posted wait time of 93 minutes (81 last week)
- Animal Kingdom: Flight of Passage, average posted wait time of 102 minutes (58 last week)
- EPCOT: Frozen Ever After, average posted wait time of 77 minutes (55 last week at Remy’s Ratatouille Adventure)
- Magic Kingdom: Seven Dwarfs Mine Train, average posted wait time of 71 minutes (60 last week)
All of these average wait times across a week are at least 10 minutes higher than they were last week. EPCOT’s is over 20 minutes higher, and Flight of Passage is almost double its average from last week! Last week was a bit of an anomaly thanks to the hurricane closures impacting travel and crowds, but even still – wait times are much higher than in September.

Parks with the Highest and Lowest Average Wait
These parks likely won’t change week-to-week unless something ridiculous happens, but these data points will give us a high-level view of how wait times are trending from week to week.
- Highest: Hollywood Studios, average park-wide posted wait of 47 minutes (last week 40 minutes)
- Lowest: Magic Kingdom, average park-wide posted wait of 28 minutes (last week 23 minutes)
Thanks to those lower-crowd party days, Magic Kingdom continues to have the lowest average wait times. But even party days can’t save it from having wait times trend higher. And an average posted wait for every attraction at Hollywood Studios up over 45 minutes is pretty remarkable. That’s a lot of waiting.
Most Inflated Posted Wait Times
We all know that Disney inflates their posted wait times on purpose. They have many reasons for doing this. Some are totally understandable, and some are potentially more problematic. We can figure out how much posted wait times are being inflated by comparing submitted actual wait times from the Lines App and the posted wait time when the person timing their wait entered the line.
From October 4th through 10th, actual wait times in the Lines App averaged 67% of what was posted. So if the posted wait time was 20 minutes, you could’ve expected to wait just over 13 minutes instead.
But the worst offender for the week was Pirates of the Caribbean. At this one attraction, submitted actual wait times were 53% of posted wait times. That means if Pirates of the Caribbean had a 30 minute posted wait, you probably would’ve waited less than 16 minutes. Just over half of what was posted. Remember to always check the Lines app for predicted actual waits instead of believing what is posted.

Looking Ahead: October 11th through October 17th
Since it takes time to pull data and write a post, you’ll be reading this on the 12th when the 11th is already in the past. But we’re staying as close to real-time as possible.
This week … crowds should be levelling off a bit after the long weekend this past week. Fall breakers should have done their things. Crowds will still be above average, but not crazy high. The one exception to this is at Magic Kingdom on October 12th. Parties on the 10th, 11th, 13th and 14th mean a lot of people crushing into the park on that one day.
There are also some storms and rain in the forecast on the 12th and 13th, which means more attraction downtime. All the more reason to avoid Magic Kingdom!
You May Also Like...
-

How did park closures and airport shakeups impact crowds in the parks in the past week? And what can we expect…
-

New blog series, who dis? We know that you come to TouringPlans because of all of our data. And other than…
-

Well, this is a fun and weird week for our second-ever Disney Data Dump! We'll see next week how Hurricane Ian…
-

A small bit of DCL news dropped today with dates for sailings in late April and May 2022 for the Disney…
We were there from 10/7-10/10 and our plan worked out wonderfully! The party day at MK was glorious: 7DMT was running at early rope drop, and the CL4 was fantastic. We got through everything we wanted to do in time to take the cranky 5 year-old back at 1:30. The only issue was that we consistently got earlier times for G+ returns than the averages predicted on your chart… still, a good problem to have!
Becky, thanks for all of your work on this data… it was a godsend this trip!
So glad that your trip went well! And that you made the smart move and visiting MK on a party day 🙂
And totally hear you on the return times. Trying to balance adjusting to lower demand with understanding that demand may pick back up as we head later into fall (although variable pricing may negate that).
I’m very curious how variable pricing is going to effect Genie+. I’m going to hypothesize very little. Even at the maximum advertised price of $22 (plus tax), that’s “just” an extra $28 per day over the current price for a family of four, or just short of $200 if that family of four uses it everyday for a week. If the family is already spending thousands (or in some cases, tens of thousands) of dollars on a Disney trip, what’s $200 more?