
Disney Data Dump September 17 2025
It looks like our post-Labor Day lull is starting to shift. Nothing wild yet. It’s still September, after all. But the week brought some subtle changes that are worth paying attention to. Party days at Magic Kingdom are making their impact felt again, and there are signs we’re inching toward the busier fall season. Let’s dive into the data together!
Observed Crowd Levels September 9 – 15
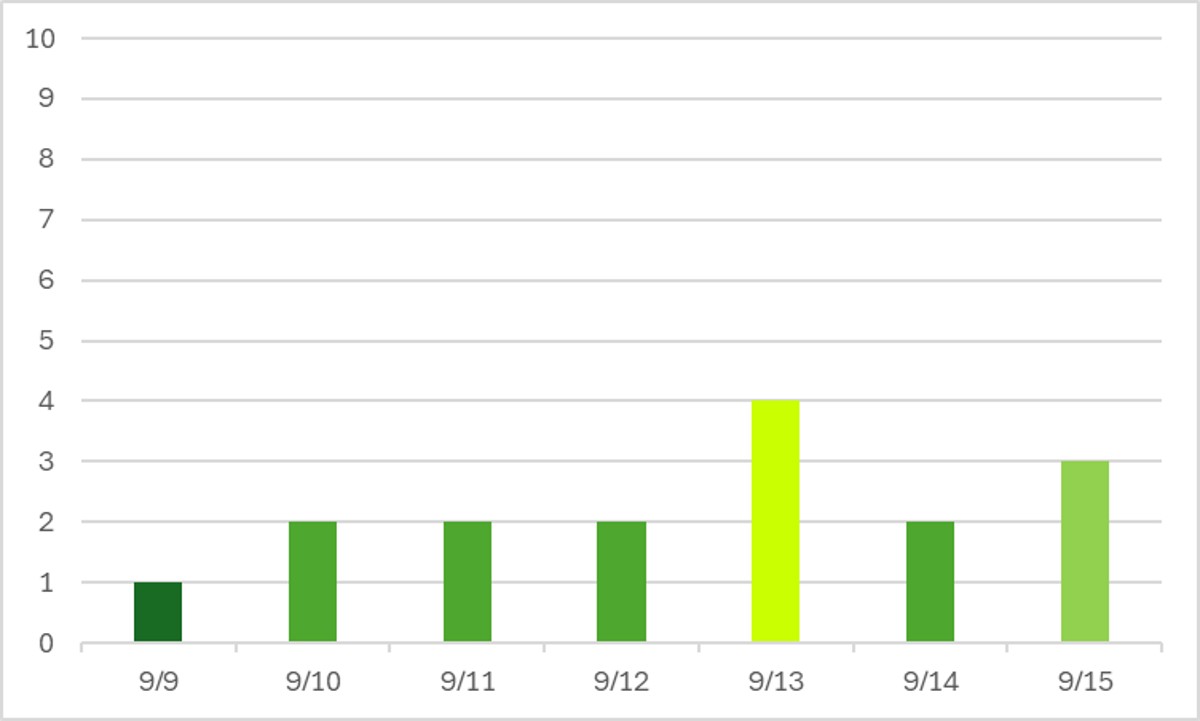
Things have clearly started to pick up following our post-Labor-Day lull. Started to pick up. Nothing crazy. But instead of one day above a crowd level 2, we’ve got … two. This hides a little bit of the real story, though. We can only see it if we dig a little bit deeper to the park-level data.
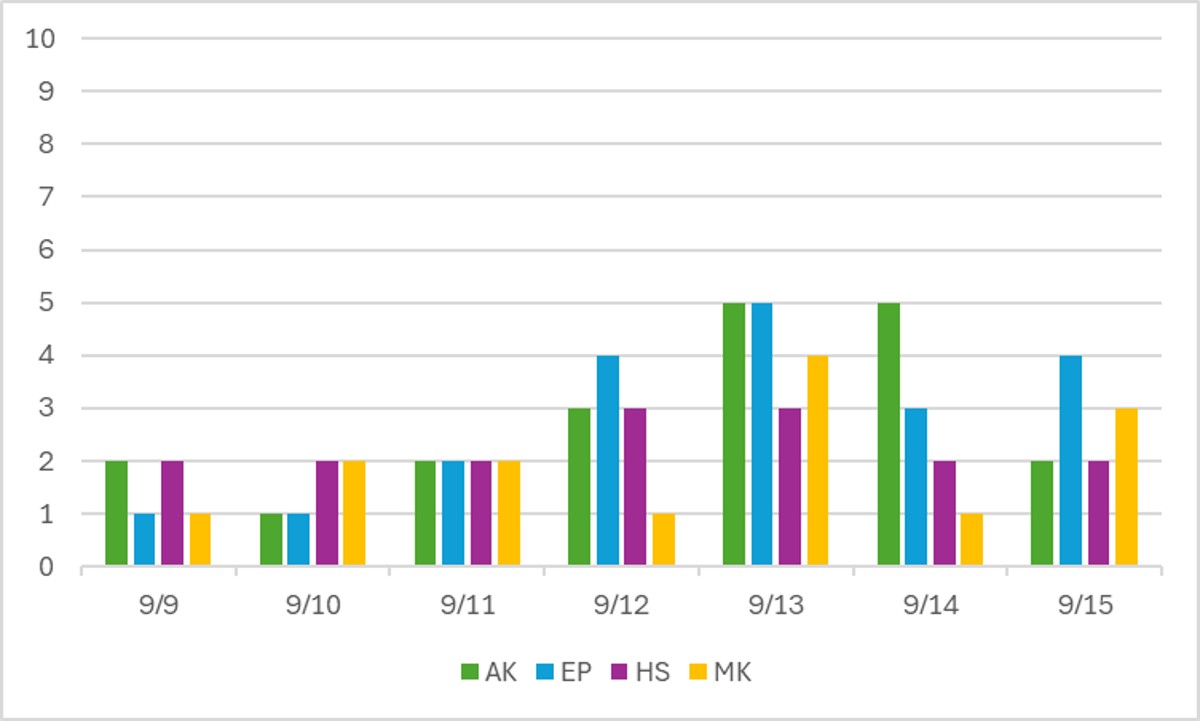
Those first three days of the past week all look very similar. But then starting the 12th, something shifts – lots of higher crowd levels at various parks. Crowds have also picked up enough that we see the return of party day behavior more clearly than we have in the past couple of weeks. What were the party days in the past week? Any day that Magic Kingdom had a crowd level 1 – the 9th, 12th, and 14th.
Performance of Crowd Level Predictions
Each week, I give you a very transparent look into how the TouringPlans crowd level predictions performed. Each day at each park is one data point, so each week we have 28 different crowd level predictions to evaluate. Any time a prediction is within one or two crowd levels, things won’t really “feel” much different than what was predicted. Being off by 3 or more crowd levels is where you might feel that difference in wait times throughout the day.
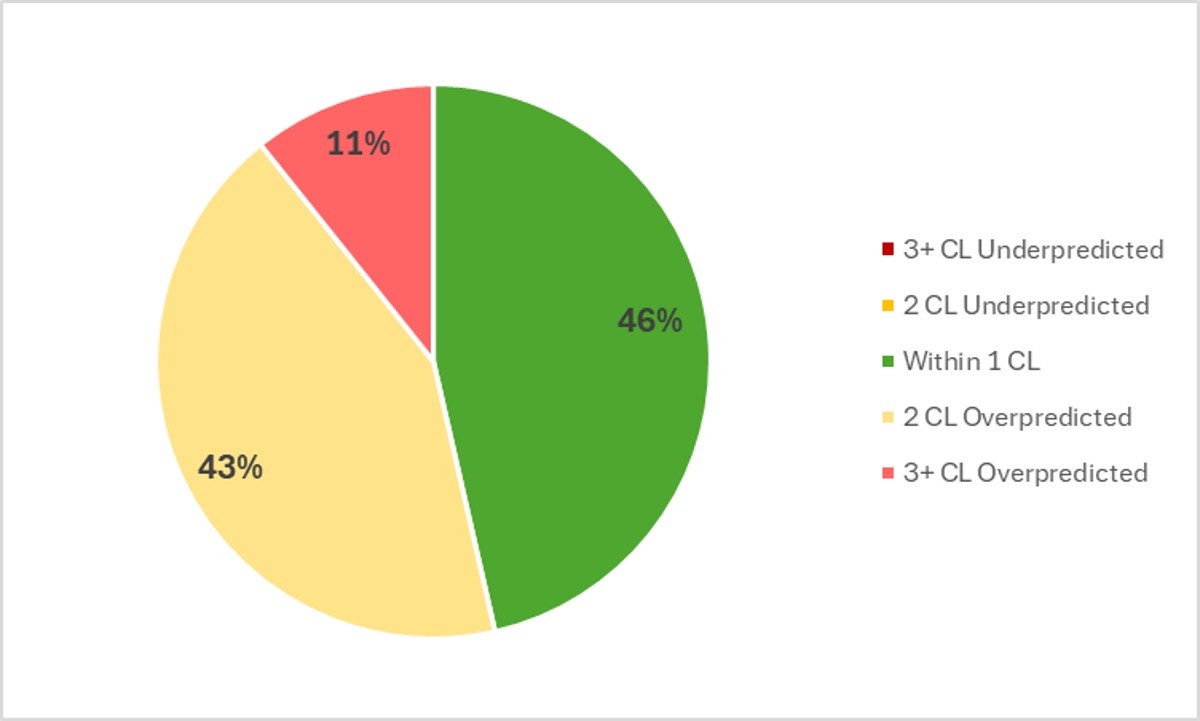
In the past week, Touring Plans predictions were either spot-on or within 1 crowd level 46% of the time, which is slightly better than last week. 89% of the time Touring Plans predictions were within 2 crowd levels, so that means we get a B+ for our predictions in the past week. On average, the crowd level at any park any day of the week was 1.6 crowd levels below prediction. That’s close to within the margin of error of not being able to “feel” a difference. The three biggest misses of the week were all at Magic Kingdom on non-party days. There just aren’t enough people to create huge non-party day crowds … yet. On the 10th and 11th MK was predicted to be at crowd level 6 and it ended up being a 2. On the 15th, MK was predicted to be crowd level 8 and it was only a 3. Those non-party day crowds will eventually get to be that crowded. There just aren’t enough people in Orlando right now to make it happen.
Attraction Downtime September 9 – 15
If we average all of the capacity lost due to unexpected downtime over the past week, it comes out to 3.2% of attractions unexpectedly being down. That’s well below our historical average, so that’s even more great news for people taking advantage of low crowds this September. No hurricanes, very low downtime, and very low wait times. Can’t beat that. In the past week, EPCOT was the park with the most overall downtime, averaging 3.8% of its capacity lost to downtime throughout the week. That might be the lowest park-wide “winning” number that we’ve ever had, so really it was a good week everywhere. Hooray!
The worst day for attraction downtime in the past week was on September 9th. On that day, 5% of all capacity at WDW was lost due to unexpected downtime. The worst park-day of the week was also predictably on the 9th, and at our park with the most downtime – EPCOT. On that day, 9% of its attraction capacity was lost due to unexpected downtime. EPCOT was open for 12 hours on the 9th, so 9% downtime is the equivalent of the entire park shutting down for approximately 65 minutes.
Attraction Downtime Worst Offender
In the past week, Seven Dwarfs Mine Train was the WDW attraction with the worst overall downtime. It was unexpectedly down for 16% of the past week. The worst day at 7DMT was on September 12th, when it was down for 35% of the day. But it was down for 34% of the day on the 14th too.
Test Track’s downtime ticked back up to 15% this week (up from 13%), but that’s still better than its post-reopening average of 20+%, so we’ll take it!

Rope Drop Downtime
Here are problematic offenders from the past week, with the percentage of downtime during the first hour of the day in parentheses:
- Magic Kingdom: Tiana’s Bayou Adventure (32%), Haunted Mansion (27%), Seven Dwarfs Mine Train (19%)
- EPCOT: Frozen Ever After (23%), Living with the Land (17%)
- Hollywood Studios: Rise of the Resistance (23%), Millennium Falcon (16%), Runaway Railway (10%), Tower of Terror (10%)
- Animal Kingdom: DINOSAUR (26%)
Mixed bag of results this week. Sadly, we’ve got no gold stars. But our lists at Magic Kingdom and EPCOT aren’t nearly as they have been in past weeks. And Slinky Dog Dash and Rock’n’Roller Coaster dropped off the list at Hollywood Studios too! Not our easiest rope drop week ever, but certainly not the hardest either.
Wait Times September 9 – 15
Attractions with the Highest Average Posted Wait at Each Park
- Hollywood Studios: Rise of the Resistance, average posted wait of 74 minutes (was 61 minutes last week)
- EPCOT: Test Track, average posted wait of 66 minutes (was 65 minutes last week)
- Magic Kingdom: TRON, average posted wait time of 52 minutes (was 48 minutes last week)
- Animal Kingdom: Flight of Passage, average posted wait time of 52 minutes (was 42 minutes last week)
Not a shock that wait times at headliners went up by a little bit this past week. Honestly, it would have been difficult for them to get any lower. Still, only three headliners in any park (Rise, Test Track, and Cosmic Rewind) had average posted waits that were over an hour. Expect that to change as we head further into fall.
Parks with the Highest and Lowest Average Wait
These parks likely won’t change week-to-week unless something crazy happens, but these data points will give us a high-level view of how wait times are trending from week to week.
- Highest: Hollywood Studios and EPCOT, average park-wide posted wait of 29 minutes (was 26 minutes at Hollywood Studios last week)
- Lowest: Magic Kingdom, average park-wide posted wait of 18 minutes (was 15.5 minutes last week)
This is the first time ever in the history of the Disney Data Dump that we’ve got a tie for highest average wait time! EPCOT and Hollywood Studios both had park-wide average waits of 29.16 minutes, so there was no way to break the tie. Overall, everything is still under half an hour, with is a good marker of low crowds.
Most Inflated Posted Wait Times
We all know that Disney inflates their posted wait times on purpose. They have many reasons for doing this. Some are totally understandable, and some are potentially more problematic. We can figure out how much posted wait times are being inflated by comparing submitted actual wait times from the Lines App and the posted wait time when the person timing their wait entered the line.
Over the past week, actual wait times in the Lines App averaged 66% of what was posted. That’s slightly lower than our historical average. Overall, if the posted wait time at a popular attraction was 60 minutes, you could’ve expected to wait just under 40 minutes instead.
But the worst inflation offender for the past week is Star Tours. At this one attraction, submitted actual wait times were only 38% of posted wait times in the past week. That means that if Star Tours had a 20 minute posted wait, you probably would have actually only waited less than 8 minutes instead. Much less than half of what was posted! Remember to always check the Lines app for predicted actual waits instead of making decisions based on what is posted.

This Week’s Wait Time Rock Star
Between September 9th and 15th, we had just under 1300 timed actual waits submitted through the Lines app. The one person who recorded the most actual waits during that time was chris wolstencroft, with 51 overall timed waits – 1 Lightning Lane wait, 48 standby waits, and 2 single rider waits. Thanks for all of that timing, chris wolstencroft! It unfortunately does not compete with the the 97 timed waits in a single week from our current timing champion, preef.
Looking Ahead: September 16 – 22
I write this article on Tuesday evenings so that you all have the very freshest of data on Wednesdays. That means the 16th will already be in the past by the time you’ve read this, so welcome back to the future!
There is once again absolutely no reason to believe that the parks should see a large influx of visitors this week. But we are on a slow march upward until we hit early October when fall breaks start. I’d expect things to stay in the crowd level 2-4 range overall. There are Magic Kingdom parties on the 16th, 19th, and 21st (and 23rd, although that’s technically in the next week). We’re getting into the season of more parties instead of less parties, which means we’ll see more of that non-party day crowd spike behavior. Especially on the 20th and 22nd.
We’re still knocking on all of the wood for an oddly light hurricane season. And as we look at the forecast for this week, after a week of plenty of sunny skies, we’ve got scattered afternoon thunderstorms returning. No major rain-outs though.
I’ll be in the parks this weekend, so wave hello if you see me! I plan on riding Cosmic Rewind all day on September 21st, before heading over to my first ever Mickey’s Not So Scary Halloween Party later that night. Pictures to come in next week’s edition.
And finally, an official Disney Data Dump birthday shoutout to my little kid. May this next year be filled with plenty of magic (and break dancing).
Were you in the parks this past week? Or are you headed to Orlando soon? Let me know in the comments below!
You May Also Like...
-

If you’re looking for the quietest time of year to be in Walt Disney World, here it is. The week after…
-

If you like your parks hot, sticky, and gloriously empty, this was the week for you. The end-of-August slump showed up…
Happy birthday, Big Kid!