Disney World Crowd Calendar Update – July 2014
Every day we track all things Disney, including park hours, park schedules, FastPass+ usage and rules, plus weather and dozens of other factors. We also track how these factors affect your wait times in the parks.
Today we’re publishing an update to the Crowd Calendar for the rest of 2014 and early 2015, taking into account Disney’s recent schedule changes and the effect FastPass+ is having on wait times.
Here’s a snapshot of one of our updated models in action:
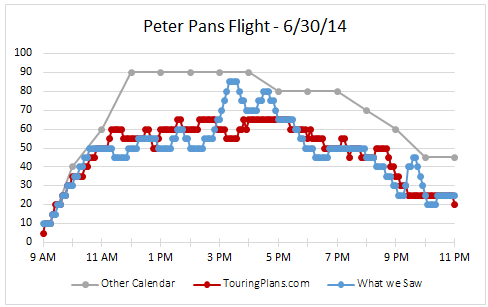
You can check these charts every day for every attraction to see what we predicted and what actually happened in the park. It’s the most accurate Disney crowd calendar available.
Below you’ll find more detail on the what went in to this latest Calendar update. Here’s a quick summary of the changes to the calendar by month:
| Dates/Parks | Here’s What’s New |
|---|---|
| Aug 1-18 | We felt our estimates for the first few weeks of August were too low, especially at The Studios. Now that we have adjusted our 1 to 10 scale, park levels are up one or two levels across the resort, three or more at The Studios. |
| Aug 18-25 | The ‘6’s, ‘7’s and ‘8’s we had at Animal Kingdom in mid-August were too high given the wait times we have seen in the last few months. Those are now ‘3’s, ‘4’s and ‘5’s. |
| Sep 17- Oct 4 |
Crowd Levels during Epcot’s Food & Wine Festival are a perennial oddity. Waits times are low but the park is packed with guests. This update features some increases to Epcot’s crowd numbers in the fall to better match how the park feels. |
| Oct 27- Nov 22 |
Similarly, this update features increases of 3 or more index levels for Epcot and the other parks in late October and November (before Thanksgiving). Most of these are a result of the redistribution of our ‘1’ to ’10’ scale. |
| Jan 2015 – May 2015 | We have reviewed our projections for park schedules in 2015 and combined with our other adjustments, this has pushed many of the crowd levels up 3 or more notches, most notably at The Studios, to a lesser extent at Animal Kingdom and Epcot and rarely at Magic Kingdom. |
And the other things that went into this calendar update:
| Summary of the new schedule |
|---|
Most MK evening EMHs move to Saturday from Friday
Epcot’s evening EMH move to Wednesday during Food & Wine
Disney Hollywood Studios’ evening EMH is still Monday during Summer and January 2015, moves to Sunday for the fall
Animal Kingdom’s morning EMH is now spread evenly over Sunday, Monday, Wednesday and Friday
Magic Kingdom
Morning EMH on Thursday stays the same
Evening EMH has shifted from Sunday to Saturday for vast majority of weeks. There are only 4 evening EMHs on Sunday from July through January, typically around holidays:
- July 6, 2014 (July 4 Holiday weekend)
- August 31, 2014 (Labor Day weekend)
- December 21, 2014 (Week of Christmas)
- January 11, 2015 (WDW Marathon Weekend)
There’s also the usual extended hours around July 4 and Christmas. On July 4 and again on a couple of days in December, MK will have both morning and evening EMHs.
Epcot
Morning EMH on Tuesday stays the same
Evening EMH on Friday for most of the year EXCEPT during Food & Wine, when it switches to Wednesday.
Disney Hollywood Studios
Morning EMH on Saturday stays the same
Evening EMH on Monday stays the same for July and August, one date in October and two in November, 2014. Switches to Sunday for most of September, October, November, and a two dates in December, plus one in January 2015.
Animal Kingdom
Still no evening EMHs
Morning EMHs here have the most changes. Monday and Wednesday are still popular days for EMHs. By month, here’s the schedule:
- August 2014 – Sunday/Wednesday (with one Friday)
- September – Monday/Friday (with one Sunday, one Wednesday)
- October – Monday/Friday (with one Sunday)
- November – Half Sunday, Half Monday, most Wednesdays, one Friday
- December – Monday/Wednesday (with one Sunday, one Friday)
- January 2015 – Sunday/Wednesday (with one Monday)
| Standby waits shorter for Super Headliners, longer for Major Attractions |
|---|
FastPass+ has changed the way guests are distributed throughout the park. For a complete article on the effect of FastPass+, check out Steve’s blog. In general, standby wait times are lower at attractions that were popular with Legacy FASTPASS (the old way) and standby wait times are higher at attractions that either did not have Legacy FASTPASS or were less popular as FASTPASS options. So, for example, Space Mountain, Soarin’, Toy Story Mania and Kilimanjaro Safaris are seeing lower waits, while Pirates of the Caribbean, Spaceship Earth and Dinosaur are shower higher waits.
Interestingly, when you look at all days, the average wait time is going down but the minimum wait time is going up. This means the distribution of wait times is flatter and the distinction between crowds is getting smaller.
| Park Hours, Event Schedules, Parades, Fireworks, etc. |
|---|
Today’s update accounts for all the events and schedules that we believe may have an impact on crowds in the parks.
| Crowd Numbers Up, Especially at The Studios |
|---|
Since FastPass+ has affected the wait times in the park we need to adjust the thresholds that define the ‘1’ to ’10’ scale so that our numbers match how the crowds feel in the parks. Previously, for example, a busy day would see an average posted time of Toy Story Mania around 105 minutes.
Today we expect that same level of crowd would see an average around 85 minutes. We want to make sure that we have a reasonable number of days at each level. So, we have made some adjustments. You can see how we define our scale here. This way, the numbers are still comparable, so if you visited in 2012 on a level ‘5’ day, the new level ‘5’ will feel pretty much the same.
| More data, more research, better results |
|---|
We are always testing new statistical models to predict wait times. This allows the models to adapt to changing crowd patterns, and ensures we publish the most accurate estimates possible. (Also because we’re suckers for doing things as well as we can with the coolest statistical tools available. It’s a problem.)
For advice on what to do if the calendar numbers have changed for your scheduled visit, see here.
You May Also Like...
-

The April Crowd Calendar update only has minor changes. We are halfway through spring break, and crowd levels have been in-line…
-

All four Disney World Parks are now open and crowd levels can be described in one word. Low. Every day has…
-
After a slight delay to this month's update, we are ready to refresh the Disney World Crowd Calendar. 2020 So Far…
-
Crowded theme parks during the Christmas holiday are as certain as death and taxes. Every year we see crowd levels hit…
It is somewhat disappointing that there is no follow-up to this article–obviously, there are MANY of your users that are concerned by the Crowd Level changes. We want a better “Why” some parks jumped as many as 5 points than “we looked at some things and made some changes”.
Thank you for the update – I am a little confused about early February 2015, which shouldn’t be too crowded before the President’s Week Break… for example: Feb 8th has Aniaml Kingdom at a level 10…is there an event or something going on there that day? That seems very high.
I appreciate that you are continually trying to make the model as good as it can be. I expected Sept to go up when f&w was extended and then the park hours changed, I didn’t even think about fpp and how that would impact the levels. Thank you for staying on top of all the factors that impact touring. Keep up the good work.
We have a trip booked/planned for this September, and almost every day of our trip the “park to visit” seemed to change with the new updated crowd calendar. Makes me nervous since I have already planned all our dinners, etc. around the “old calendar”…some days jumped 3 points!! Why the sudden change?
I still don’t understand how April/May 2015, allegedly a slow-ish time of year, now has above-average crowds. If this time of year is showing 5-8s, should we expect 13s and 14s on Easter weekend/prime of summer/Christmas week?
Crowd levels heavily influence when I attend–which is why I was looking at this time of year. Should I look for another time to visit the parks?
I received an email about our trip in Oct 8-13 that I am tracking and those days were elevated some 2-3 points. That time frame is not mentioned in the post above so what insight do you have as to the ramp up for that time frame? Is it the Disney Princess Cup Soccer Tournament? Just curious. We have been numerous times at different times of year and we went from 3’s and 4’s to 5’s and 6’s on your latest update. Thanks.