Disney World Crowd Report – October 26 to November 1, 2014
Crowd predictions performed well last week at Walt Disney World with only one of our park level estimates missing by more than two index levels. Halloween crowds were lighter than year’s past although wait times did spike for some attractions on certain days.
Let’s look at how the crowd levels stacked up each day last week:
| WHAT WE THOUGHT |
WHAT WE SAW |
ANALYSIS | |
|---|---|---|---|
| Magic Kingdom |
2
|
4
|
‘4’s and ‘5’s across the resort on Sunday with most predictions within normal error ranges. Magic Kingdom was slightly busier than a normal Party day in late October but attractions like Big Thunder Mountain had reasonable average waits (33 minutes, predicted 32). |
| Epcot |
5
|
4
|
|
| Hollywood Studios |
4
|
5
|
|
| Animal Kingdom |
4
|
5
|
|
| WHAT WE THOUGHT |
WHAT WE SAW |
ANALYSIS | |
| Magic Kingdom |
5
|
6
|
Magic Kingdom guests took advantage of the longer park hours on Monday, pushing wait times a little higher than the day before. Meanwhile, all three other parks averaged wait times that hit the lowest third on our scale. |
| Epcot |
5
|
3
|
|
| Hollywood Studios |
4
|
3
|
|
| Animal Kingdom |
4
|
2
|
|
| WHAT WE THOUGHT |
WHAT WE SAW |
ANALYSIS | |
| Magic Kingdom |
2
|
2
|
Tuesday’s crowd at Magic Kingdom was the lowest of the week with average wait times like 15 minutes at Buzz Lightyear (predicted 21) and 19 at Pirates of the Caribbean (predicted 18). |
| Epcot |
5
|
4
|
|
| Hollywood Studios |
3
|
4
|
|
| Animal Kingdom |
4
|
3
|
|
| WHAT WE THOUGHT |
WHAT WE SAW |
ANALYSIS | |
| Magic Kingdom |
3
|
5
|
Wednesday’s crowd level was a ‘1’ at Animal Kingdom, the lowest at that park since September. We saw averages of 12 minutes at Dinosaur (predicted 25) and 13 at Expedition Everest (predicted 24). |
| Epcot |
5
|
4
|
|
| Hollywood Studios |
4
|
3
|
|
| Animal Kingdom |
3
|
1
|
|
| WHAT WE THOUGHT |
WHAT WE SAW |
ANALYSIS | |
| Magic Kingdom |
4
|
2
|
For the second day of the week, no park had a crowd level above ‘4’. Thursday’s average wait times were 41 minutes at Peter Pan’s Flight (as predicted) and 19 at Kilimanjaro Safaris (predicted 22). |
| Epcot |
6
|
4
|
|
| Hollywood Studios |
4
|
3
|
|
| Animal Kingdom |
3
|
3
|
|
| WHAT WE THOUGHT |
WHAT WE SAW |
ANALYSIS | |
| Magic Kingdom |
3
|
4
|
Happy Halloween! We would not have been surprised if a Friday Halloween brought larger crowds than usual for October 31 but wait times actually stayed below expectations across the resort. |
| Epcot |
6
|
3
|
|
| Hollywood Studios |
4
|
4
|
|
| Animal Kingdom |
3
|
4
|
|
| WHAT WE THOUGHT |
WHAT WE SAW |
ANALYSIS | |
| Magic Kingdom |
3
|
5
|
Saturday’s wait times were the highest of the week, by far. All headliners at Animal Kingdom averaged waits higher than 25 minutes. |
| Epcot |
5
|
4
|
|
| Hollywood Studios |
5
|
5
|
|
| Animal Kingdom |
4
|
6
|
|
| November 2 to 8, 2014 |
|---|

Halloween is over, November has begun. We don’t expect crowds to be significantly large until the Wednesday before Thanksgiving. Temperatures will be cooler and the parks will be pleasant for touring.
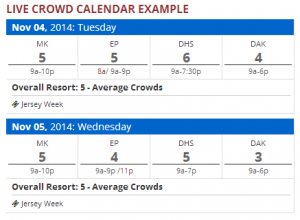
To see Walt Disney World Crowd predictions for the days of your vacation, check the Crowd Calendar.
To get details about our predictions of future crowds or details about crowds in the past check out the Crowd Calendar and select “Jump to Date” on the left margin.


We toured all the parks during this week. It was our first visit and we thought the crowds were fairly busy but very manageable. The crowds at Animal Kingdom especially seemed very light. It was a great week to visit.