2025 Disneyland Crowd Calendar Retrospective
We’re almost to the end of January, and that means that we need to wrap up all of our crowd calendar retrospectives so that we can start looking forward to the year ahead! We’ve already reviewed the results from Walt Disney World, and from Universal Orlando. That leaves us with Disneyland. How did the Touring Plans predictions fare compared to actual crowds on the west coast?
Explain the Math!
If you take a peek at the Disneyland crowd calendar, you’ll notice that each park-day is given a predicted crowd level on a scale from 1 to 10. Crowd level 1 days are the least crowded of the year, and crowd level 10 days are wall-to-wall humans everywhere you look. These are the predicted crowd levels.
Then, after a park day happens, we can measure all of the wait times at every attraction in every park and determine what the actual crowd level was for that day. By subtracting the difference between the actual and the predicted crowd level, we can get an easy measure of how accurate our predictions were.
In this case, I’ll subtract the predicted crowd level from the actual crowd level. For example, if we predict a crowd level 10 at California Adventure, but the day ends up being a crowd level 8, the difference is -2. We overpredicted the crowds by 2. But if we predict a crowd level 4 at Disneyland and the day ends up being a crowd level 7, the difference is 3. We underpredicted the crowds by 3.
In general, you’re not going to feel any difference in your park day if predictions are off by just one crowd level. Within 1 crowd level is the goal. Really anything within 2 crowd levels I’ll call “fine”. Missing by 3 or more crowd levels is a big miss, and that’s the type of thing it’s best to avoid.
2025 Performance Compared to Previous Years
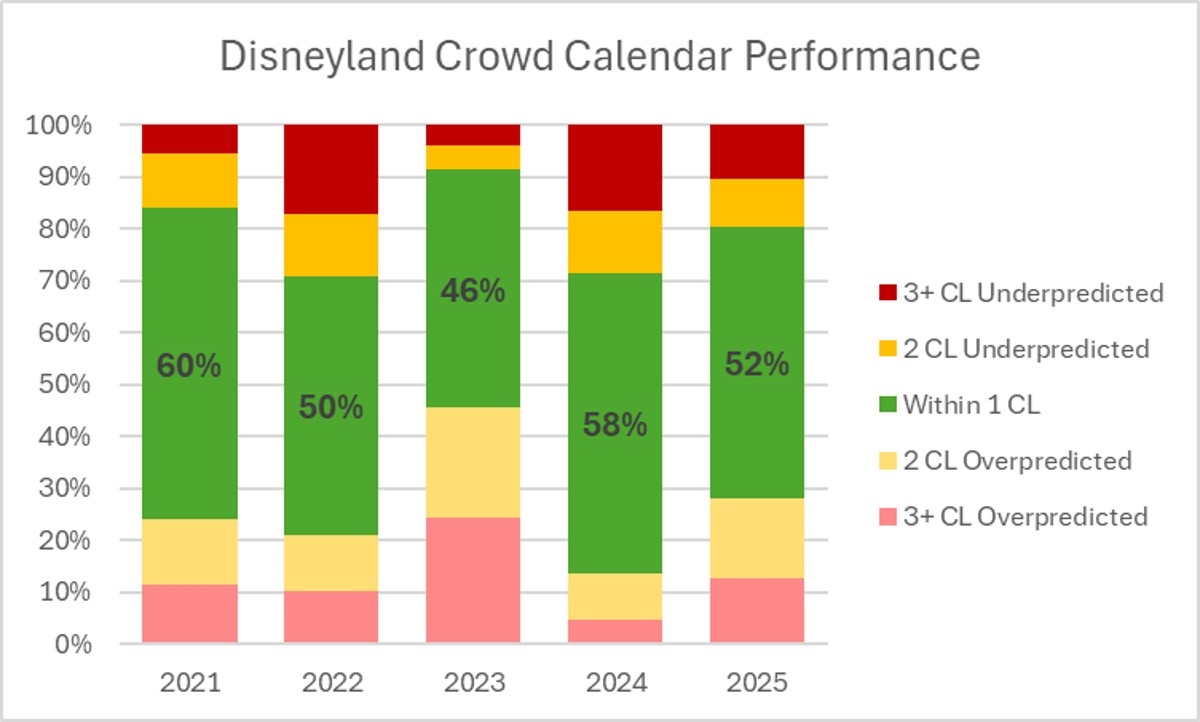
In an ideal world, that green bar in the middle of each column would be 100% every year. Touring Plans would have perfect predictions that matched reality, everyone would trust them all of the time, and we’d all be so happy. The problem is … this isn’t an ideal world. Humans are unpredictable. And humans make the operational decisions for Disneyland, and humans are the ones that decide whether to visit Disneyland or not. Plus, Touring Plans tries to not change the predicted crowd levels constantly so that people planning have some stability. So there’s a lot working against perfect predictions. Even still, we all want that green bar in the graph to be as big as possible. And we especially want the red and pink bars (missed by 3 or more crowd levels) to be as small as possible.
What about the other bars? Well, in general, people are pleasantly surprised if the parks are less crowded than they expect (aka, Touring Plans overpredicted). And they’re unpleasantly surprised if the parks are more crowded than they expect (aka, Touring Plans underpredicted). But Touring Plans is full of math nerds, and nerds want distributions to be centered (aka, just as many underpredictions as overpredictions). Still, during a retrospective, I’m going to recognize and acknowledge that all of our lovely customers are going to be less full of rage if the stats folks can keep those underpredictions to a minimum.
2025 was not a terrible year. In fact, it comes in third place out of the past five years for overall accuracy. Right in the middle of the pack. And predictions were much less skewed than either of the previous two years – there was an almost equal number of underpredictions and overpredictions.
2025 Performance Compared Across Parks
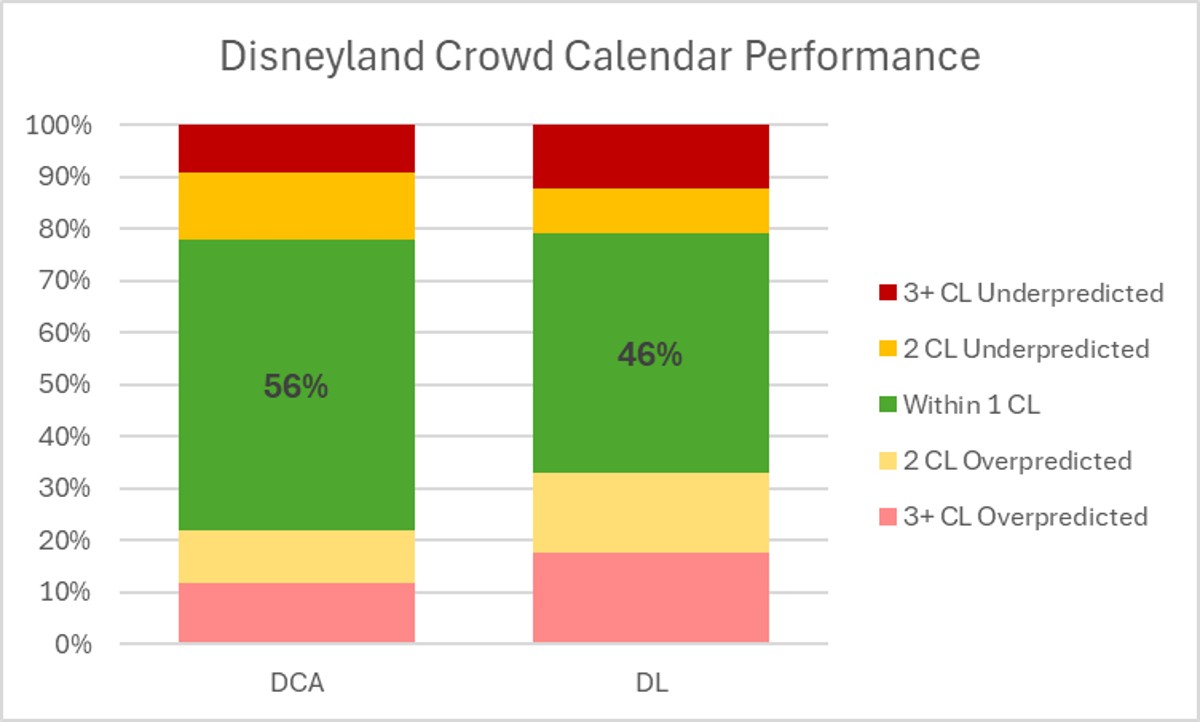
In order to understand what went right (or wrong) in 2025, we need a little more information. Let’s go down one level and look at how predictions performed at each park rather than the resort as a whole. This is significantly easier at Disneyland, compared to Disney World, since there are only two parks.
We can pretty quickly see that predictions for Disneyland were more “off” than those for California Adventure – which is similar to what happened the past two years. The green bar for Disneyland is decently smaller (46% within 1 crowd level compared to 56%), and it has significantly more overpredictions. This is interesting because last year it had many more underpredictions. At least this is the “happier” kind of error. California Adventure is much more centered.
Calendar Retrospective of Crowd Calendars
What better way to review calendars than with more calendars?! I know I love making and coloring calendars in Excel so that probably means you love the results. We’ll go with that.
I’ll start here with California Adventure, where predictions had the highest accuracy, provide my commentary, and then move to Disneyland. We can discuss park-specific issues, as well as trends that I notice affecting both parks.
California Adventure
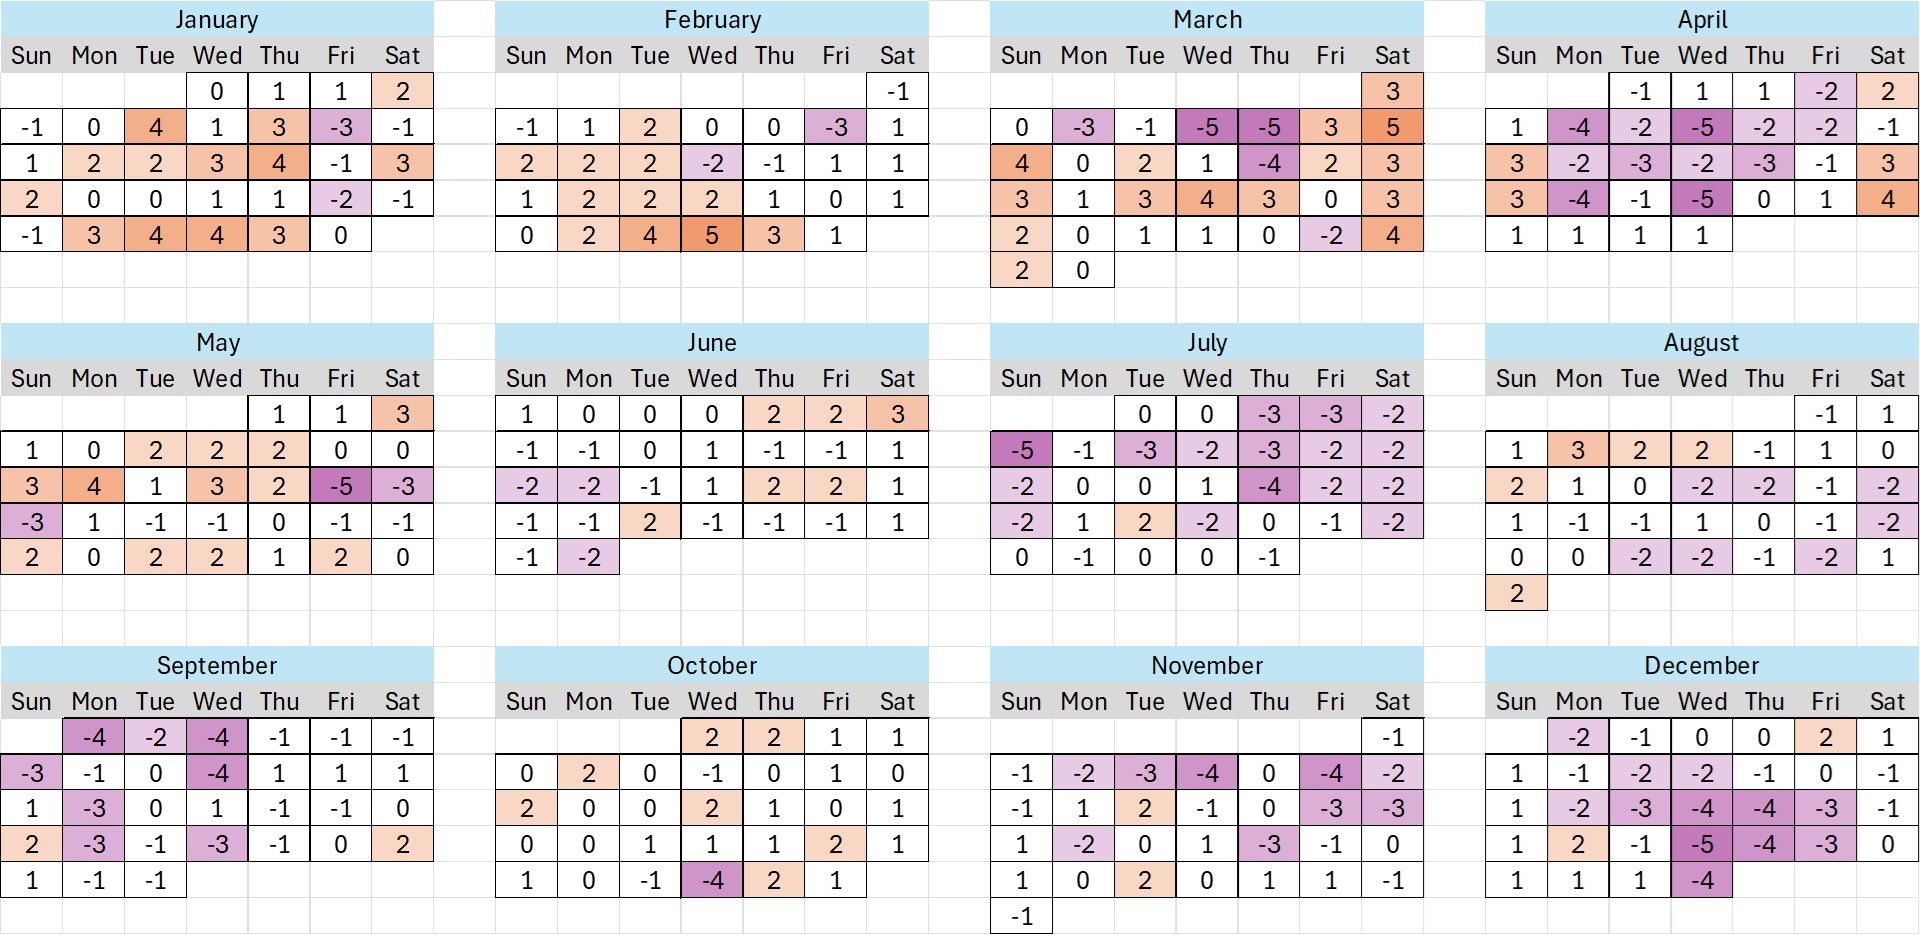
Compared to last year, we’ve got fewer dark colors on this calendar. So that’s something! And a couple of patterns start to emerge here too. January, February, and weekends in March/April were more crowded than expected. Early May was too.
But then June and August were mostly in line with predictions, and July was wildly undercrowded compared to predictions. Most of September didn’t live up to crowd expectations either. October evened out, but then most of November and December were less crowded than expected.
These trends aren’t as wild as what is happening over at Walt Disney World, but it does prove the shift of summer being the new off-season on both coasts.
Disneyland
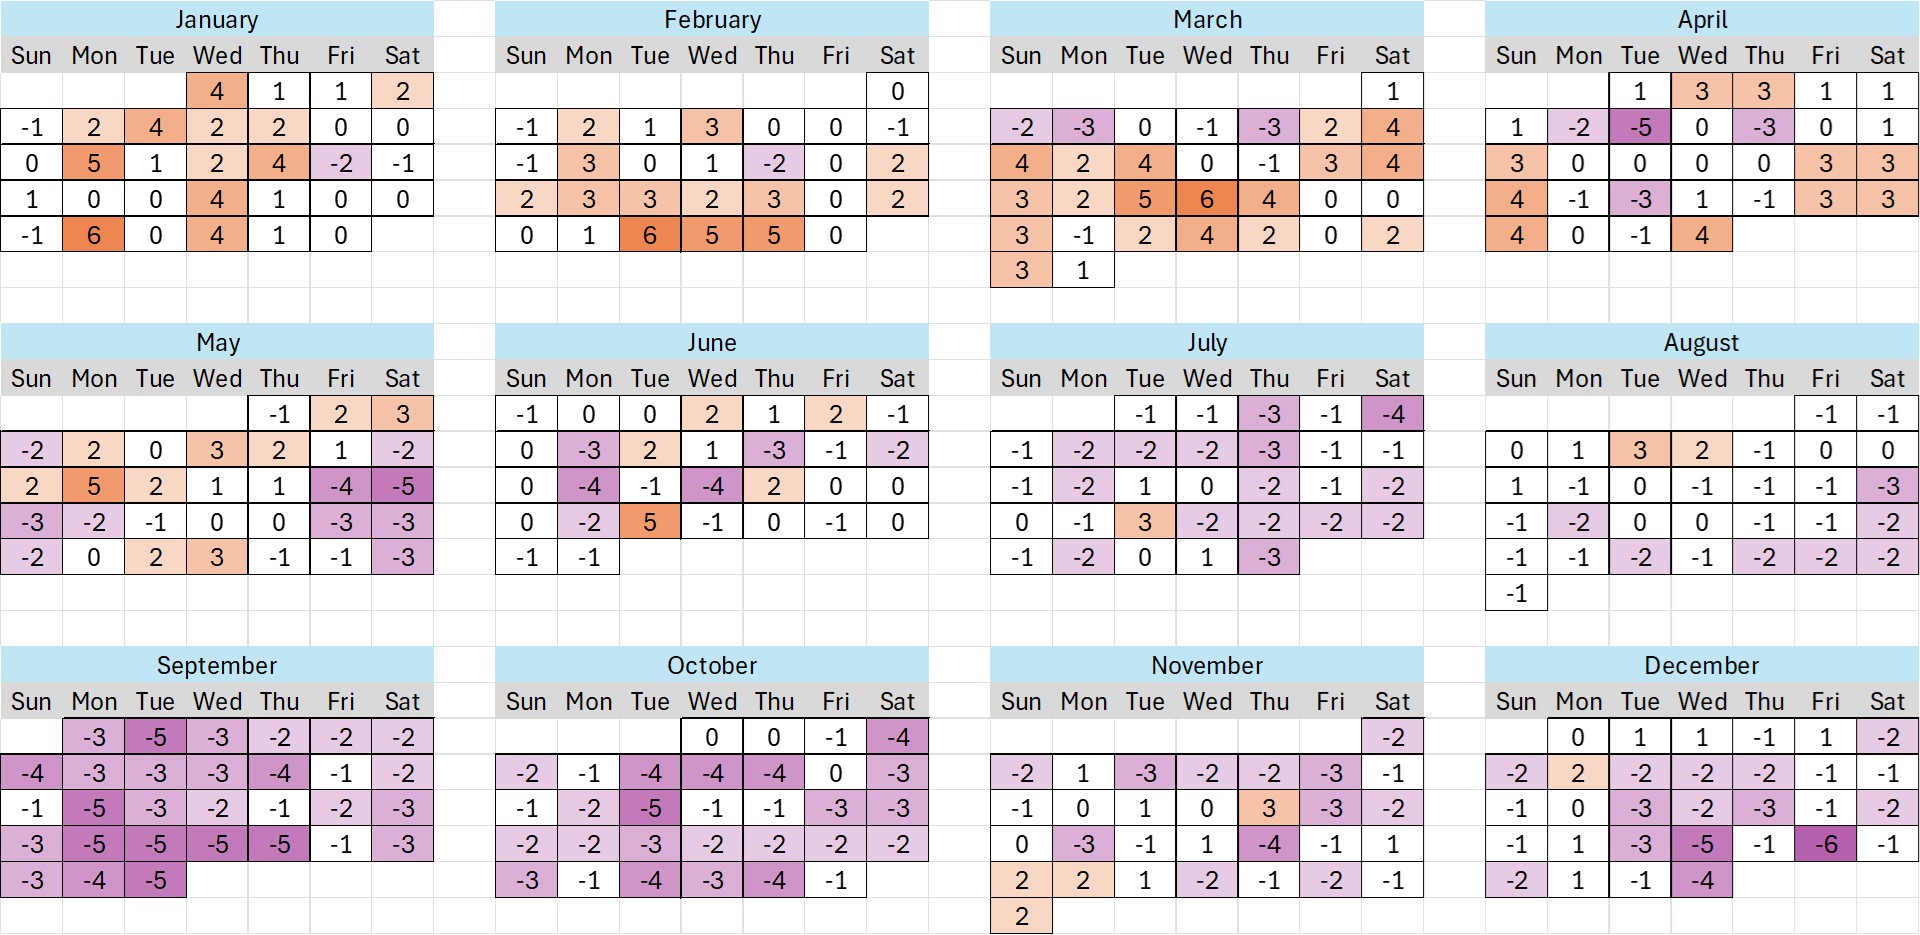
This calendar is very different from the one from last year. Specifically, much less orange. The one exception to that is the beginning of the year. Like California Adventure, Disneyland was more crowded than expected from January through April.
Then in May, the tables start to turn. Weekends in May were significantly less crowded compared to predictions. June was a mixed bag, but the whole rest of the year is a bunch of purple. That means lots and lots of overpredictions.
Did you experience any of these major overpredictions or underpredictions at Disneyland or California Adventure? Do you have any hypotheses about the trends in months that were much more or much less crowded than expected? Let us know below!
You May Also Like...
-

We’re almost to the end of January, and that means that we need to wrap up all of our crowd calendar…
-

Since January 1, 2024 crowd levels at Disneyland Park have been seven-tenths (0.7) of a point lower than predicted, on average.…