
2022 Crowd Calendar Retrospective for Universal Orlando
Welcome to the third week of 2023, when we’re finally getting around to reviewing how our crowd calendar predictions performed for the Universal Orlando parks. Because we need to be fair to Universal! We already reviewed Walt Disney World predictions extensively. And Universal is just as important, or so some of my good friends tell me. So let’s put on our Velocicoaster caps, drink a Butterbeer, and explore all of that Universal math.
Explain the Math!
If you take a peek at the Universal Orlando crowd calendar, you’ll notice that each park-day is given a predicted crowd level on a scale from 1 to 10. Crowd level 1 days are the least crowded of the year, and crowd level 10 days are wall-to-wall humans everywhere you look. These are the predicted crowd levels.
Then, after a park day happens, we can measure all of the wait times at every attraction in every park and determine what the actual crowd level was for that day. By subtracting the difference between the actual and the predicted crowd level, we can get an easy measure of how accurate our predictions were.
In this case, I’ll subtract the predicted crowd level from the actual crowd level. For example, if we predict a crowd level 10 at Islands of Adventure, but the day ends up being a crowd level 8, the difference is -2. We overpredicted the crowds by 2. But if we predict a crowd level 4 at Universal Studios Florida and the day ends up being a crowd level 7, the difference is 3. We underpredicted the crowds by 3.
In general, you’re not going to feel any difference in your park day if predictions are off by just one crowd level. Within 1 crowd level is the goal. Really anything within 2 crowd levels I’ll call “fine”. Missing by 3 or more crowd levels is a big miss, and that’s the type of thing it’s best to avoid.
2022 Performance Compared to Previous Years
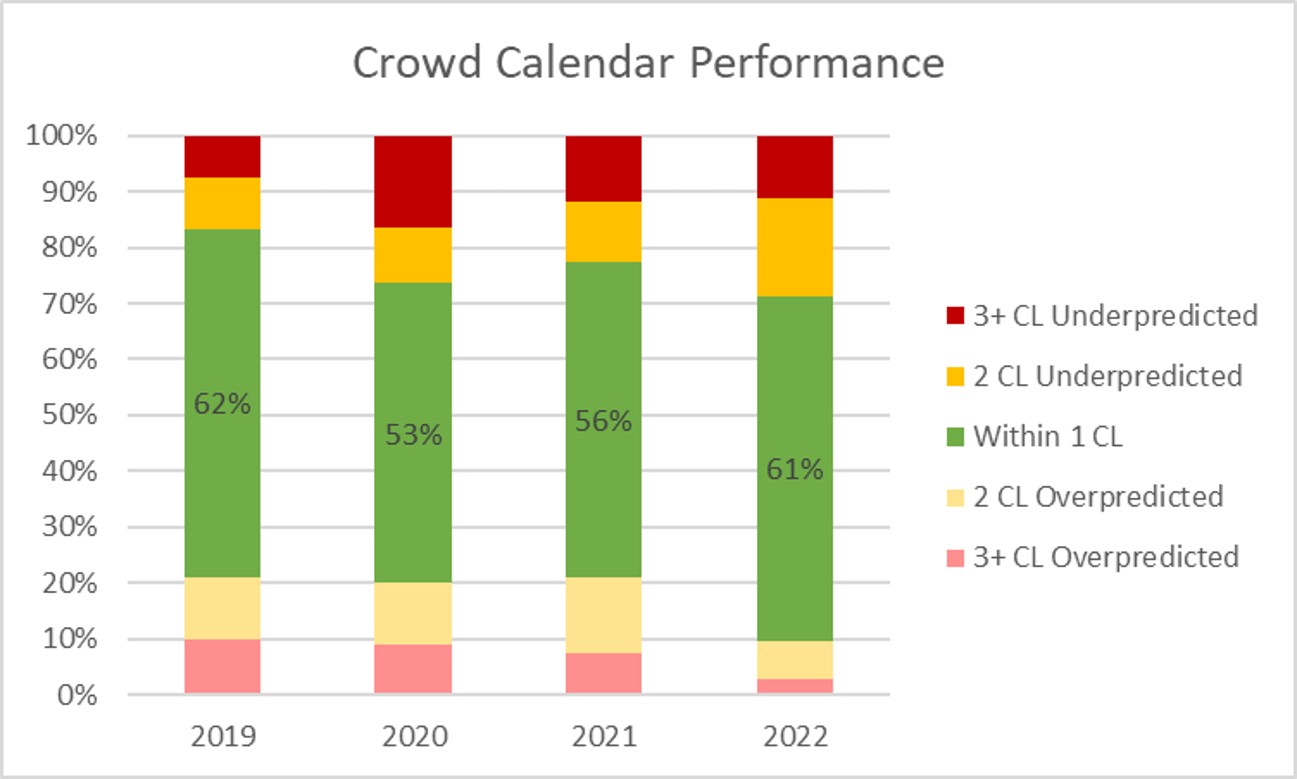
In a perfect world, that green bar would be 100% every year. Touring Plans would have ideal predictions that perfectly matched reality, everyone would use them reliably, and we’d all be best friends forever. The problem is … this isn’t a perfect world. Humans are unpredictable. And humans make the operational decisions for Universal Orlando, and humans are the ones that decide whether to visit Universal Orlando or not. Plus, Touring Plans tries to not change the predicted crowd levels constantly so that people planning have some stability. So there’s a lot working against perfect predictions. Even still, we all want that green bar in the graph to be as big as possible. And we especially want the red and pink bars (missed by 3 or more crowd levels) to be as small as possible.
What about the other bars? Well, in general, people are pleasantly surprised if the parks are less crowded than they expect (aka, Touring Plans overpredicted). And they’re unpleasantly surprised if the parks are more crowded than they expect (aka, Touring Plans underpredicted). But Touring Plans is full of math nerds, and nerds want distributions to be centered (aka, just as many underpredictions as overpredictions). Still, during a retrospective, I’m going to recognize and acknowledge that all of our lovely customers are going to be less full of rage if the stats folks can keep those underpredictions to a minimum.
2022 doesn’t look so bad if we’re paying attention to the size of that green bar in the middle. Predictions were within one crowd level 61% of the time. That’s better than the previous two years and close to the same as it was pre-pandemic-chaos, back in 2019. Unfortunately, our results are much more skewed this year than any of the previous three years. Touring Plans’ predictions underestimated crowd levels by 2 or more crowd levels 29% of the time and only overestimated crowd levels by 2 or more crowd levels 10% of the time. 3 times as much underestimating as overestimating isn’t great.
2022 Performance Compared Across Parks

In order to understand what went right (or wrong) in 2022, we need a little more information. Let’s go down one level and look at how predictions performed at each park rather than the resort as a whole. This is significantly easier at Universal, compared to Disney, since there are only two parks (I’m excluding water parks from the conversation).
We can very easily see that the majority of the problems with prediction results come from Islands of Adventure, and not Universal Studios Florida. Not only is its green bar smaller (56% within 1 crowd level compared to 67%), but it’s also much more “skewed”. At Universal Studios Florida in 2022, Touring Plans overpredicted by 2 or more crowd levels 182% of the time, and underpredicted by 2 or more crowd levels 15% of the time. Not perfect, but pretty even. At Islands of Adventure, Touring Plans only overpredicted by 2 or more crowd levels 7% of the time. On the other hand, we underpredicted by 2 or more crowd levels 37% of the time. This skewed-ness exactly matches what we saw at Hollywood Studios, so that’s interesting.
Also intriguing – Universal Studios Florida is the best-performing park for predictions out of any park at Walt Disney World or Universal Orlando.
Calendar Retrospective of Crowd Calendars
What better way to review calendars than with more calendars?! I know I love making and coloring calendars in Excel so that probably means you love the results. We’ll go with that.
I’ll start here with Universal Studios Florida, where predictions had the highest accuracy, provide my commentary, and then move to Islands of Adventure. We can discuss park-specific issues, as well as trends that I notice affecting both parks.
Universal Studios Florida

First things first – look at that gorgeous July! Every single day within 1 crowd level. That’s astounding, and I give the Touring Plans crew a round of applause. Well done on a reliable July.
If we rewind back to the beginning of 2022, we see the same Omicron-related crowd reduction that we saw over at Walt Disney World. This isn’t surprising, since that impacted all travel, including theme parks. The rest of the spring and summer looks pretty good too. There are quite a few three-day-ish strings of either underpredicting or overpredicting crowds. So there were some micro-trends of crowds behaving in ways that weren’t predicted well. Still, lots of white.
Then, in August there is a string of three underpredictions of 4 crowd levels in a row, with an underprediction of 3 at the end. This is a bizarre little micro-trend in its own right, but that week was significantly more crowded than expected. The increase in crowds lasted through most of September and October – lots more orange in those months compared to purple.
In November, the trend reverses. Suddenly Universal Studios Florida is generally less crowded than expected. And in December things even back out.
Islands of Adventure

The results at Islands of Adventure are much different, as we should have expected based on the bar graphs earlier in this article. Lots more orange. In fact, Touring Plans was underpredicting crowds so reliably, that purple “Omicron blip” at the beginning of January is much more muted than at any other park we’ve reviewed so far.
Instead, crowds at Islands of Adventure quickly recover from those early January underpredictions and go very orange for the month of February and most of March. From February 21st through February 24th, Touring Plans predict crowd levels of 5 or 6, and actual crowd levels ended up being 9 or 10. Big difference in wait times, and how crowded the park feels.
Things calmed back down slightly in March and April, but nothing close to what we saw with all of the white boxes at Universal Studios Florida. Then May and June went back to reliable underpredictions, with crowds flooding into Islands of Adventure at a much higher rate than expected.
September was the best-predicted month at Islands of Adventure, with only four days that weren’t predicted within one crowd level. Yay! And October was hit with more over predictions than any other month (excluding January).
Did any of the results of this retrospective surprise you? Were you at Universal Orlando for any of the significant overpredictions or underpredictions? Let me know in the comments!
You May Also Like...
-

Crowd levels at Universal Orlando Resort continue to hit record highs and our wait time models are underpredicting as a result.…
-
Locals are still heading to Universal Orlando Parks at record numbers even though the spring break and Easter season is over.…
-
The Universal Orlando Crowd Calendar is getting an update. We posted similar updates to Walt Disney World and Disneyland Resort earlier…
-
We are more than half way through the fall season at Universal Orlando Resort and it is time for a Crowd…
Why has Touring Plans not adjusted its predictions to compensate for the underpredictions? Let’s take the week following Memorial Day as an example. Touring Plans underestimated IOA on Monday to Friday of that week. They didn’t do too well with USF either. Picking on Memorial Day as an example, Touring Plans observed a 9 at USF and a 6 at IOA in 2022. But TP is predicting a 6 at USF and a 5 at IOA for 2023. I’m not following the logic. What is so different for 2023 that TP is predicting lower crowds than last year? What am I missing?