
New Touring Plan Improvements and Features in 2025
If you’re planning a visit to Disney World this year, we’ve got great news! We’ve been working on new wait-time models and computer-optimized touring plans to help minimize how long you wait in line. This post explains how we’re doing that, and shows how these updates will give you a better experience.
What’s New In our Hollywood Studios Wait Time Models
Wait time models are the foundation of our forecasts for how long you’ll wait in line. We know that Disney inflates wait times for a variety of reasons. Knowing the actual time you’ll wait can give you a better idea of how your day in the parks will go. It can even give you an edge over other guests who are using the posted times to make decisions about where to go next. TouringPlans subscribers can see our predicted actual wait times in the Lines app. And we use those predicted wait times when optimizing your custom touring plans.
We’ve been busy building new models using a different mathematical approach than we’ve used in the past. Everything we’ve seen in our analysis indicates that the first four to six attractions in the morning are the most critical. If we get these right, decisions for the rest of the day become more manageable. So for these new models, we put a lot of emphasis on better wait-time predictions during the first two hours the park is open.
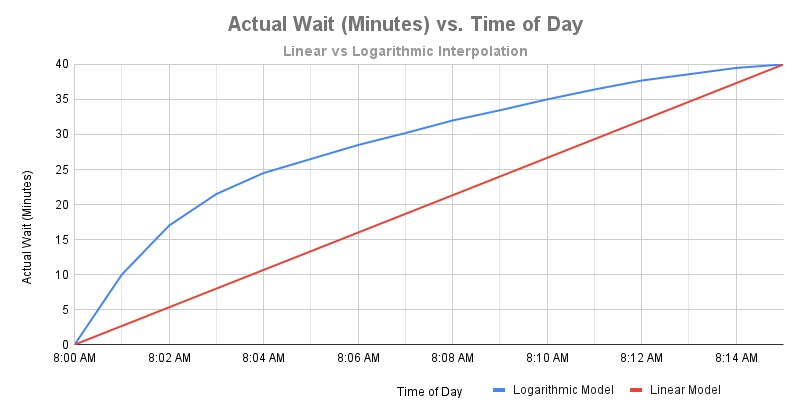
As an example, the graph above shows the difference between linear and algorithmic models for wait time increase right after opening, with a 0-minute wait at 8 a.m. and a 40-minute wait at 8:15 a.m. Just four minutes after park opening a linear model would forecast a wait time of 10 minutes. The logarithmic model would forecast a wait closer to 25 minutes. That’s a big disagreement and shows how important it is to get this right.
Neither of those example models exactly predicts how the lines build in real life, and they don’t tell us about behavior throughout the rest of the morning. We’re building our new models to do better. For our fellow nerds out there, the new models use either Monte Carlo simulation or Fourier transformation. The current models use gradient-boosted trees.
Developing these new models relies on having lots of actual wait times. One of the ways we’re getting those actual wait times is by riding the same ride, all day long. I’m pretty sure I’ve memorized the patterns of all the flooring material in the queue at Peter Pan’s Flight. I don’t want to know how much of the Pirates of the Caribbean water I’ve accidentally ingested.

Wait time submissions for actual waits from Lines users are super-important here too! We can only spend our whole morning riding Toy Story Mania a few times a year. User-submitted times give us a more comprehensive picture over many more days.
Another part of model development includes testing them – and the plans they generate – in the parks. We’ve been doing a lot of that, and we’ll publish one of the plans we’ve found that way here on the blog in the next week.
What’s New In our Touring Plans Software
We’re also updating the software to include a new “We promise we’ll be at the front of the rope-drop crowd” flag for custom touring plans. Currently, if your plan starts at park opening then the software assumes you’re somewhere in the middle of the rope drop group. That’s usually a safe bet. It takes a lot of effort to get up and out the door to be at the very front, and few people choose to do it.

The downside to that assumption is that the software tends not to suggest super-headliners as the first attraction of the day. That’s because being in the middle of that rope-drop group still means a relatively long wait in line. If you’ve made a plan that included Slinky Dog Dash or Seven Dwarfs Mine Train, you might have noticed this.
As an example, let’s consider Rock ‘n’ Roller Coaster and Tower of Terror. A starting strategy that knocks these out as a one-two punch is often better than heading to Slinky Dog Dash. That’s true almost any time you’ll be in the middle or back of the rope drop crowd for Slinky Dog Dash during Early Theme Park Entry. But if you’ll be one of the very first riders for Slinky, then that’s better.
The new rope-drop flag lets you optimize for your touring style. If you check it, you’re telling the software that you’ll do whatever it takes to be at the very front of the initial rope-drop group when the park opens.
What This Means For You
Our goal is to save you time and money on your theme park vacation. We’re constantly working to improve our performance. Disney’s Lightning Lane product lets you cut down your wait time, but the cost can add up. Our custom touring plans help you save time in line too, and a Disney World TouringPlans subscription is just $24.99 per year.
You can still save time with a custom touring plan if you arrive at two in the afternoon. But one of the best ways to save time is to get to the parks early. Our new models do a better job of saving you time in line when you arrive around park opening. And the new rope-drop flag lets us give a better experience to users who want to be some of the very first riders of the day on a park’s attractions.

We’re already updating some of our premium touring plans for subscribers using these new models. We expect to have the models completely rolled out to the custom touring plan software by about the end of March. And along with that, you’ll see the new “rope drop” checkbox appear for your plans.
In the meantime, let me know in the comments below if there’s a specific set of attractions you’d like to see us test. We’re especially interested in touring plans that don’t start at Early Theme Park Entry. Those require much more effort to get right, both from a modeling and computational standpoint, but they’re important for our users who are staying off-site.
You May Also Like...
-

It feels like Disney knows that travelers might be planning vacations as Christmas gifts, because they're dropping Disney World discounts like…
-

In this post we will highlight one of our premium Disneyland Resort touring plans. The Disneyland Late Arrival Touring Plan for Parents with Small…
We’ve passed the end of March. How are things looking for updating the software with the new Rope Drop flag?
Waiting on some code for the app to support it. Should be any day now. Testing on the site has gone well.
New wait-time models are likely to be mid-April. I’m headed out on a cruise tomorrow and didn’t want to release that and leave the country.
I’m so excited to hear about the new Rope Drop Flag! I was just working on custom plans for June and I got frustrated because I KNOW we’ll be at the front of the lines. Will that flag be able to be added prior to the trip, or is it something that we would indicate on the morning of the plan, once we’re actually at the front of the line?
Hey Danielle-
You’ll be able to add it prior to the trip. We’ve been testing the heck out of this across WDW, Disneyland, and Universal. I’m really happy with it.
We should have this out by the end of this month – we’re testing it on the app, along with some other app changes to better support Lightning Lane.
We’re also rolling out our new wait-time models this week. Super excited for y’all to see these changes.
Will the new wait-time models also adjust the predicted crowd levels, or is that a separate adjustment that has to be done?
We’ll re-do the crowd levels separately later this year. We’re still trying to figure out the right number of levels.
A class at Wake Forest is working on this task with us this semester. They’re due to turn in their findings next week. If you’re interested, I’m happy to report back with what they found.
“We promise we’ll be at the front of the rope-drop crowd” flag” – This is a huge addition. I’ve been working around it manually but then sometimes I have to guess should come next.
Could you just make the website quick and responsive like it used to be.
It takes forever to change between calendar and list view in crowd calendar.
It also acts like I’m logged in (box at the top says “Log Out” but when I try to do anything it wants me to log in? Evidently I wan’t logged in. Maybe the site works on a phone but I use a computer and it has gone way downhill.
Thank you for not forgetting about us Disney cheapskates that stay offsite and don’t get early entry nor buy Lightning Lane. You mix two of my favorite things: Disney and math!
I am a Disney cheapskate that used to always stay offsite and occasionally still does. I hear you!
Hey, Len – This is great! You’re so right about being at the front of the rope drop line for SDD. Last week my wife and I were near the back of the pack for resort-guest early entry (we weren’t on our game that day!). Our touring plan said do R&RC and ToT first, but we foolishly decided to do SDD first. Mistake! We waited ~40 minutes. We still got everything in, but we would have been better off sticking with our Touring Plan. Never doubt The Plan!
Thanks Tony!
Yeah, that’s literally the scenario! Too funny. Thanks for using the site!
Thanks Luiz!
I used GPT for a lot of the basic pipelining code – pull this data, filter out that, merge these two things. And for that it was really good. I’m not great with Pandas dataframes, so anything I could do for help was welcomed.
I’d say of the dozen or so independent steps we built, 8 of them worked the first time. (Two were close and two were just, wow, even I know that’s not right.)
I’ve found GPT useful for those sorts of things.
Incidentally, you might be interested in this public github repository we made to answer the question “How many crowd levels are there, anyway?”: https://github.com/TouringPlans/crowd_level_clusters
A lot of that code was from GPT, and GPT does a decent job of explaining what each technique is trying to do. Hope that’s useful!
Really interesting, I’ll take a look into that. Thanks!
So excited to see improvements in the models, congrats on that!
Total nerd curiosity, from someone who works in data platforms, but not data modeling/prediction: do you see any potential benefit in experimenting modeling guests behavior in AI agents and doing simulations with this?
I imagine it could make the model robust to sudden changes, but maybe it’s just a big overkill solution.