
Second Lowest Ride Wait Times in the Magic Kingdom for 2026
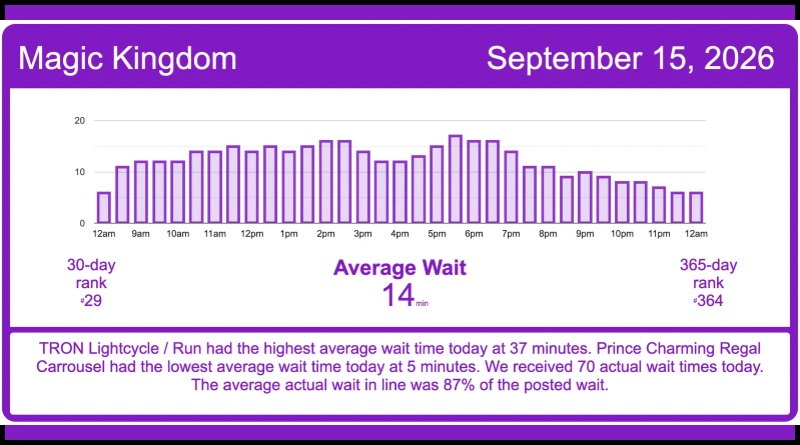
Yesterday, September 15th, saw the second lowest wait times in the Magic Kingdom so far this year.
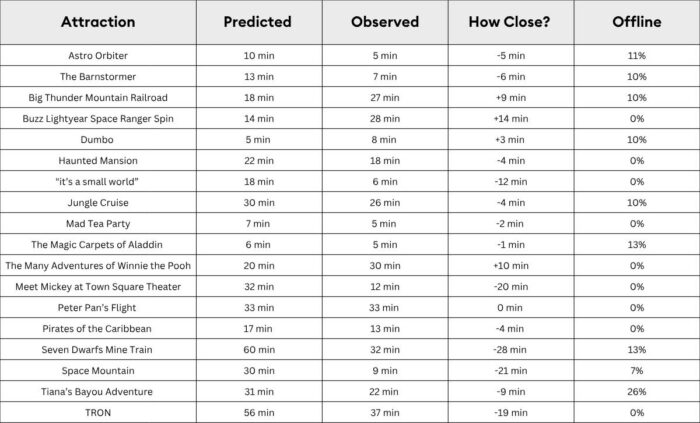
We track wait times for every single ride in all four Disney parks on our website. Our Crowd Calendar page has a rolling 365-day crowd level forecast, too, that includes ride specific wait time predictions.
The image above shows the following by Magic Kingdom attraction:
- TouringPlans predicted wait time average for the day
- Observed actual wait time average for the day
- How close our predicted wait time was to the actual wait time
- Offline %: The percentage of the day the attraction was offline
The average wait time in the Magic Kingdom yesterday was 14 minutes. TRON Lightcycle / Run had the highest average wait time yesterday at 37 minutes. Prince Charming Regal Carrousel had the lowest average wait time of 5 minutes.
The average actual wait in line for the Magic Kingdom attractions was 87% of the posted wait on September 15, 2026
We received 70 actual wait times yesterday via the TouringPlans Lines app! Thank you to every Liner submitting wait times! Actual wait times help us with wait time models and Crowd Calendar forecasts.
What do you think? Would you skip buying Lightning Lanes on a day like yesterday?
You May Also Like...
-
Or, Another Way to Assert Your Disney Dominance in Line We've compiled a list of 21 Magic Kingdom ride vehicles, their…
-

Halloween Horror Nights at Universal Orlando runs select nights through November 1, 2026 from 6:30pm to 2:00am. There are several ticket…
