
Disney Data Dump September 16 2026
Mid-September is doing exactly what mid-September should do: giving us gloriously low crowds, with just enough weirdness underneath the surface to keep things interesting. Magic Kingdom party days are starting to create a very obvious split in wait times, and Animal Kingdom is still doing its best to turn a small number of guests into a much bigger crowd level.
The good news is that downtime finally backed off from the especially ugly results of the past couple of weeks. The less-good news is that Hollywood Studios apparently did not get that memo, especially at rope drop. So this week we’re digging into some lovely September crowd levels, one park making mornings unnecessarily complicated, and why the current low-crowd season is still very much alive and well.
Observed Crowd Levels September 8 – 14
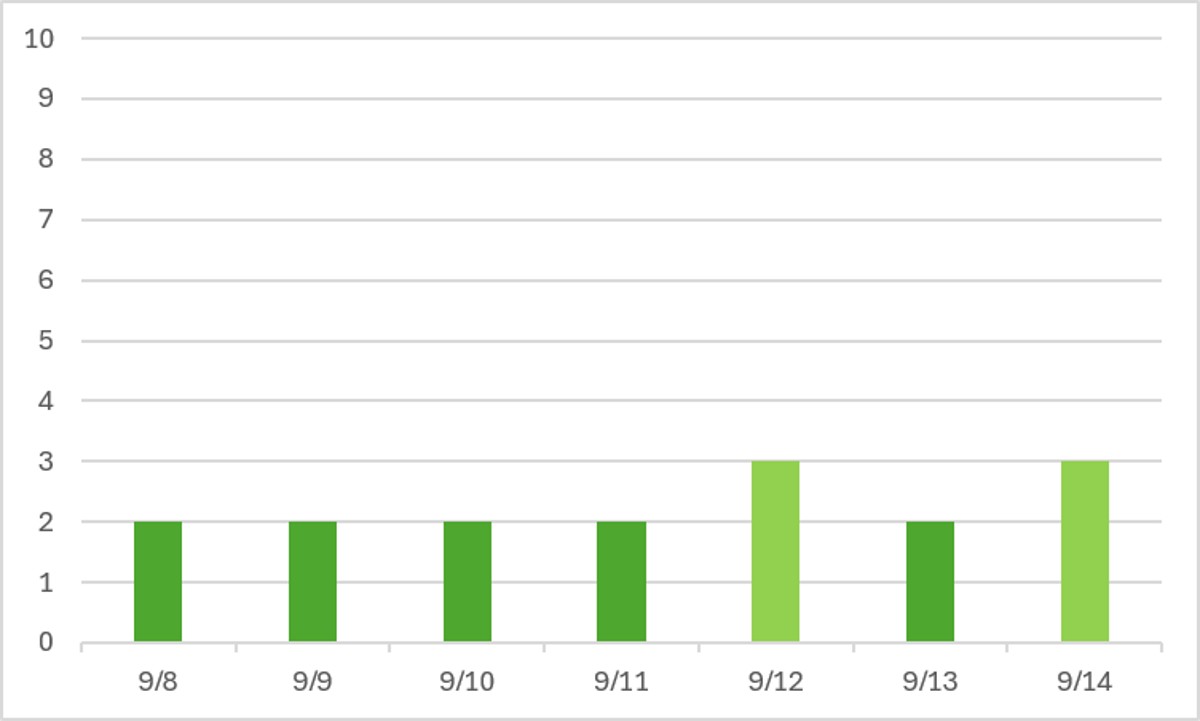
It’s not a week of straight crowd level one days, but for mid-September, this is a lovely result! Only Saturday and Monday popped up above a crowd level 2. And as we’ll quickly see, those two crowd level three days are mostly due to party behavior and not any sort of random one-day-only crowds appearing.
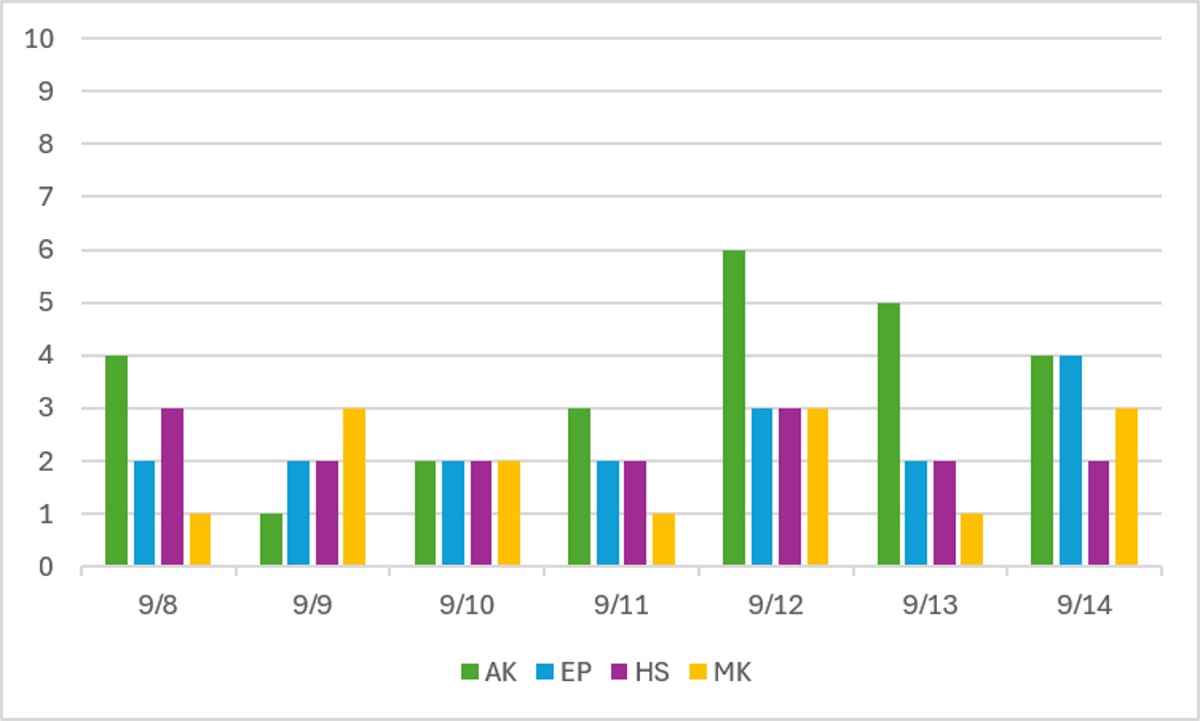
The trend of Animal Kingdom being more crowded on weekends, interestingly, even with Magic Kingdom party behavior. So that definitely contributes to higher crowd levels overall on the weekends. But then we also can start to clearly see when Magic Kingdom party days are happening, with Magic Kingdom averaging a crowd level 1 on party days, and crowd level almost-3 on non-party days. Expect that difference to get even bigger as we progress through the fall.
Performance of Crowd Level Predictions
Each week, I give you a very transparent look into how the TouringPlans crowd level predictions performed. Each day at each park is one data point, so each week we have 28 different crowd level predictions to evaluate. Any time a prediction is within one or two crowd levels, things won’t really “feel” much different than what was predicted. Being off by 3 or more crowd levels is where you might feel that difference in wait times throughout the day.
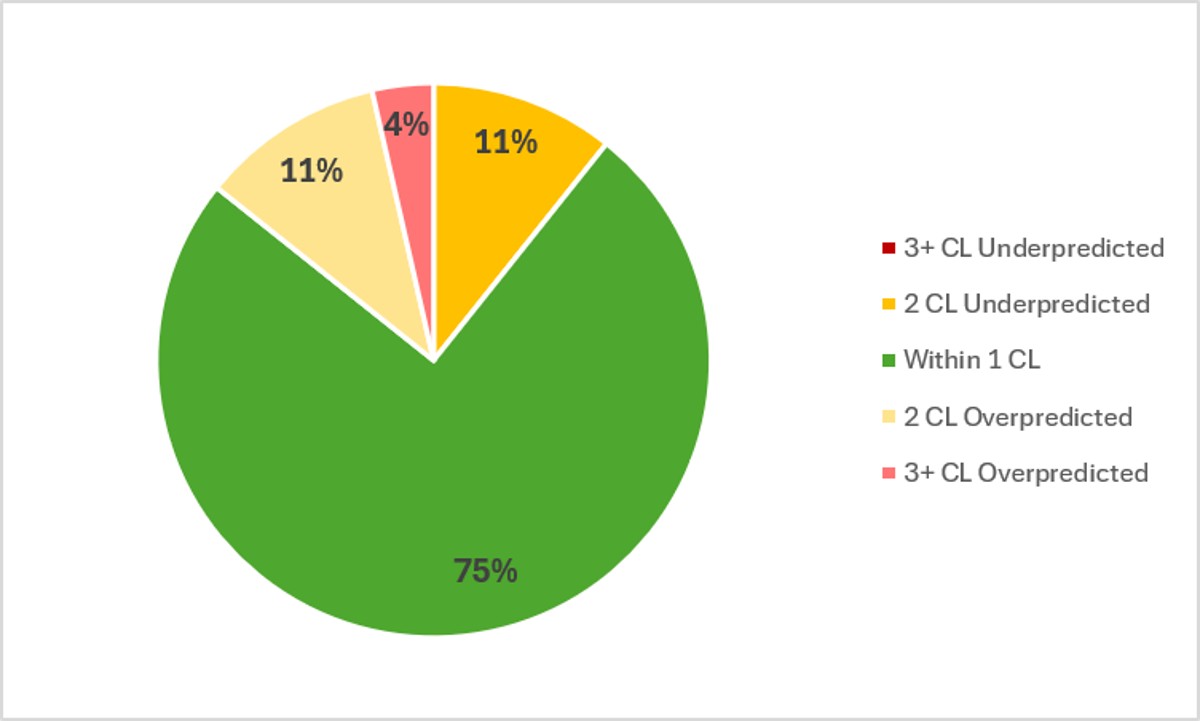
In the past week, Touring Plans predictions were either spot-on or within 1 crowd level 75% of the time, which is pretty good compared to a lot of our summer results. And 96% of the time Touring Plans predictions were within 2 crowd levels, so that’s a solid A on predictions for the last week. We expect crowds to be low in mid-September, and crowds were indeed low in mid-September. The biggest miss of the week was an overprediction by 3 crowd levels, which happened at EPCOT on September 13th, when the predicted crowd level was 5, but the park only hit crowd level 2.
Attraction Downtime September 8 – 14
If we average all of the capacity lost due to unexpected downtime over the past week, it comes out to 5.6% of attractions unexpectedly being down. This is, thankfully, back closer to our “normal” WDW summer average – after two weeks in a row of above-7% results. Over the past week, Hollywood Studios was the park with the worst overall downtime, averaging 7.1% of its capacity lost to downtime. And Animal Kingdom was the next-worst, with 7% of its capacity lost throughout the week.
The worst day for attraction downtime in the past week was on September 13th. On that day, 8% of all capacity at WDW was lost due to unexpected downtime. And the worst park-day of the past week was also on September 2nd, over at Animal Kingdom, when 23% of its capacity was lost due to unexpected downtime. Everest was down for almost two-thirds of the day, and Kali River Rapids was down for almost half of the day. And at a park with few attractions overall, two unreliable rides have a big impact. Animal Kingdom was open for 11 hours on the 13th, so 23% downtime is the equivalent of the entire park shutting down for over 151 minutes! That’s like the park deciding to open at 10:31 am instead of 8 am, on the fly. Crazy!
Attraction Downtime Worst Offender
And we’re back! Thanks to Slinky Dog Dash getting its business back together, Test Track is back on top of our downtime list, like it has been for most of the summer. Test Track was unexpectedly down for 30% of the past week. It had two worst days of the past week – on the 8th and the 14th it had 42% downtime.
Thankfully, this week there weren’t any other attractions that had above 20% downtime. Which is a crazy amount of downtime, but with 4 or 5 attractions regularly hopping over that number this summer, it’s good to have a reprieve.
Rope Drop Downtime
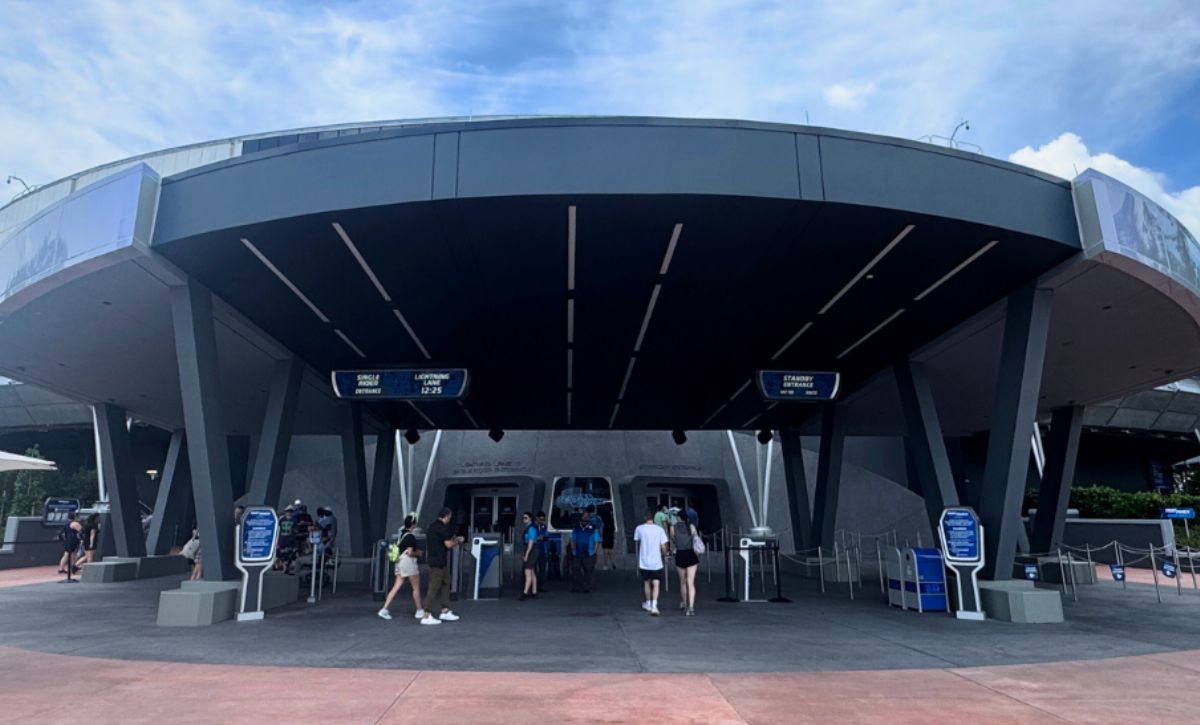
Take a deep breath, prepare yourself, this is quite a list this week. Here are problematic offenders from the past week, with the percentage of downtime during the first hour of the day in parentheses:
- Magic Kingdom: Big Thunder Mountain Railroad (35%)
- EPCOT: Spaceship Earth (41%), Test Track (13%), Journey Into Imagination (11%)
- Hollywood Studios: Rise of the Resistance (28%), Slinky Dog Dash (26%), Tower of Terror (24%), Runaway Railway (23%), Rock’n’Roller Coaster (16%), Toy Story Mania (12%)
- Animal Kingdom: Kali River Rapids (17%)
If we ignore Hollywood Studios from this list, this looks like a very excellent rope drop week! That Magic Kingdom list having only one attraction on it is incredible. I went back months and months and months and months and couldn’t find a rope drop week this good at that park.
Only one super-headliner on the list at EPCOT is a pretty great result for that park as well.
Hollywood Studios is our big oops this week – plenty of headliners with plenty of downtime that all overlapped to make rope drop a very tricky game over the past 7 days.
Wait Times September 8 – 14
Attractions with the Highest Average Posted Wait at Each Park
- EPCOT: Cosmic Rewind, average posted wait of 76 minutes (was 75.5 minutes last week)
- Hollywood Studios: Slinky Dog Dash, average posted wait of 54 minutes (was 80 minutes last week)
- Magic Kingdom: TRON, average posted wait time of 50.5 minutes (was 53 minutes last week)
- Animal Kingdom: Flight of Passage, average posted wait time of 50 minutes (was 38 minutes last week)
Only two attractions in all of WDW had average posted waits of over an hour this week – Cosmic Rewind and Test Track (60.1 minutes). That’s incredible! Our biggest wait time decrease week-over-week was Slinky Dog Dash, where unreliability drove up wait times last week. And our biggest wait time increase was at Flight of Passage, thanks to Animal Kingdom really struggling to handle any sort of guest volume above “empty.”
Parks with the Highest and Lowest Average Wait
- Highest: Hollywood Studios, average park-wide posted wait of 32 minutes (was 28.5 minutes last week)
- Lowest: Magic Kingdom, average park-wide posted wait of 17.5 minutes (was 17.5 minutes last week)
Overall, these are great results! Yes, Hollywood Studios popped above our “very low crowd” mark of a 30 minute average wait across the entire park. But 32 isn’t bad, and it’s mostly thanks to all of the weird downtime around the park. And Magic Kingdom stayed very very low like last week, thanks mostly to those party days.
Most Inflated Posted Wait Times
We all know that Disney inflates their posted wait times on purpose. They have many reasons for doing this. Some are totally understandable, and some are potentially more problematic. We can figure out how much posted wait times are being inflated by comparing submitted actual wait times from the Lines App and the posted wait time when the person timing their wait entered the line.
Over the past week, actual wait times in the Lines App averaged 74% of what was posted. That’s pretty close to our historical average in the era of Lightning Lanes. Overall, if the posted wait time at a popular attraction was 60 minutes, you could’ve expected to wait less than 45 minutes instead.
But the worst inflation offender for the past week was Magic Carpets of Aladdin. At this one attraction, submitted actual wait times were only 40% of posted wait times in the past week. That means that if Magic Carpets had a 10 minute posted wait, you probably would have actually only waited 4 minutes instead. Less than half of what was posted!

This Week’s Wait Time Rock Star
Between September 8th and 14th we had just under 1200 timed actual waits submitted through the Lines app. And the person who recorded the most actual waits during that time was brandybear1017, with 36 overall timed waits – 17 Lightning Lane waits, 18 standby waits and 1 single rider wait. Thanks for all of that timing, brandybear1017! It unfortunately does not compete with the the 97 timed waits in a single week from our current timing champion, preef.
Looking Ahead: September 15 – 21
I write this article on Tuesday evenings so that you all have the very freshest of data on Wednesdays. That means the 15th will already be in the past by the time you’ve read this, so you’ve made it back to the future!
We’ve once again got three Halloween parties over the next week – on September 15th, 18th, and 20th. There is also a party on the 22nd, which isn’t during this week, but does mean that the 21st is surrounded by two party days. In fact, the 19th and 21st will easily be the worst days to spend in Magic Kingdom over the coming week, but are also your only options for seeing Starlight and Happily Ever After between the 18th and 22nd.
We have another new EPCOT Food & Wine Festival booth opening this week (The Wedge on September 18th), but that shouldn’t have a gigantic impact on wait times at the park – lines just may be a little longer at the new booth on its first day, before things settle back down.
Otherwise, nothing remarkable is happening in the parks over the next week. Expect low crowds until fall break season starts back up at the end of September and beginning of October.
And, hi, hello, yes, we’re still in afternoon thunderstorm season, with plenty of rain being called for every day of the next week. Highs aren’t quite as high this week though, with no days forecast to get into the 90s. So that’s …. something!
Were you in the parks this past week? Or are you headed to Orlando soon? Let me know in the comments below!
You May Also Like...
-

The one where late August decided that “low crowds” still wasn’t low enough. This week gave us the least-crowded day Walt Disney…
-
Labor Day weekend tried its best to make Walt Disney World feel crowded again. It succeeded…sort of. With waits that were…

So I’m left pretty confused as we were at MK 9/8 & HS 9/9 and the wait times/ crowd levels were devastating to our plans and trip overall (since we experienced the same thing at USF 9/3, IOA 9/5, & Epic 9/6). We chose September based on touring plan data when we went in 2019, it went beautifully for all parks, so i did the same this time. We had 15 min or less wait times in 2019 except Peter Pan, Big Thunder, Mine Train. This time Haunted Mansion was almost an hour (kept stopping), and it seemed like each ride had issues so that to me meant crowd levels must be higher. In my head the rides break more when there’s more people/more use? It wasn’t empty parks in 2019, but it was easy to follow our plan and do everything we wanted to, which was a lot! Over 13 rides at MK, if i remember right! This time? I think we did 6. It was insane.
Last time we were done at HS after lunch, even riding toy story mania twice because it was walk-on. This time everything had 45+ minute waits.
Just… is this the new normal?! Don’t know if we’ll ever bother to go again if that’s what is going to be like. I know it gets MUCH worse, crowd- wise. But we’d never purposely go at such a time. Just not worth the money for us (which is more than most families, we have 8 kids lol)
8 days until our trip – really appreciate these data dumps for our planning and early entry rides!
Question – is the 75% average for actual vs posted wait times applicable to the special events? Trying to gauge what’s in the Lines app during the MNSSHP nights ahead of our first party.