Crowd Calendar Trends For Late 2018 and Early 2019
Did you know that you can go to the Historical Crowd Calendar and see how our predictions did on any day in the past? We designed the Crowd Calendar specifically to make it easy to compare our predictions to what we observe. We are numbers people here at TouringPlans.com after all. Our goal is to be +/- 1 point most days. Here is how we did the last 30 days.
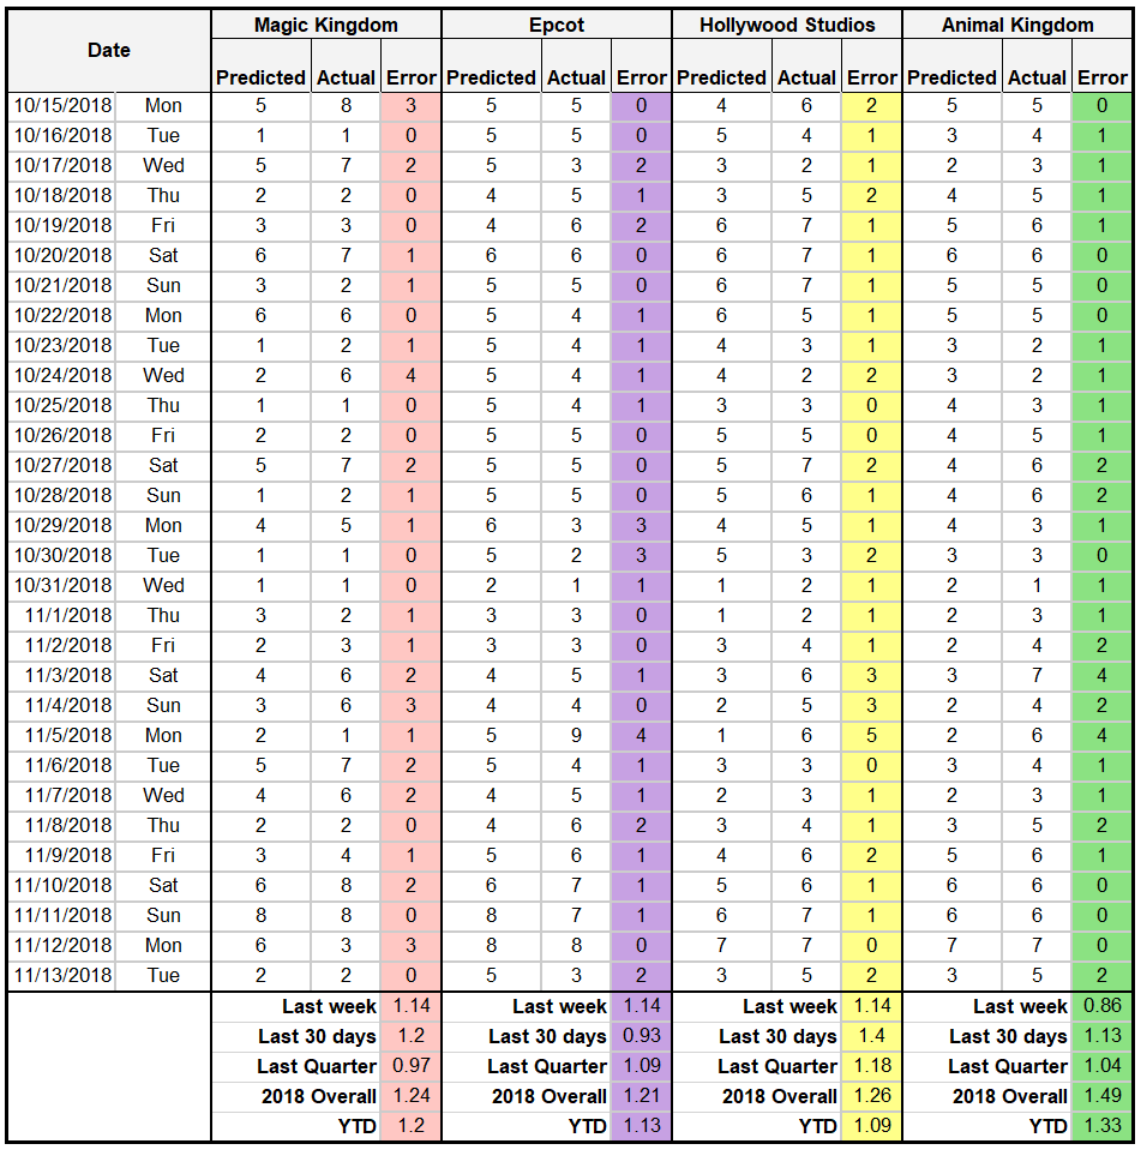
The short and long-term average of our prediction error is good. We hover around our +/-1 goal. We don’t include any inflation bias so when the predictions are off they tend to be too low. Unseasonable weather, operational changes, hotel discounts and resort promotions can happen without much notice and impact the crowd levels that we observe.
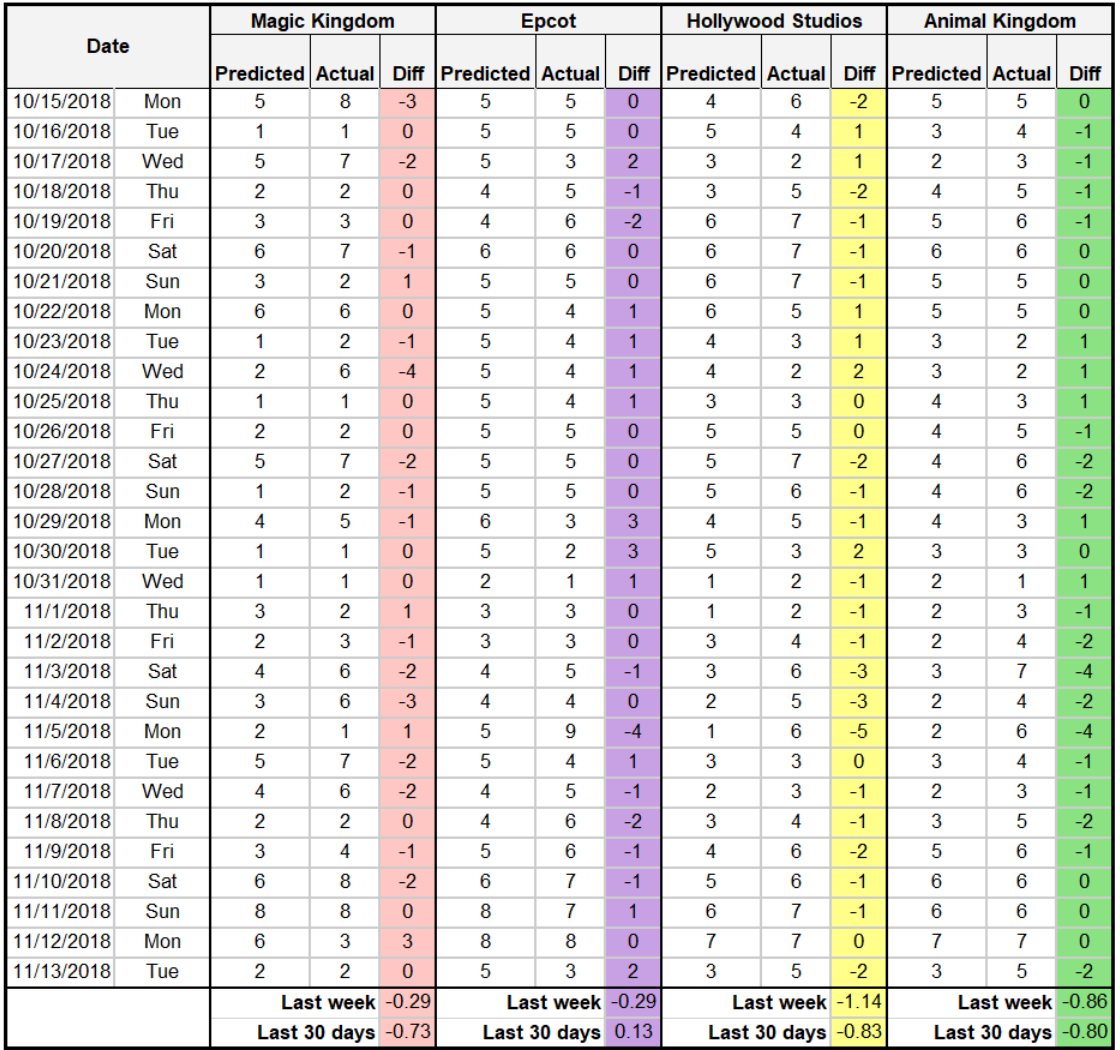
Notice that when we add the direction of the error (above) we see a trend of underpredicting in the last 30 days. When we see a trend like this we look closer for an explanation. You may have seen our recent blog post about Disney’s discounted hotel rooms on Priceline. This is likely one piece of the puzzle. We have some evidence that Disney is adjusting staffing and ride capacity to reduce costs as well – this is a second piece. This year the parks have added Disney Early Morning Magic and Disney After Hours – perhaps these are contributors to the different crowd levels too.
The next thing to look at is to see if the trend might continue. One way to evaluate the future predictions is to compare them to the historical data. For this analysis we look at what we call “Donor Days” which are similar days in the past.
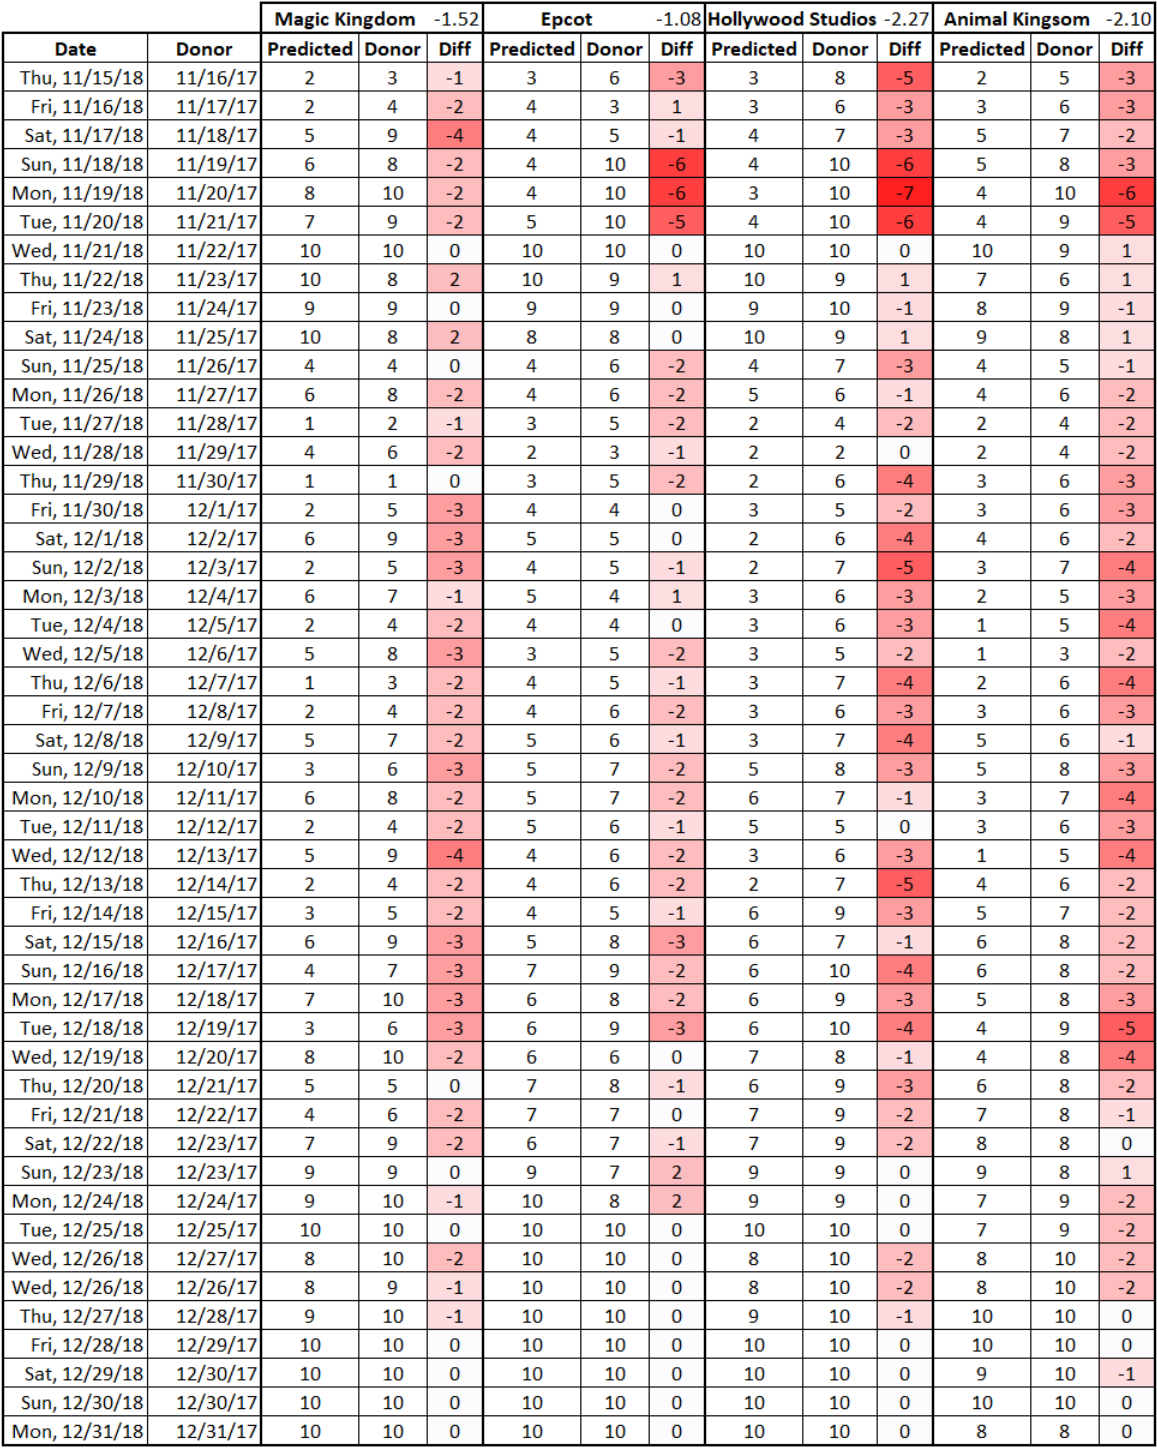
These Donor Days indicate one of two things. Either last year was more crowded than usual or something is different in 2018. School schedule patterns for 2017 and 2018 are very similar so it can’t be that. Maybe the introduction of Disney Early Morning Magic and Disney After Hours is more impactful than we thought. These paid events get guests in the parks before and after the day guests, respectively. Disney has reduced park hours to accommodate the added events which can be a a signal to the statistical models that crowds will be lower but this may not be the case long-term. Because these events are new it is difficult for our statistical models to learn how they impact crowd levels. The next 41 days have 28 paid events that are new this year.
So, we tried an experiment where we used the park hours for 2017 and reproduced our predictions but interestingly we did not see a dramatic increase on the predicted levels, In fact, some predictions dropped. Bottom line is that crowd level predictions for Fall 2018 are more likely to underpredict than overpredict. This means that using a touring plan is essential for the rest of the year.
WHAT TO DO?
January 2019 After The Update
For the November Crowd Calendar update the statistical models showed an increase in crowd levels for the Magic Kingdom the first week of January. We thought this increase deserved a closer look.
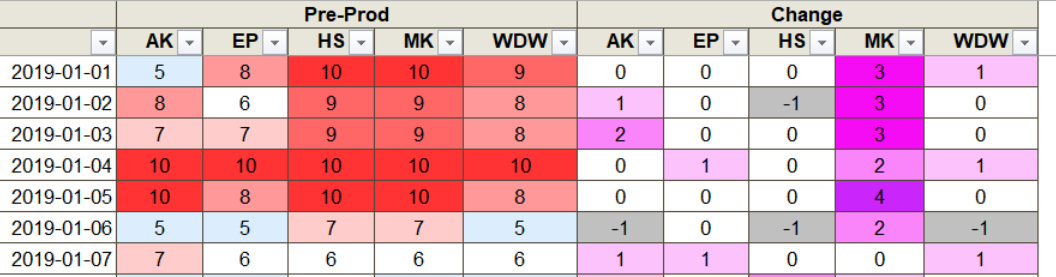
Was it an an error? Perhaps a model correction from a previous update? Or was this a reaction to the recent trend in crowd level? One drawback of a complex modeling system like the one we use is that it can be difficult to determine why a prediction changes. There are hundreds of moving parts that change daily. Every wait time that we collect – and we collect thousands a day – can impact the next prediction. When a crowd level prediction does change it doesn’t necessarily mean that the previous prediction was wrong. I know that may sound like quirky statistical magic but it is true. Think of it like a political poll. Each set of predictions represents the best estimate based on the available information.
In this case, the increase in the crowd level at the Magic Kingdom was bringing it in line with the other parks so it seemed reasonable and we let it pass. Looking at prior years, crowd level drops off quickly after New Year’s Day but it all depends on when students return to school. In 2019 most schools don’t return until January 7 but some will return earlier. The later start to school aligns with the holiday crowds continuing into January. Feeling comfortable with the increase, the next thing to investigate is to see why the prior predictions were lower.
January 2019 Before The Update
It can’t be the school schedules alone since we have had that data incorporated in our models since May 2018. Perhaps it is the extra week between New Year’s and WDW Marathon Weekend. You would have to go back to 2013 to find a time with such a large gap but our models do not give a lot of weight to wait times that we observed five years ago. Summer 2018 was not as crowded as previous years and Fall bounced back to its usual low levels after a storm-ridden 2017. A combination of these factors certainly contributed to the lower levels previously on the calendar. Based on the available information we have now, I think the latest updates are the most accurate we could have.
All this to say that predicting crowds at Disney Parks is like a little league baseball game. It plods along with occasional outbursts of furious action. These predictions are always subject to change and we try our best to emphasize that your best defence against a larger than expected crowd is a solid touring plan. They work for any crowd level. Using one during the rest of 2018 is highly advised.
![]()
You May Also Like...
-

July is here and the Disneyland Crowd Calendar needs an update. A big update. Star Wars: Galaxy's Edge is open to…
-
The final month have summer has begun and it is time for a Disneyland Crowd Calendar update. We have two months…
-
We have had a few weeks to observe the wait times at Universal Orlando Resort since the parks reopened in June.…
-

This Crowd Calendar update just affects November and December 2021. The prior predictions were based on data prior to 2019. We expect…
Steve,
The folks at WDW are reading your posts. I am taking my family to WDW from Jan 2 to Jan 6, so I have watching crowd levels and hours very closely. I checked the hours last night before posting my comment and I have checked the hours this morning, Magic Kingdom is now staying open another three hours closing at 11 PM instead of 8 PM. Also Animal Kingdom is now open an hour earlier at 8 AM instead of 9 AM.
It will be interesting test for my teen age daughter, we were planning on doing EMH at AK starting at 8 AM, it is now at 7 AM.
After January 1st, WDW currently has the Magic kingdom closing at eight P.M. Does that affect your model also if they are seeing the same data as you will they expand the operating hours. I am not sure why they have the parks open less hours considering a lot of school kids don’t have to go back till January 7th or 8th
That would be another explanation for why our old prediction had the Magic Kingdom with lower crowd levels.