
Disney Data Dump August 26 2026
August has decided to go out very quietly (as expected). Last week gave us the lowest waits of the year, and this week came remarkably close to doing it again. Magic Kingdom party days are starting to create some very obvious crowd-shifting behavior, Animal Kingdom managed a very rare crowd level 1, and even EPCOT settled comfortably back into its Diet EPCOT ways for one final week.
Of course, we can’t have two consecutive weeks of excellent news without at least a little chaos. Test Track is back atop the downtime rankings, rope drop reliability got noticeably worse, and Hollywood Studios is already absorbing some of the guests avoiding early-closing Magic Kingdom days. Plus, the peaceful days of Diet EPCOT are officially numbered: Food & Wine starts this week. So let’s enjoy these absurdly low late-August waits while they last.
Observed Crowd Levels August 18 – 24
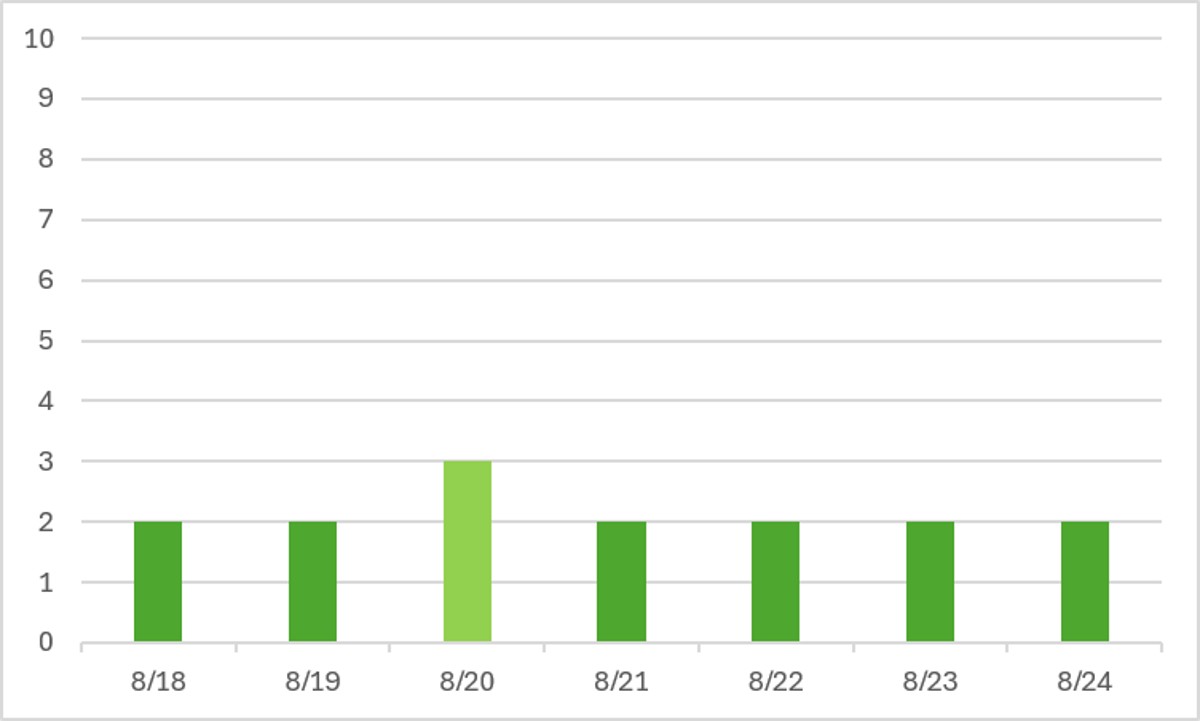
So we didn’t get a steady string of crowd level 2 like last week … but it was pretty darn close! This is another glorious week for wait times. These past two weeks are the lowest waits we’ve had all year.
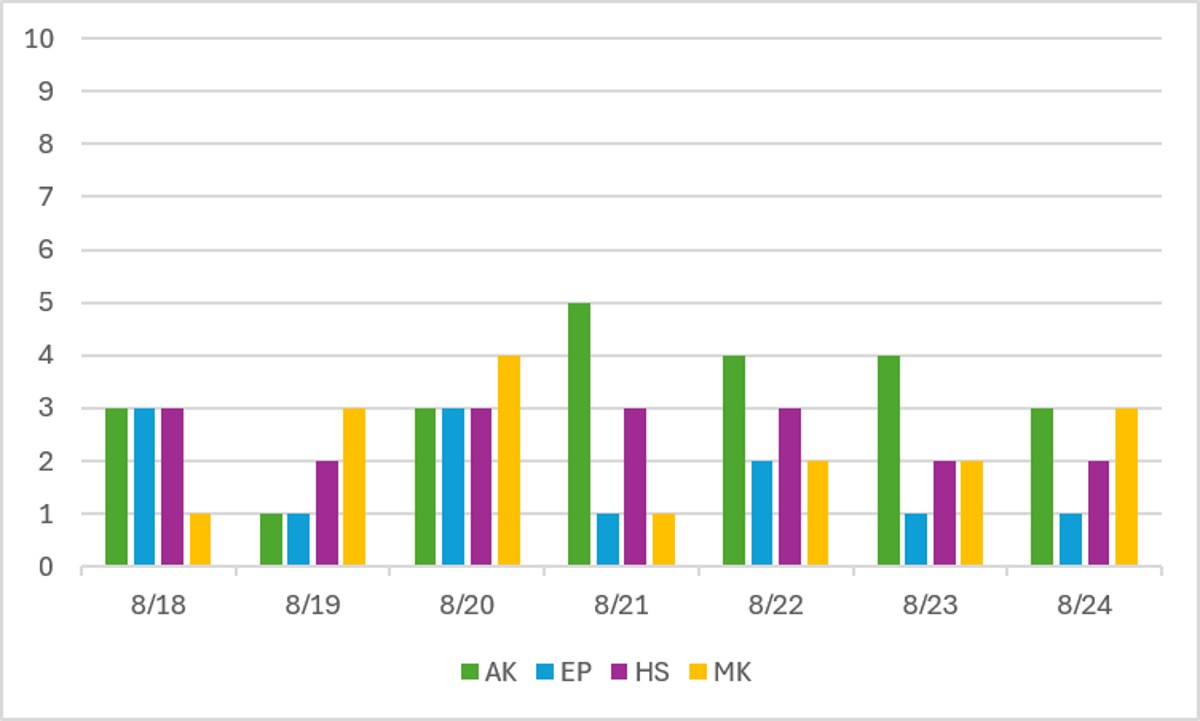
Some really interesting park-level results this week! Parties at the Magic Kingdom on the 18th, 21st, and 23rd had some clear impact on crowds. Although, the 22nd also having a low crowd level at Magic Kingdom is interesting and unexpected. Animal Kingdom had its lowest waits of the summer on the 19th, when everyone was at Magic Kingdom instead. EPCOT is also back down to its nice, low Diet EPCOT crowds … which won’t last too much.
Performance of Crowd Level Predictions
Each week, I give you a very transparent look into how the TouringPlans crowd level predictions performed. Each day at each park is one data point, so each week we have 28 different crowd level predictions to evaluate. Any time a prediction is within one or two crowd levels, things won’t really “feel” much different than what was predicted. Being off by 3 or more crowd levels is where you might feel that difference in wait times throughout the day.
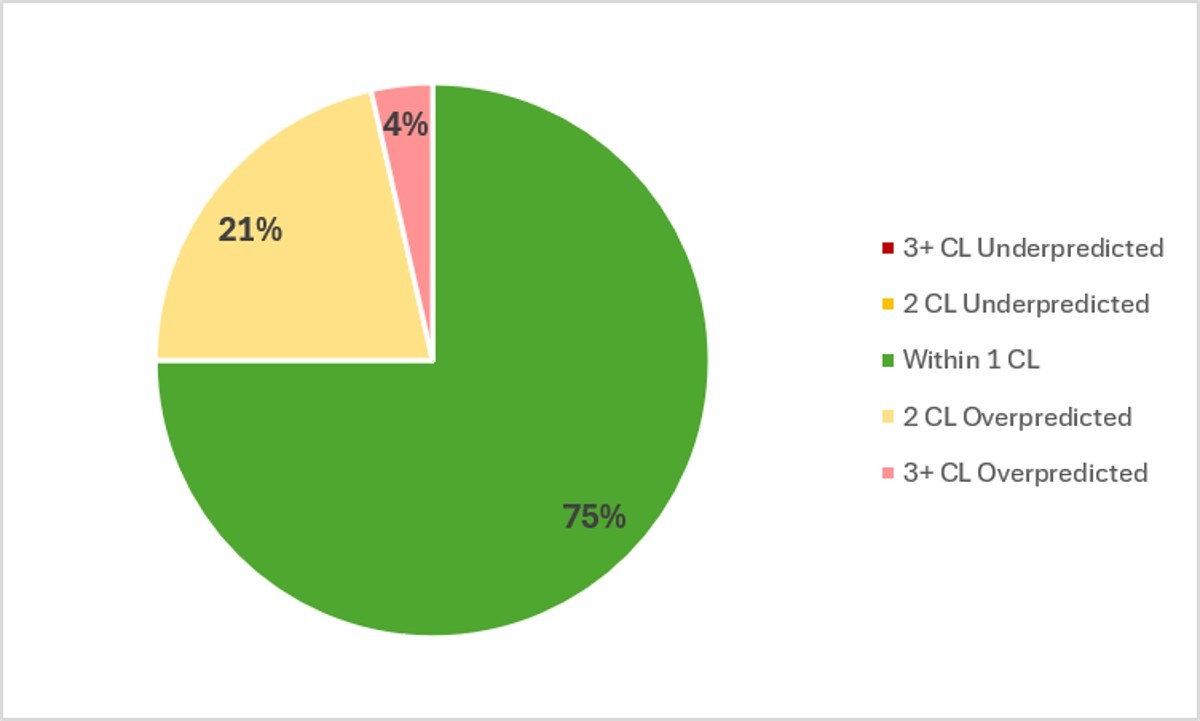
In the past week, Touring Plans predictions were either spot-on or within 1 crowd level 75% of the time, which is pretty on par with the results for the rest of the summer. And 96% of the time Touring Plans predictions were within 2 crowd levels, so that’s a rare A on predictions for the last week! The middle of August is expected to have low crowds, and we got low crowds. Huzzah! This week, the biggest miss of the week was an overprediction of 3 crowd levels at Animal Kingdom on the 19th, when Touring Plans predicted a crowd level 4, but the park only got to a crowd level 1!
Attraction Downtime August 18 – 24
If we average all of the capacity lost due to unexpected downtime over the past week, it comes out to 6.1% of attractions unexpectedly being down. This is quite a big above our “normal” WDW summer average. Over the past week, Magic Kingdom was the park with the worst overall downtime, averaging 7.1% of its capacity lost to downtime. Interestingly, while EPCOT had a terrible week last week, it had a great week this week (comparatively), with less than 4% downtime.
The worst day for attraction downtime in the past week was on August 23rd. On that day, 11% of all capacity at WDW was lost due to unexpected downtime. And the worst park-day of the past week was also on the 23rd, over at Animal Kingdom, when 18% of that park’s capacity was lost due to unexpected downtime. Animal Kingdom was open for 11 hours on the 23rd, so 18% downtime is the equivalent of the entire park shutting down for more than 118 minutes. Almost 2 hours out of an 11 hour park day!
Attraction Downtime Worst Offender
Our summer-long “champion” is back with a vengeance after finally being dethroned last week! Test Track has taken home this top downtime category for 10 out of the past 12 weeks, and is at the top again this week with 27% downtime. The worst day of the week for Test Track was on August 23rd, when it was down for 53% of the day. But it was also down for 42% of the 22nd and 36% of the 20th. Ouch.
We had two other attractions with more than 20% downtime this week – The Hall of Presidents and the TTA PeopleMover. A bit of a random result, but still worth noting.
Rope Drop Downtime
Here are problematic offenders from the past week, with the percentage of downtime during the first hour of the day in parentheses:
- Magic Kingdom: TTA PeopleMover (19%), Big Thunder Mountain (16%), Winnie the Pooh (15%), it’s a small world (14%), Pirates of the Caribbean (13%), Tiana’s Bayou Adventure (11%)
- EPCOT: Journey Into Imagination (27%), Spaceship Earth (18%), Frozen Ever After (14%), Test Track (12%)
- Hollywood Studios: Slinky Dog Dash (23%), Rise of the Resistance (15%), Runaway Railway (12%)
- Animal Kingdom: No rope drop downtime issues this week!
We had an excellent rope drop downtime list last week – it was short, and there were very few headliners. Unfortunately, this week we corrected back to something that looks more like our “normal” list. A few headliners, a bunch of downtime at Magic Kingdom, Thank goodness for Animal Kingdom getting back to some reliability!
Wait Times August 18 – 24
Attractions with the Highest Average Posted Wait at Each Park
- EPCOT: Cosmic Rewind and Test Track, average posted wait of 70.4 minutes (was 69 minutes at Cosmic Rewind last week)
- Hollywood Studios: Slinky Dog Dash, average posted wait of 62 minutes (was 55 minutes last week)
- Magic Kingdom: TRON, average posted wait time of 54 minutes (was 56 minutes last week)
- Animal Kingdom: Flight of Passage, average posted wait time of 52 minutes (was 51 minutes last week)
Other than a drop for the average wait at Tron, thanks to more Halloween party days this week, all headliners saw very slight increases in average posted waits this week. Slinky is the big exception, with a more significant increase in its wait. Again – we can trace this back to more Halloween parties. Many of the day guests who choose to avoid Magic Kingdom head to Hollywood Studios as a second choice, driving up wait times there on MK party days.
Parks with the Highest and Lowest Average Wait
- Highest: Hollywood Studios, average park-wide posted wait of 35.5 minutes (was 33 minutes last week)
- Lowest: Magic Kingdom, average park-wide posted wait of 19 minutes (was 18.5 minutes last week)
This is where we see that this week wasn’t quite as empty as the previous week. But it’s close! These are still very low numbers. EPCOT and Animal Kingdom were both significantly under the “average 30 minutes posted wait” mark that I use to tell if the parks are very empty.
Most Inflated Posted Wait Times
We all know that Disney inflates their posted wait times on purpose. They have many reasons for doing this. Some are totally understandable, and some are potentially more problematic. We can figure out how much posted wait times are being inflated by comparing submitted actual wait times from the Lines App and the posted wait time when the person timing their wait entered the line.
Over the past week, actual wait times in the Lines App averaged 76% of what was posted. That’s pretty close to our historical average in the era of Lightning Lanes. Overall, if the posted wait time at a popular attraction was 60 minutes, you could’ve expected to wait less a little more than 45 minutes instead.
But the worst inflation offender for the past week was Mad Tea Party. At this one attraction, submitted actual wait times were only 32% of posted wait times in the past week. That means that if Mad Tea Party had a 10 minute posted wait, you probably would have actually only waited a little over 3 minutes instead. A third of what was posted! Really, in these uncrowded seasons, it’s incredibly rare to wait for more than one cycle of the ride. The only time you’ll have a longer-than-expected wait is if … a human causes some mess and they have to clean it up.

This Week’s Wait Time Rock Star
Between August 18th and 24th, we had just over 1100 timed actual waits submitted through the Lines app. And the person who recorded the most actual waits during that time was Joelwhy, with 47 overall timed waits – 2 Lightning Lane waits and 45 standby waits. Thanks for all of that timing, Joelwhy! It unfortunately does not compete with the the 97 timed waits in a single week from our current timing champion, preef.
Looking Ahead: August 25 – 31
I write this article on Tuesday evenings so that you all have the very freshest of data on Wednesdays. That means the 18th will already be in the past by the time you’ve read this, so you’re living in the future!
You all know that we’re in the season where Magic Kingdom party dates are the main driver of crowd behavior over the coming week. It’ll stay that way until we get into fall break season. Parties in the upcoming week are on August 25th, 28th, and 30th. Expect very low crowds at Magic Kingdom on those days, and higher crowds at Hollywood Studios (and maybe Animal Kingdom). I’ll be in Magic Kingdom the morning of the 28th, trying to see how much I can get done during Early Entry and the first ~2 hours the park is open!
Otherwise, the big change this week is that we’re finally at the end of Diet EPCOT! Food and Wine Festival kicks off on August 27th. That first day will be crowded – but not at attractions. Just at the booths that are open. Then, as we head into the weekend, EPCOT will fill up more and more.
It’s still afternoon thunderstorm season! Temperatures will still be high – topping out around 90 each day. But humidity will make it feel hotter, and the rain will roll through only to temporarily cool things off.
Were you in the parks this past week? Or are you headed to Orlando soon? Let me know in the comments below!
You May Also Like...
-

If you enjoy crowd-calendar whiplash, Walt Disney World delivered beautifully this week. We went straight from the most crowded week of…
-

After two months of unusually low summer crowds, Walt Disney World finally remembered that August can, occasionally, attract people. Crowd levels…
