
Disney Data Dump August 12 2026
After two months of unusually low summer crowds, Walt Disney World finally remembered that August can, occasionally, attract people. Crowd levels climbed to their highest point since early June, with several days landing well above the crowd level 2-ish baseline that has defined most of this summer.
But this week’s numbers need some context. Attraction downtime was unusually rough – especially at Magic Kingdom, which has the biggest impact on overall crowd levels – and Test Track once again reclaimed its very familiar spot as the least reliable attraction of the week. Add in some spectacular rope drop failures at Rise of the Resistance, and there’s a lot more going on here than a simple “crowds went up” story. The good news? This looks much more like one last summer travel bump than the beginning of a sustained increase.
Observed Crowd Levels August 4 – 10
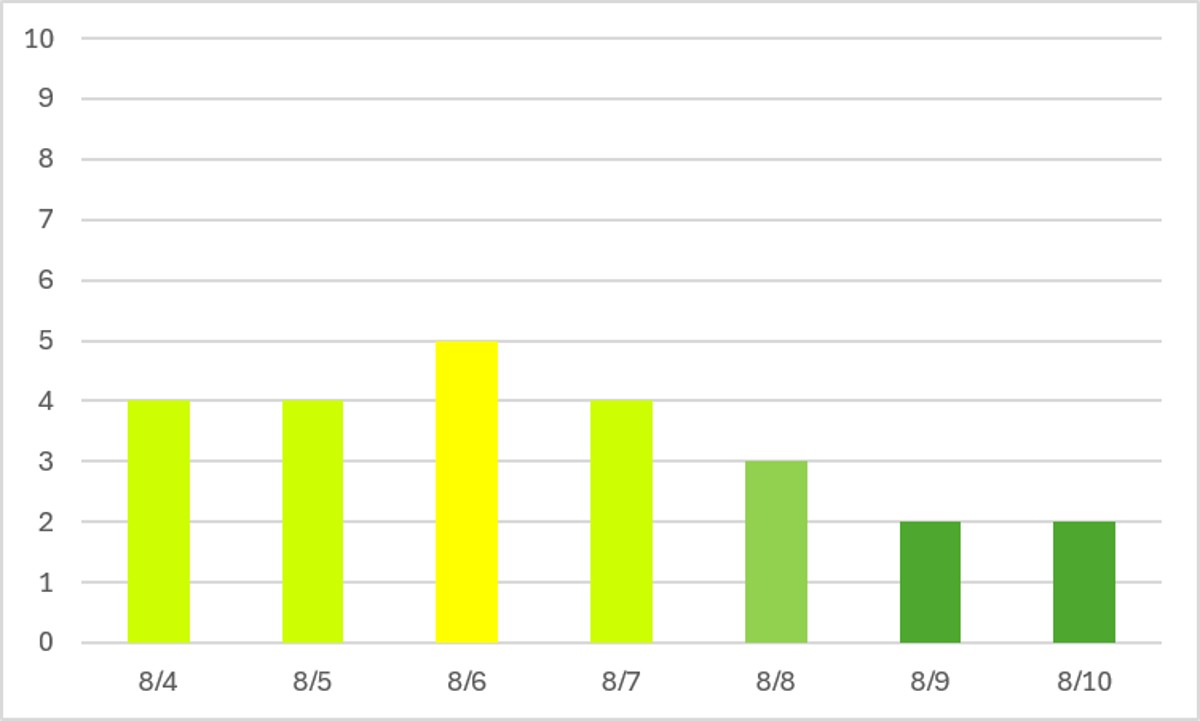
Well hellllllooooooo there last blast of summer crowds! Let’s align first – these are NOT high crowds. But they’re certainly a far cry from the low lows of the rest of the summer, when we were barely averaging over a crowd level 2 each week. The last time we hit crowd level 5 was all the way back on June 3rd. It’s been over two months! Downtime was a significant contributor to that crowd level 5 on the 6th, but clearly with a bunch of level 4 days around it … it wasn’t the ONLY factor. But the crowd level results on the 9th and 10th show that this last gasp is likely wrapping up, and we should be back to low crowds until later in September.
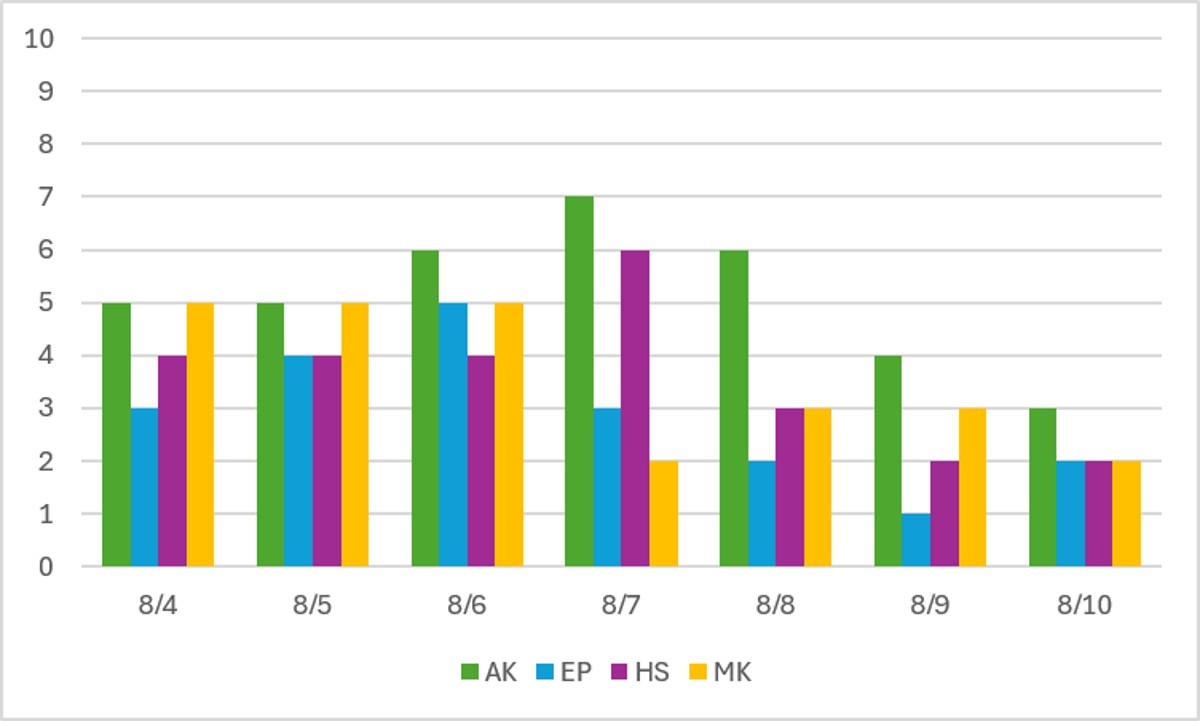
Once again, Animal Kingdom leads the pack in crowd level every day this week. But Magic Kingdom had an interesting and somewhat unexpected stretch of crowd level 5 days from the 4th through the 6th too. The very first party day of the year, on the 7th, didn’t hit a crowd level 1. But this doesn’t mean that party days are going to be crowded this year. The first party of the year draws an unusually high number of locals and influencers who have APs and want to get into the park early to capture decor, food items, and more.
Performance of Crowd Level Predictions
Each week, I give you a very transparent look into how the TouringPlans crowd level predictions performed. Each day at each park is one data point, so each week we have 28 different crowd level predictions to evaluate. Any time a prediction is within one or two crowd levels, things won’t really “feel” much different than what was predicted. Being off by 3 or more crowd levels is where you might feel that difference in wait times throughout the day.
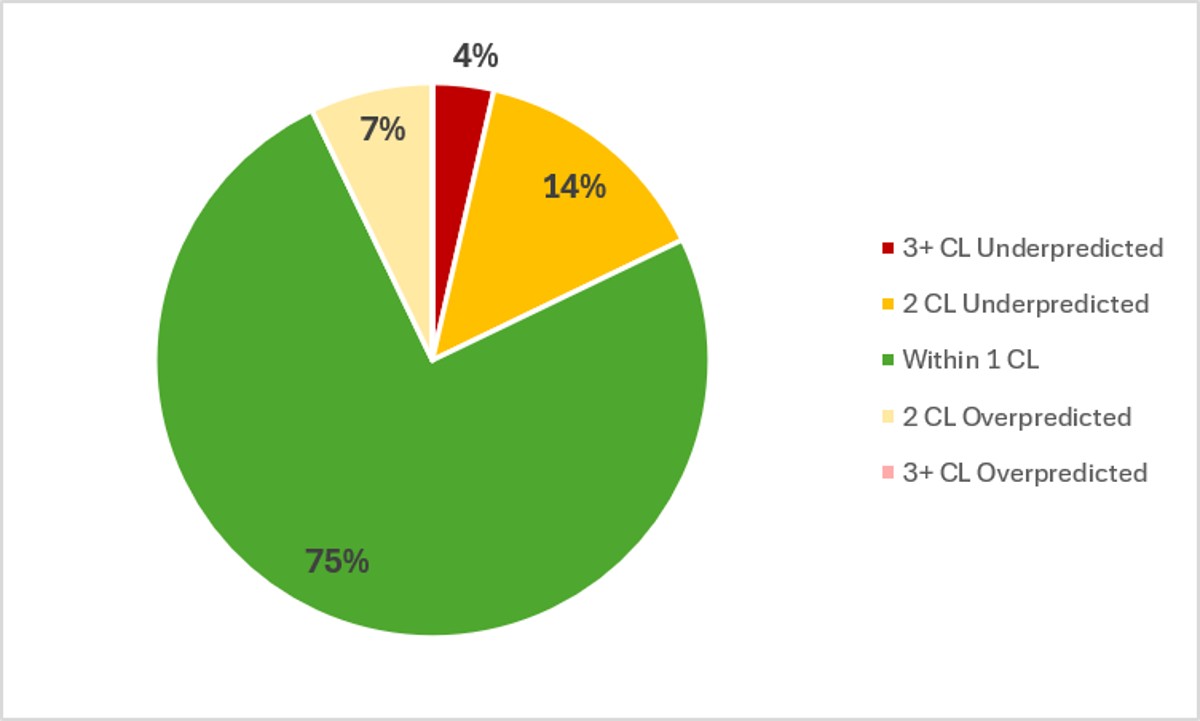
In the past week, Touring Plans predictions were either spot-on or within 1 crowd level 75% of the time, which is the exact same result as last week, and much better than what we’ve seen for the rest of summer. That means that although crowd levels are higher … they’re really just closer to where we’d expect them to be at this point in the summer. And 96% of the time Touring Plans predictions were within 2 crowd levels, so that’s an A on predictions for the last week! This week, the biggest miss was an overpredicted by three crowd levels at EPCOT on August 6th. The park was expected to hit crowd level 2, but ended up all the way at a crowd level 5.
Attraction Downtime August 4 – 10
If we average all of the capacity lost due to unexpected downtime over the past week, it comes out to 6.1% of attractions unexpectedly being down. This is slightly above our “normal” WDW summer average. Over the past week, Magic Kingdom was the park with the worst overall downtime, averaging 7.6% of its capacity lost to downtime. And if we narrow our window down to August 4th-8th, that average goes all the way up to 9% over a 5-day period. That’s a LOT of downtime, and it absolutely contributed to the wait times and crowd levels that we saw MK hit over those days.
The worst day for attraction downtime in the past week was on August 6th (the day the entire resort hit a crowd level 5). On that day, 10% of all capacity at WDW was lost due to unexpected downtime. And the worst park-day of the past week was also on the 6th, over at Animal Kingdom, when 16% of that park’s capacity was lost due to unexpected downtime. (Magic Kingdom also had 13% of its capacity lost due to downtime on the same day!) Animal Kingdom was open for 11 hours on the 6th, so 16% downtime is the equivalent of the entire park shutting down for more than 105 minutes. That’s like all of Animal Kingdom unexpectedly opening at 9:45 am instead of 8 am.
Attraction Downtime Worst Offender
And we’re back to our old unreliable, Test Track, and the attraction with the highest downtime for the past week. For those keeping track at home, Test Track has “won” this category, or tied for the win, for 9 out of the last 10 weeks. This week, Test Track was unexpectedly down for 29.3% of the its operating hours. That’s one of the highest downtime results that we’ve seen for it this summer, and it absolutely has a major impact on wait times at Test Track and at EPCOT as a whole.
Only one other attraction had over 20% downtime this week – Space Mountain, with 21% downtime (it had 22% downtime last week).
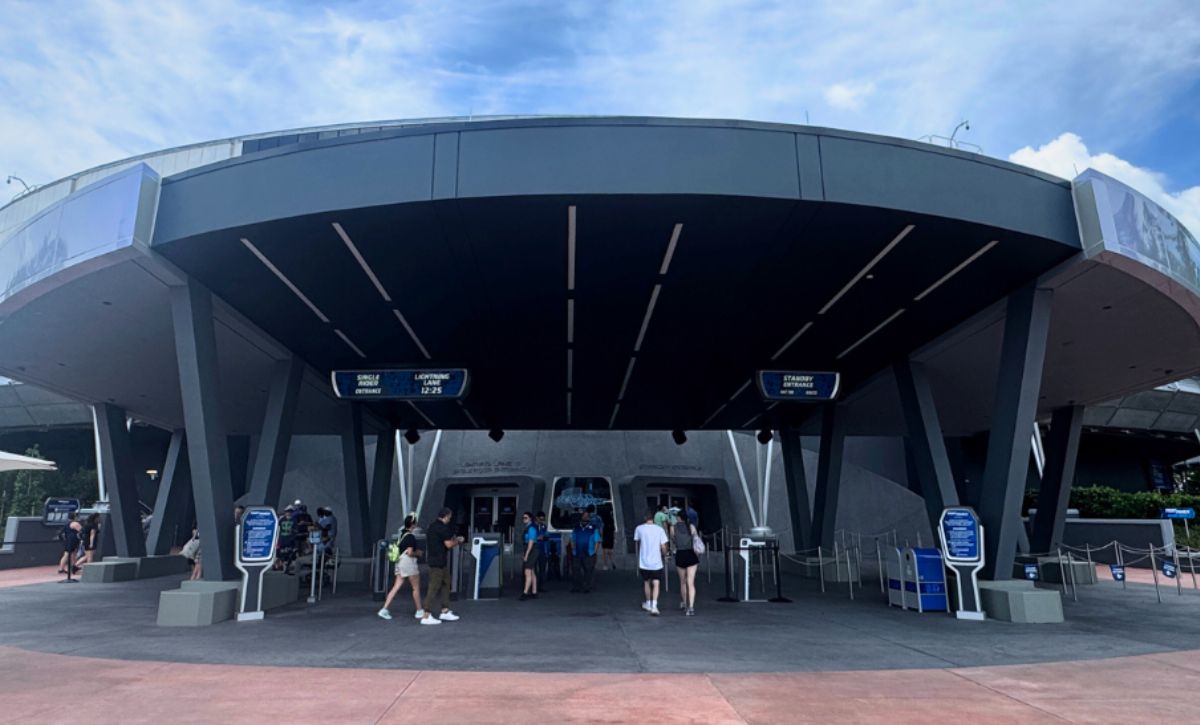
Rope Drop Downtime
Here are problematic offenders from the past week, with the percentage of downtime during the first hour of the day in parentheses:
- Magic Kingdom: Space Mountain (26%), it’s a small world (19%), Haunted Mansion (16%), Tiana’s Bayou Adventure (13%), Buzz Lightyear’s Space Ranger Spin (13%), Seven Dwarfs Mine Train (11%)
- EPCOT: Test Track (34%), Frozen Ever After (11%)
- Hollywood Studios: Rise of the Resistance (52%), Slinky Dog Dash (20%)
- Animal Kingdom: No rope drop downtime issues this week!
Hooray for another gold star for Animal Kingdom this week! It may be struggling with downtime overall, but rope drop isn’t one of the problems. Phew.
But take a look at that downtime number for Rise of the Resistance. 52%. My daughter and I rope-dropped Hollywood Studios on August 8th, and before we even entered the park (30 minutes before early entry), Cast Members were informing everyone that Rise wouldn’t be open for at least an hour after normal park opening. That’s wild.
And over at Magic Kingdom, a whole slew of attractions continue to have problems in the morning. Almost everything is hit-or-miss there, so it’s incredibly important to have a backup rope drop plan, and a backup to your backup rope drop plan.
Wait Times August 4 – 10
Attractions with the Highest Average Posted Wait at Each Park
- EPCOT: Cosmic Rewind, average posted wait of 82 minutes (was 80 minutes last week)
- Magic Kingdom: TRON, average posted wait time of 71 minutes (was 74 minutes last week)
- Hollywood Studios: Slinky Dog Dash, average posted wait of 68 minutes (was 70 minutes last week)
- Animal Kingdom: Flight of Passage, average posted wait time of 61 minutes (was 61 minutes last week)
Interestingly, while crowd levels were generally much higher this week than they were last week, wait times at headliners were largely unchanged … or even slightly lower. This points to downtime being a big contributor to wait times at all attractions going up – not just headliners getting more popular.
Parks with the Highest and Lowest Average Wait
- Highest: Hollywood Studios, average park-wide posted wait of 37.5 minutes (was 36.5 minutes last week)
- Lowest: Magic Kingdom, average park-wide posted wait of 23 minutes (was 22.t minutes last week)
Once again, minor increases week-over-week at every park for our average posted waits. But I suspect these will head lower over the remainder of August.
Most Inflated Posted Wait Times
We all know that Disney inflates their posted wait times on purpose. They have many reasons for doing this. Some are totally understandable, and some are potentially more problematic. We can figure out how much posted wait times are being inflated by comparing submitted actual wait times from the Lines App and the posted wait time when the person timing their wait entered the line.
Over the past week, actual wait times in the Lines App averaged 74% of what was posted. That’s pretty close to our historical average in the era of Lightning Lanes. Overall, if the posted wait time at a popular attraction was 60 minutes, you could’ve expected to wait just under 45 minutes instead.
But the worst inflation offender for the past week was Gran Fiesta Tour. At this one attraction, submitted actual wait times were only 25% of posted wait times in the past week. That means that if Gran Fiesta Tour had a 10 minute posted wait, you probably would have actually only waited 2.5 minutes instead. A quarter of what was posted! Remember to always check the Lines app for predicted actual waits instead of making decisions based on what is posted.

This Week’s Wait Time Rock Star
Between August 4th and 10th, we had just under 1200 timed actual waits submitted through the Lines app. And we’ve got a tie for the wait time rock star of the week! The two people who recorded the most actual waits during that time were amvindedahl and cmb5002, each with 32 overall timed waits – 31 standby waits and 1 single rider wait. Thanks for all of that timing, amvindedahl and cmb5002! It unfortunately does not compete with the the 97 timed waits in a single week from our current timing champion, preef.
Looking Ahead: August 11 – 17
I write this article on Tuesday evenings so that you all have the very freshest of data on Wednesdays. That means the 11th will already be in the past by the time you’ve read this, you’ve made it to the future!
This week, one of the biggest driver of whatever “crowds” exist in mid-August will be Mickey’s Not So Scary Halloween Party shutting down Magic Kingdom early on the 11th and 14th. Expect low crowds at MK those days, and higher crowds especially at Hollywood Studios.
Otherwise, it looks our last gasp of summer travel has worked itself out and the rest of August should see lower crowds and lower wait times. There’s always a chance that weather and downtime messes with those outcomes, though.
Other than the 12th, every day of the next week has at least some afternoon thunderstorms predicted, and highs in the low- to mid-90s. It will be hot. It will be humid. You will be grateful for the rain. Just be prepared so you don’t have miserable wet feet for the rest of the afternoon or evening! And get those outdoor attractions done in the morning.
Were you in the parks this past week? Or are you headed to Orlando soon? Let me know in the comments below!
You May Also Like...
-
August has decided to go out very quietly (as expected). Last week gave us the lowest waits of the year, and…
-

It was the summer-est of times, it was the fall-est of times. Because this week brought us one of the “most…
