Disney Data Dump March 11 2026
After a few weeks of winter wait time whiplash (holiday mash-ups, lingering long-weekend crowds, and the brief runDisney bump) the parks finally settled into something much calmer. In fact, this past week looks a lot like the quiet window I flagged earlier as the best time to visit in March. Wait times were generally below average, touring conditions were manageable, and for the most part the parks behaved exactly the way we expect them to when demand dips just before Spring Break season ramps up.
That doesn’t mean everything was perfectly predictable, though. One park continues to struggle when crowds tick up even slightly, a few downtime surprises created outsized impacts on wait times, and we’re starting to see early hints of the patterns that will matter once Spring Break crowds arrive. Let’s take a look at what actually happened in the parks this past week.
Observed Crowd Levels March 3 – 9
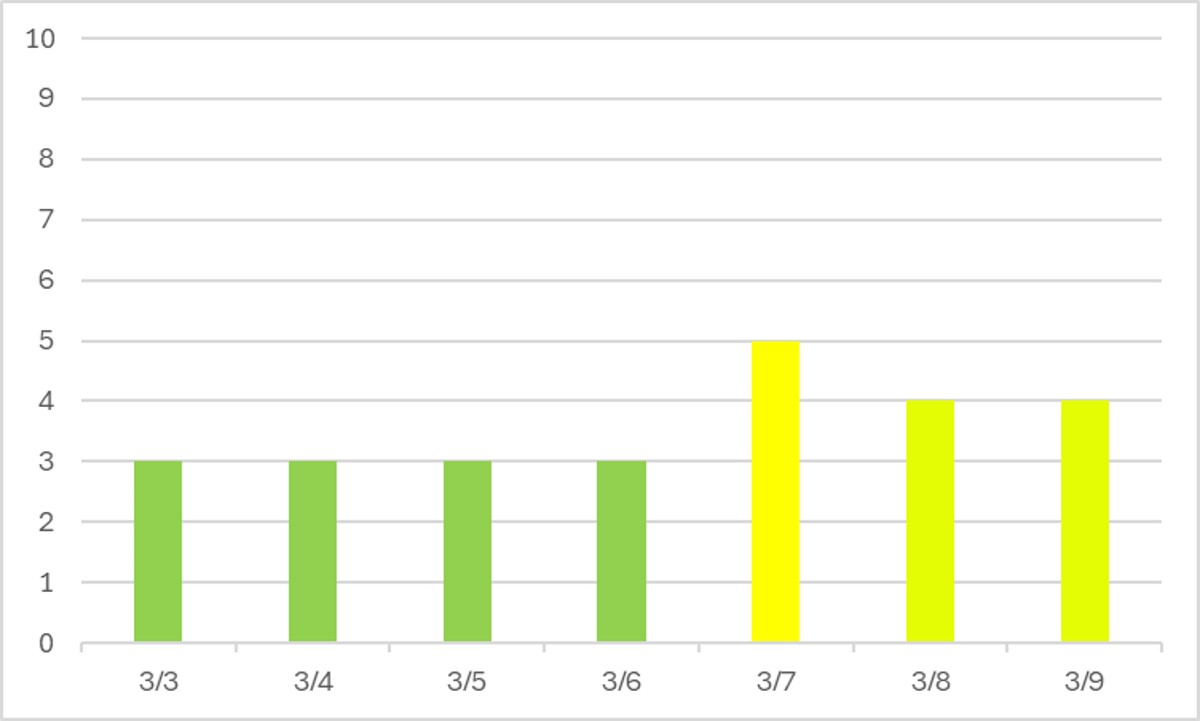
I had previous called out March 1-8 as the best time to visit for the whole month, and it looks like that’s shaping up to be true. After the runDisney crowds went home, the parks calmed down quite a bit, to well below average. The one exception was Saturday the 7th, when it looks like locals flooded the parks before their blockouts start later this month.
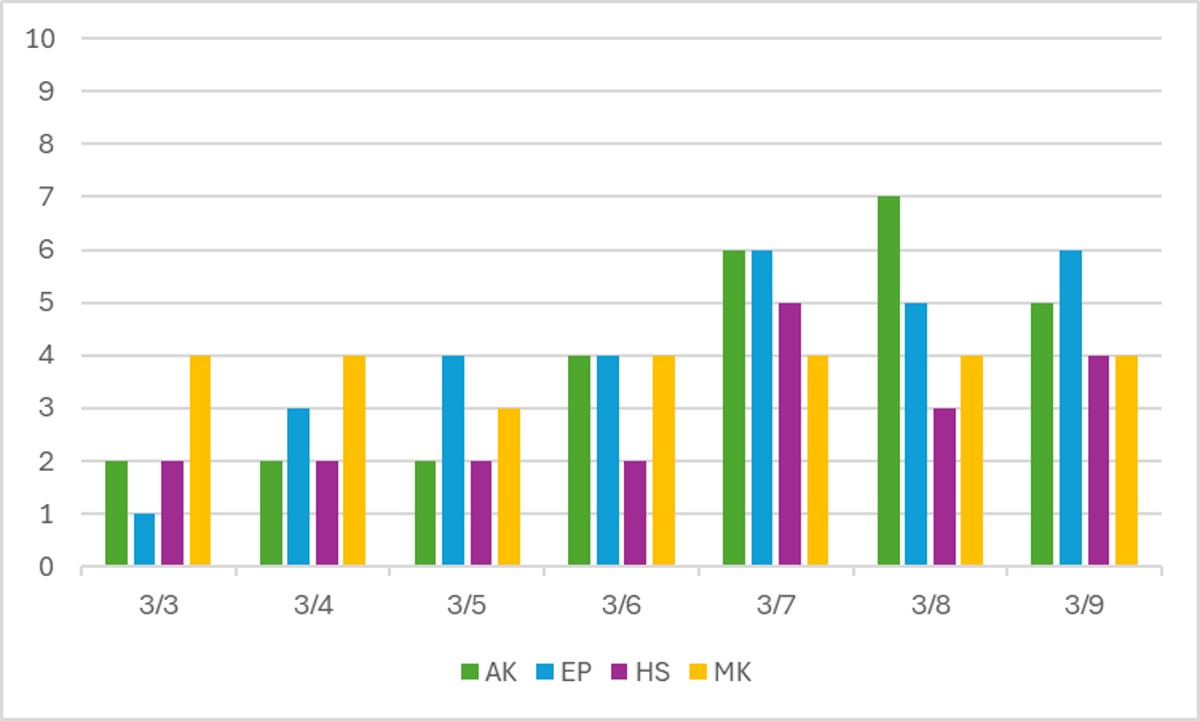
Ah, our steady Magic Kingdom. Reliably able to absorb crowds well – at least at these levels. And the opposite of reliable Magic Kingdom is Animal Kingdom. With Dinoland and Conservation Station now both closed, the few remaining attractions are not able to handle influx of crowds well at all. Wait times spike up VERY quickly. The key to visiting Animal Kingdom for the next few months will be embracing the non-queue areas like the animal walking paths, Wilderness Explorers, and the shows and live performers throughout the park.
Performance of Crowd Level Predictions
Each week, I give you a very transparent look into how the TouringPlans crowd level predictions performed. Each day at each park is one data point, so each week we have 28 different crowd level predictions to evaluate. Any time a prediction is within one or two crowd levels, things won’t really “feel” much different than what was predicted. Being off by 3 or more crowd levels is where you might feel that difference in wait times throughout the day.
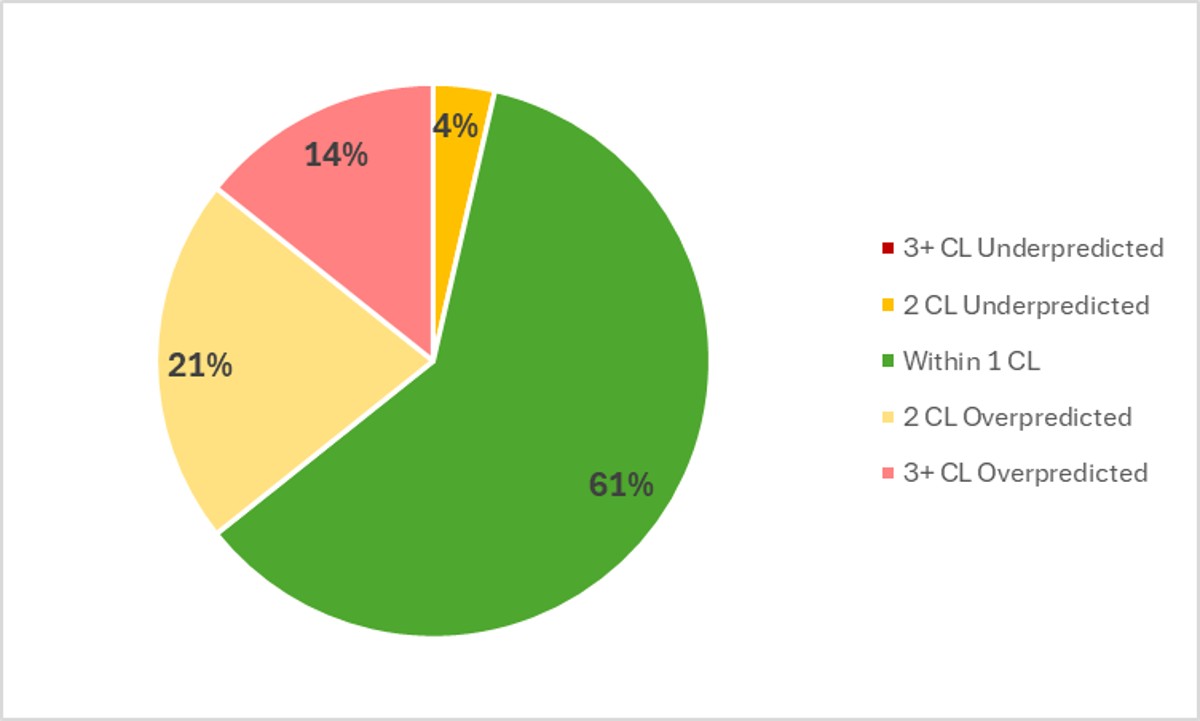
In the past week, Touring Plans predictions were either spot-on or within 1 crowd level 61% of the time, which is down from our all-time high last week. And then 86% of the time Touring Plans predictions were within 2 crowd levels, so that means we get a solid B for our predictions in the past week. We’re currently back to being skewed to overpredictions, with only one underprediction this week. The biggest miss of the week was an over prediction by 3 crowd levels, and it happened 4 different times – twice at Animal Kingdom, once at EPCOT, and once at Magic Kingdom.
Attraction Downtime March 3 – 9
If we average all of the capacity lost due to unexpected downtime over the past week, it comes out to 4.3% of attractions unexpectedly being down. That’s back down from last week, closer to our historical average. In the past week, EPCOT and Animal Kingdom tied as the park with the most overall downtime, averaging 5% of their capacity lost to downtime. That’s a downward trend for EPCOT compared to the last two weeks, but an upward trend for Animal Kingdom.
The worst day for attraction downtime in the past week was on March 4th. On that day, 7% of all capacity at WDW was lost due to unexpected downtime. But the worst park-day of the week happened on March 5th at Animal Kingdom. Prepare yourselves for this one. Because on that day, 23% of attraction capacity at Animal Kingdom was lost due to unexpected downtime. 23%!! That’s almost a quarter of capacity for the whole day. Animal Kingdom was open for 10 hours on the 5th, so 23% downtime is the equivalent of the entire park shutting down for 138 minutes. Over 2 hours of the entire park opening late or shutting down early. Apologies to anyone at Animal Kingdom that day.
Attraction Downtime Worst Offender
This week, Country Bear Musical Jamboree was the WDW attraction with the worst overall unplanned downtime. It was unexpectedly down for 25% of the past week. A quarter of the week! The worst day at Space Mountain over the last week was easily on March 3rd, when it was down for the whole day. And then it was down for more than 76% of the 4th. But after that terrible stretch, it barely had any downtime for the rest of the week.
For those following along on a weekly basis, you’ll remember that Space Mountain “won” this category for 3 out of the past 4 weeks. Good news – it only had 3% downtime in the past week, so hopefully most of its struggles are behind it.

Rope Drop Downtime
Here are problematic offenders from the past week, with the percentage of downtime during the first hour of the day in parentheses:
- Magic Kingdom: Country Bear Musical Jamboree (30%), Pirates of the Caribbean (21%), Monsters Inc Laugh Floor (16%)
- EPCOT: Test Track (33%), Spaceship Earth (23%), Frozen Ever After (20%), Journey Into Imagination (14%)
- Hollywood Studios: Slinky Dog Dash (18%), Alien Swirling Saucers (13%), Toy Story Mania (13%), Rise of the Resistance (12%)
- Animal Kingdom: Kali River Rapids (21%), Kilimanjaro Safaris (10%)
Animal Kingdom’s gold start streak has come to an end. It’s exceedingly rare for Safaris to show up on this list – whenever it does, it likely means that either an animal was blocking the path, or those old safari trucks were having trouble getting started in the morning.
I have to give credit where credit is due, and this week that’s at Magic Kingdom. The rope drop downtime list for Magic Kingdom has been close to 10 attractions long for almost a month now – and this week it’s down to just three! And two of those are shows that shouldn’t be rope drop priorities anyway. Phew.
On the other hand, it was a weirdly bad week for Toy Story Land. Slinky Dog Dash showing up on this list isn’t unusual, but we almost never see Alien Swirling Saucers or Toy Story Mania on here.
Wait Times March 3 – 9
Attractions with the Highest Average Posted Wait at Each Park
- EPCOT: Cosmic Rewind, average posted wait of 75 minutes (was 69 minutes last week)
- Hollywood Studios: Slinky Dog Dash, average posted wait of 68 minutes (was 71 minutes at Rock’n’Roller Coaster last week)
- Magic Kingdom: TRON, average posted wait time of 64 minutes (was 60 minutes last week)
- Animal Kingdom: Flight of Passage, average posted wait time of 57 minutes (was 66 minutes last week)
Thanks to the end of “Diet EPCOT” season, Cosmic Rewind is back on top of the wait time lists for the week. Otherwise, results are a bit of a mixed bag – some higher than last week, some lower. Overall, a pretty calm week at headliners.
Parks with the Highest and Lowest Average Wait
- Highest: Hollywood Studios, average park-wide posted wait of 33 minutes (was 38 minutes last week)
- Lowest: Magic Kingdom, average park-wide posted wait of 21.5 minutes (was 20.5 minutes last week)
From a park-wide perspective, Hollywood Studios, EPCOT, and Animal Kingdom all saw decent week-over-week decreases. Magic Kingdom was the only park that ticked up in its average posted wait … but only by a minute.
Most Inflated Posted Wait Times
We all know that Disney inflates their posted wait times on purpose. They have many reasons for doing this. Some are totally understandable, and some are potentially more problematic. We can figure out how much posted wait times are being inflated by comparing submitted actual wait times from the Lines App and the posted wait time when the person timing their wait entered the line.
Over the past week, actual wait times in the Lines App averaged 75% of what was posted. That’s well above our historical average in the era of Lightning Lanes, which means that posted waits were less inflated than normal. Hooray! Overall, if the posted wait time at a popular attraction was 60 minutes, you could’ve expected to wait just 45 minutes instead.
But the worst inflation offender for the past week was Meet Anna and Elsa at Royal Sommerhus. At this one attraction, submitted actual wait times were only 42% of posted wait times in the past week. That means that if Anna and Elsa had a 30 minute posted wait, you probably would have actually only waited just about 12.5 minutes instead. Less than half of what was posted! Remember to always check the Lines app for predicted actual waits instead of making decisions based on what is posted.

This Week’s Wait Time Rock Star
Between March 3rd and 9th, we had just over 900 timed actual waits submitted through the Lines app. The one person who recorded the most actual waits during that time was gmcc, with 23 overall timed waits – 9 Lightning Lane waits, 8 standby waits, and 6 single rider waits. Thanks for all of that timing, gmcc! It unfortunately does not compete with the the 97 timed waits in a single week from our current timing champion, preef.
Looking Ahead: March 10 – 23
I write this article on Tuesday evenings so that you all have the very freshest of data on Wednesdays. That means the 1oth will already be in the past by the time you’ve read this, so you’re back to the future!
We’ve got two weeks to cover this time, because my family and I will be somewhere in the Caribbean in the middle of next week, with no ability to write the Data Dump!
Here we go … we’re entering true peak Spring Break season. Pirate and Pixie Dust Annual Passes are blocked out March 14-21 (as well as March 29-April 9), which means Disney is expecting crowds. Interestingly, we usually see crowd level dips when Annual Passes get blocked out, because so many guests are locals. I think the 14th-21st won’t be terrible (but higher than average), but then we’ll really see wait times start to climb after that.
Forecasting two weeks of weather is tricky. Over the next week or so, it looks like highs in the 80s and 90s with a decent amount of rain scattered throughout the weekend (Friday through Monday). After that, temperatures drop a bit with highs in the low 60s for a couple of days. That means if you’re travelling for Spring Break soon, you should be prepared for:
- Rain
- Sun
- Heat
- Cold
Good luck with all of that!
Were you in the parks this past week? Or are you headed to Orlando soon? Let me know in the comments below!
You May Also Like...
-

And we're back!! If you're a weekly Disney Data Dump reader, I apologize for the interlude while we went through all…
-
Now this is the late winter/early spring that we know and love. After a couple of weeks of lingering long-weekend chaos,…
In the “Attraction Downtime Worst Offender” section, it appears that you confused Country Bear Musical Jamboree and Space Mountain in the second sentence. You say that Space Mountain was down for the whole day on March 3 and for 76% of the 4th, but in the next paragraph it had only 3% downtime for the week. I’m not a math whiz, but I don’t think that adds up.
Low 60s is cold? Not in my world.
Highs in the low 60s for Florida is cold 😉